| Param | Original file | Final file |
|---|---|---|
| Filename | modeM0/AS1A11_093T01_9000005064_35336cztM0_level2.evt | modeM0/AS1A11_093T01_9000005064_35336cztM0_level2_quad_clean.evt |
| Size (bytes) | 1,328,688,000 | 171,944,640 |
| Size | 1.2 GB | 164.0 MB |
| Events in quadrant A | 6,308,459 | 1,124,927 |
| Events in quadrant B | 17,488,940 | 1,004,384 |
| Events in quadrant C | 6,906,452 | 1,129,466 |
| Events in quadrant D | 8,668,964 | 1,059,411 |
| Mode M0 | |||
|---|---|---|---|
| Quadrant | BADHDUFLAG | Total packets | Discarded packets |
| A | 0 | 26354 | 4 |
| B | 0 | 60787 | 3 |
| C | 0 | 27628 | 3 |
| D | 0 | 34174 | 3 |
| Mode SS | |||
|---|---|---|---|
| Quadrant | BADHDUFLAG | Total packets | Discarded packets |
| A | 0 | 262 | 0 |
| B | 0 | 262 | 0 |
| C | 0 | 262 | 0 |
| D | 0 | 262 | 0 |
| Mode M9 | |||
|---|---|---|---|
| Quadrant | BADHDUFLAG | Total packets | Discarded packets |
| A | 0 | 64 | 0 |
| B | 0 | 64 | 0 |
| C | 0 | 64 | 0 |
| D | 0 | 64 | 0 |
| Quadrant | Total seconds | Saturated seconds | Saturation percentage |
|---|---|---|---|
| A | 12861 | 31 | 0.241039% |
| B | 12861 | 4442 | 34.538527% |
| C | 12861 | 120 | 0.933053% |
| D | 12861 | 379 | 2.946894% |
Noise dominated data is calculated using 1-second bins in cleaned event files. If a bin has >2000 counts, and if more than 50% of those come from <1% of pixels, then it is considered to be noise-dominated and hence unusable.
| Quadrant | # 1 sec bins | Bins with >0 counts | Bins with >2000 counts | High rate bins dominated by noise | Noise dominated (total time) | Noise dominated (detector-on time) | Marked lightcurve |
|---|---|---|---|---|---|---|---|
| A | 19230 | 12864 | 21 | 21 | 0.11% | 0.16% | 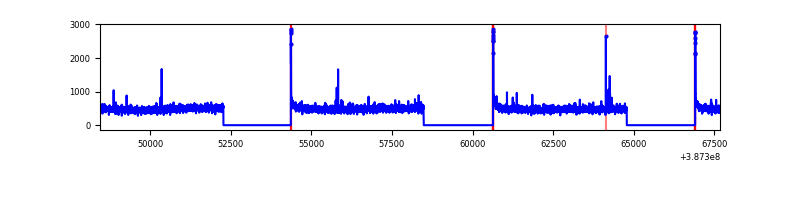 |
| B | 19229 | 12862 | 3584 | 3584 | 18.64% | 27.87% | 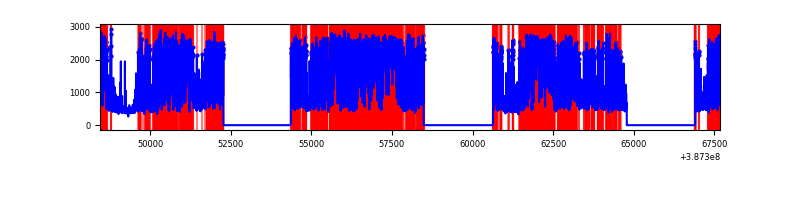 |
| C | 19230 | 12864 | 111 | 111 | 0.58% | 0.86% | 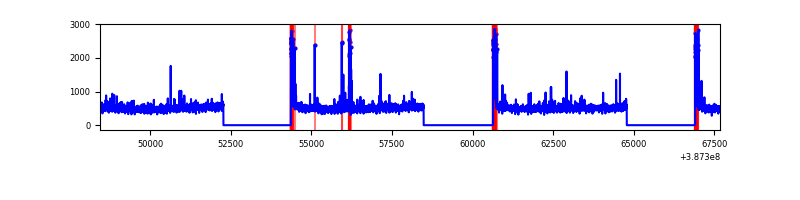 |
| D | 19230 | 12864 | 351 | 351 | 1.83% | 2.73% | 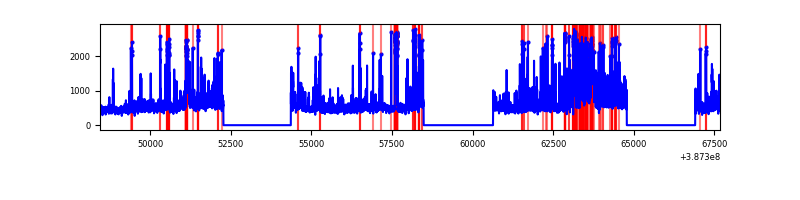 |
Top three noisy pixels from each quadrant. If the there are fewer than three noisy pixels in the level2.evt file, extra rows are filled as -1
| Pixel properties | Quadrant properties | ||||||
|---|---|---|---|---|---|---|---|
| Quadrant | DetID | PixID | Counts | Sigma | Mean | Median | Sigma |
| A | 10 | 83 | 185193 | 594.83 | 1552 | 1523 | 308.8 |
| A | 8 | 192 | 51505 | 161.87 | 1552 | 1523 | 308.8 |
| A | 13 | 6 | 36087 | 111.94 | 1552 | 1523 | 308.8 |
| B | 5 | 236 | 7774422 | 32216.57 | 1306 | 1278 | 241.3 |
| B | 5 | 172 | 4287594 | 17765.06 | 1306 | 1278 | 241.3 |
| B | 4 | 232 | 174700 | 718.76 | 1306 | 1278 | 241.3 |
| C | 15 | 214 | 525840 | 1556.27 | 1484 | 1491 | 336.9 |
| C | 0 | 10 | 501765 | 1484.81 | 1484 | 1491 | 336.9 |
| C | 1 | 23 | 33151 | 93.97 | 1484 | 1491 | 336.9 |
| D | 1 | 52 | 638153 | 1794.95 | 1486 | 1445 | 354.7 |
| D | 8 | 195 | 504135 | 1417.14 | 1486 | 1445 | 354.7 |
| D | 10 | 118 | 328305 | 921.46 | 1486 | 1445 | 354.7 |
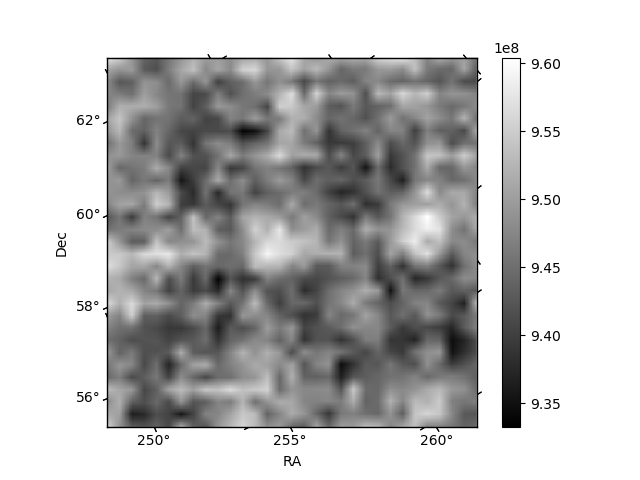
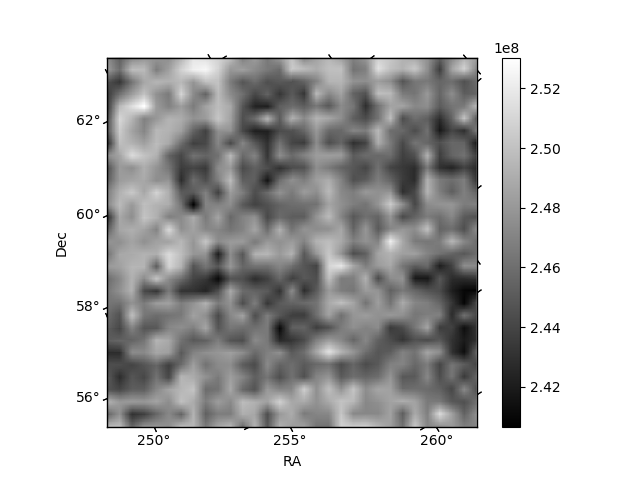
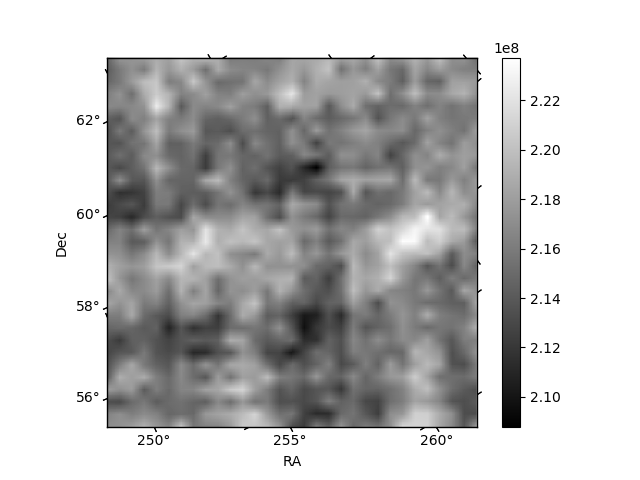
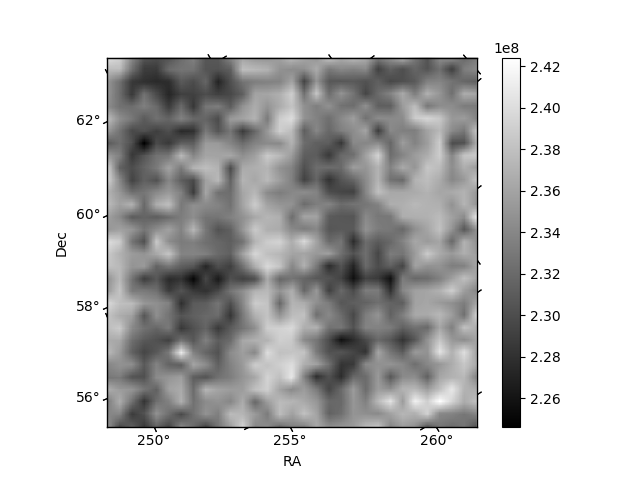
Histogram calculated using DETX and DETY for each event in the final _common_clean file
| Quadrant A | 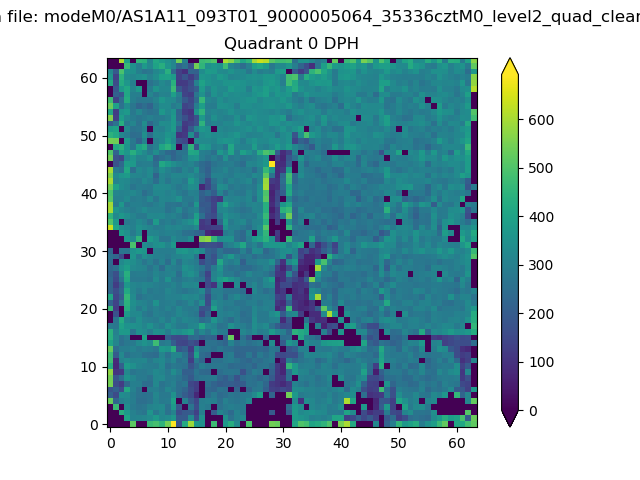 |
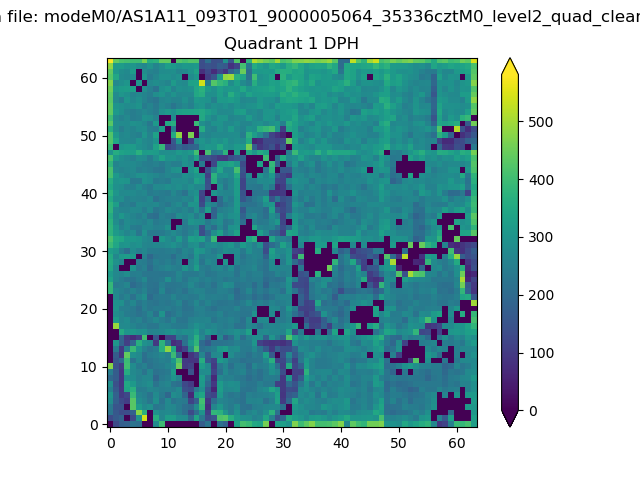 |
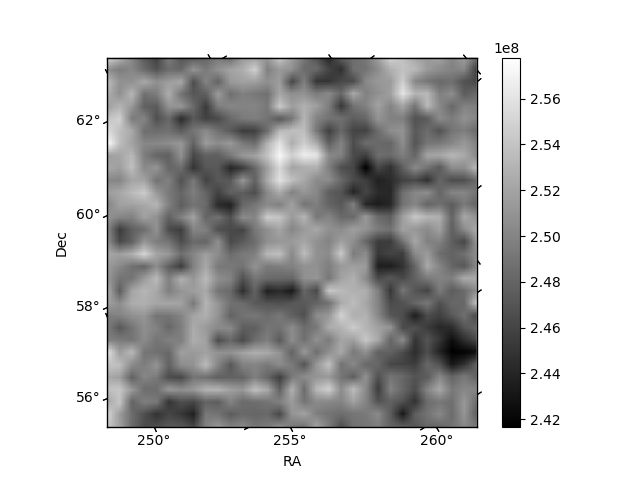
Quadrant B |
|---|---|---|---|
| Quadrant D | 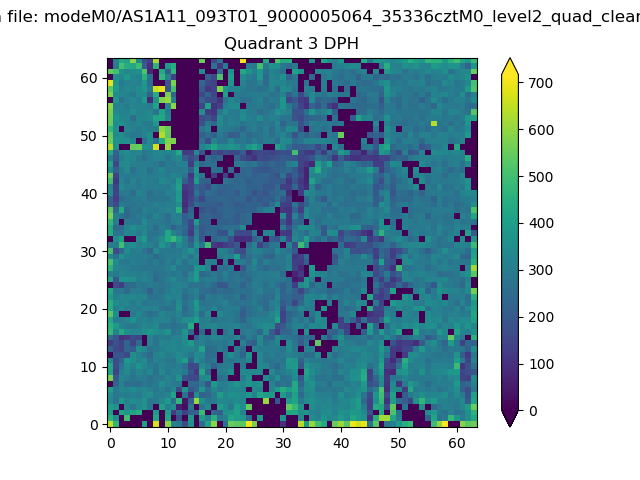 |
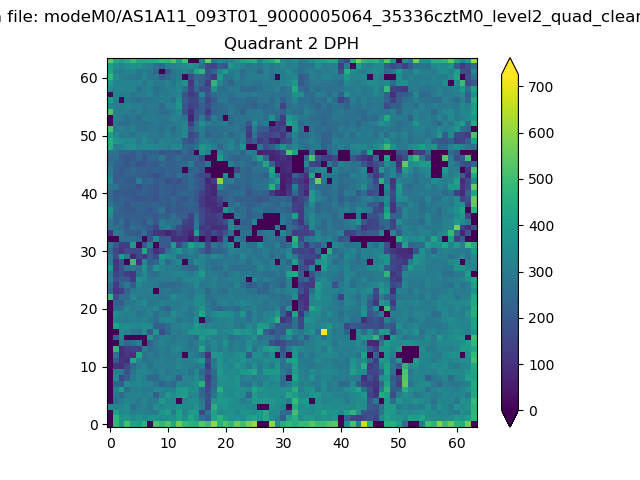 |
Quadrant C |
| Plot type | Count rate plots | Images |
|---|---|---|
| Comparison with Poisson distribution Blue bars denote a histogram of data divided into 1 sec bins. Red curve is a Poisson curve with rate = median count rate of data. |
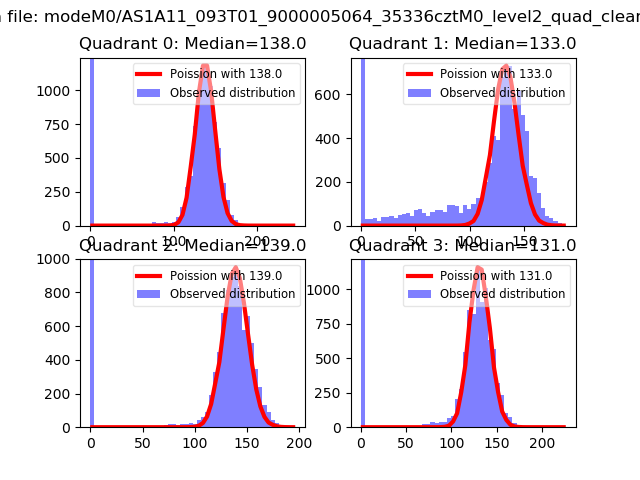 |
 |
| Quadrant-wise count rates Data is divided into 100 sec bins |
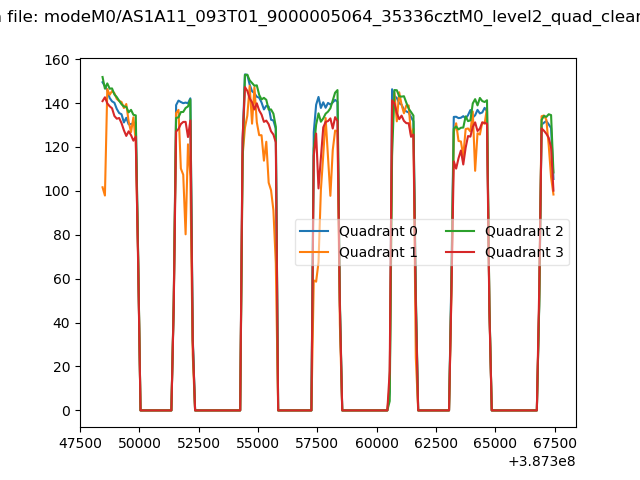 |
|
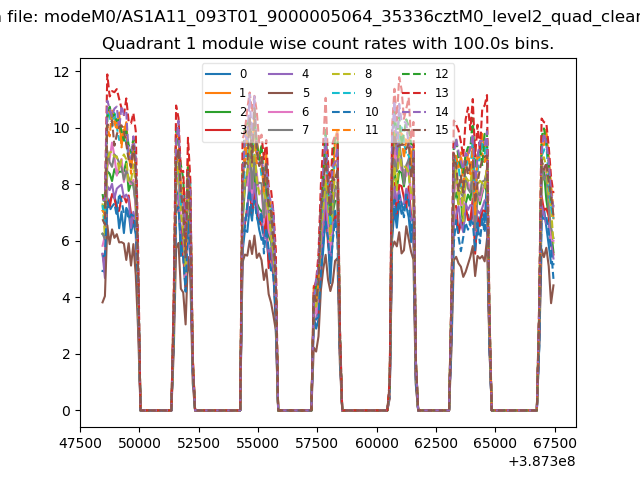
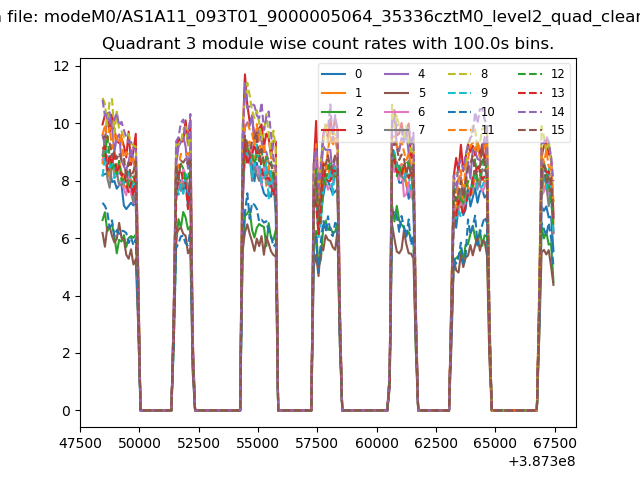
| Module-wise count rates for Quadrant A Data is divided into 100 sec bins |
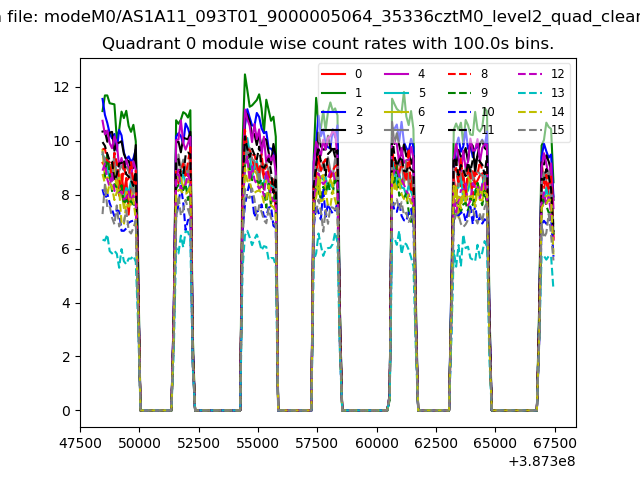 |
 |
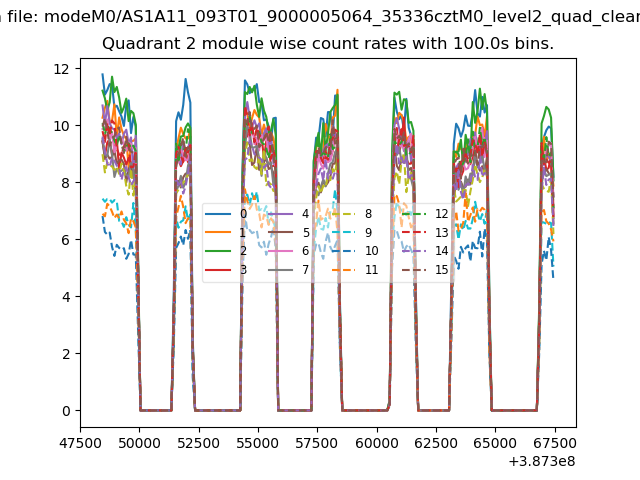
| Module-wise count rates for Quadrant B Data is divided into 100 sec bins |
 |
 |
| Module-wise count rates for Quadrant C Data is divided into 100 sec bins |
 |
 |
| Module-wise count rates for Quadrant D Data is divided into 100 sec bins |
 |
 |
| Parameter | Plot |
|---|---|
| CZT HV Monitor | 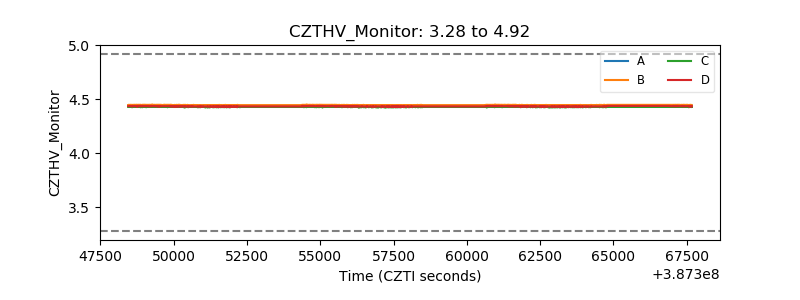 |
| D_VDD | 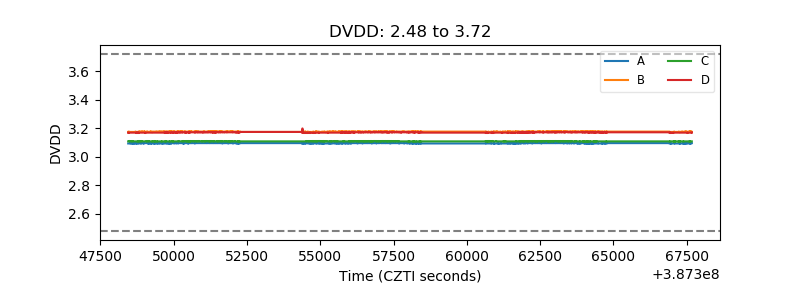 |
| Temperature 1 | 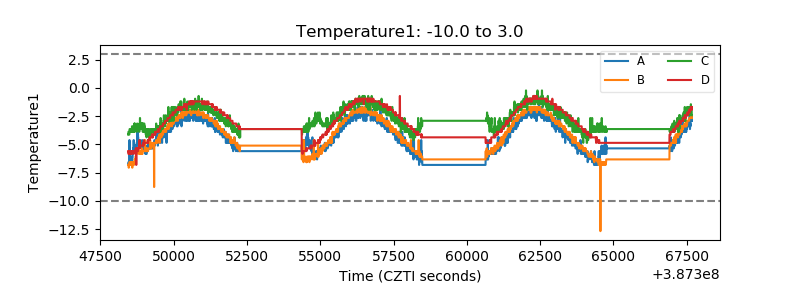 |
| Veto HV Monitor | 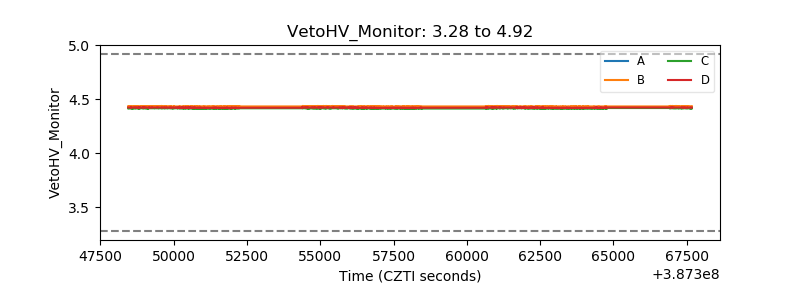 |
| Veto LLD | 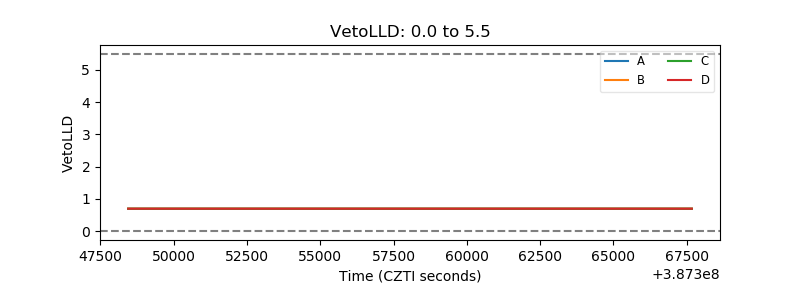 |
| Alpha Counter | 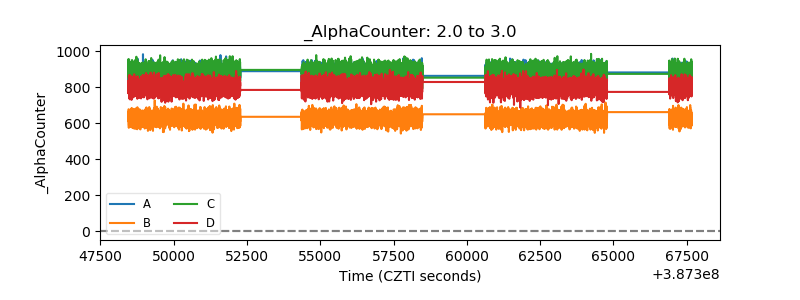 |
| _CPM_Rate | 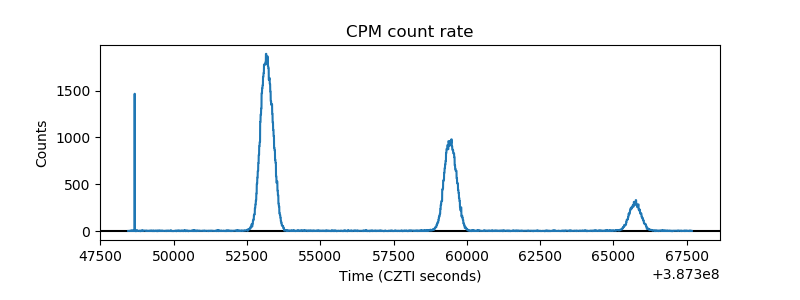 |
| CZT Counter | 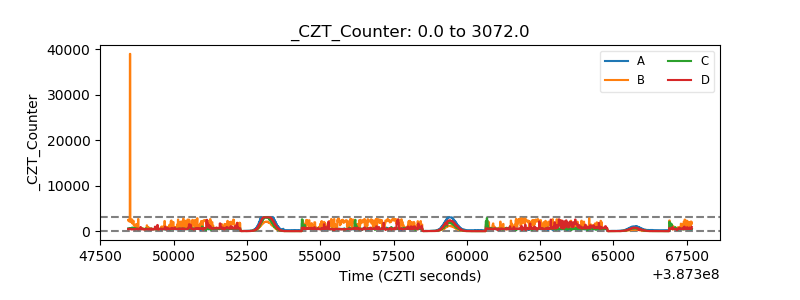 |
| +2.5 Volts monitor | 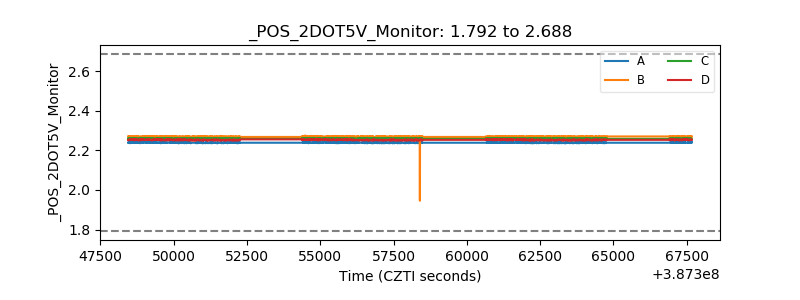 |
| +5 Volts monitor | 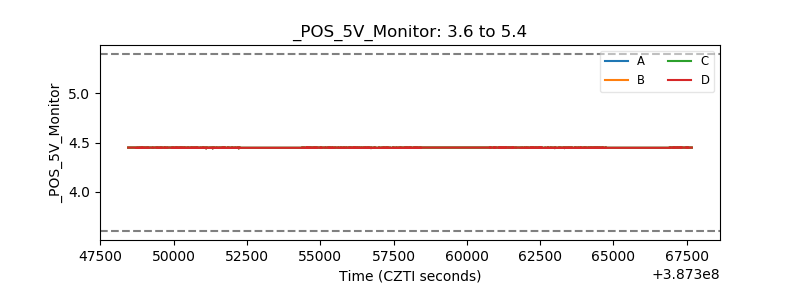 |
| _ROLL_ROT | 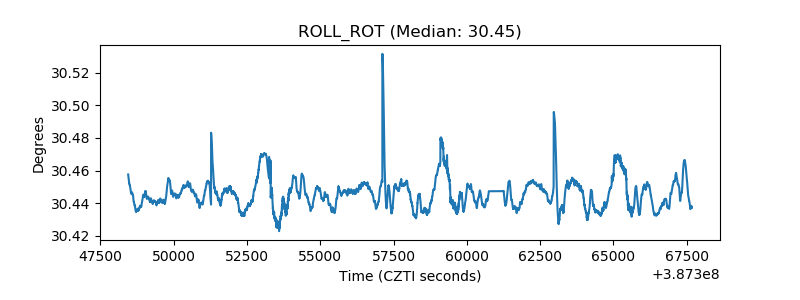 |
| _Roll_DEC | 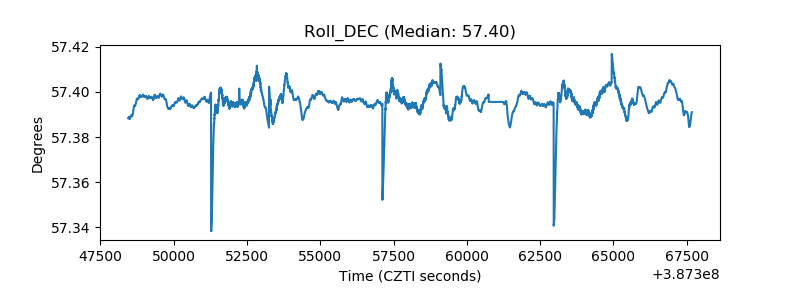 |
| _Roll_RA | 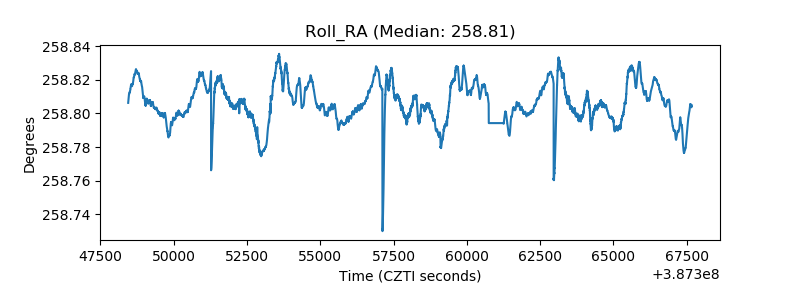 |
| Veto Counter | 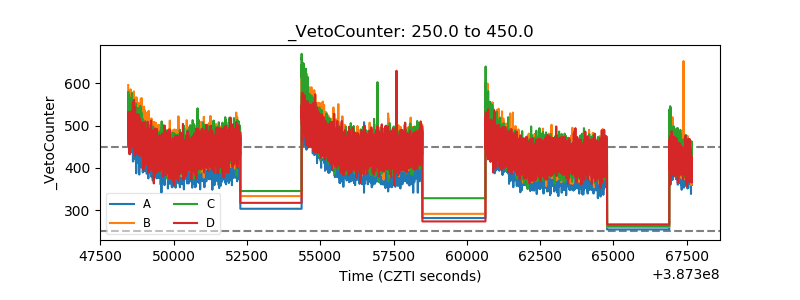 |