| Param | Original file | Final file |
|---|---|---|
| Filename | modeM0/AS1A11_093T01_9000005064_35333cztM0_level2.evt | modeM0/AS1A11_093T01_9000005064_35333cztM0_level2_quad_clean.evt |
| Size (bytes) | 954,440,640 | 121,043,520 |
| Size | 910.2 MB | 115.4 MB |
| Events in quadrant A | 4,266,771 | 789,921 |
| Events in quadrant B | 13,583,597 | 674,588 |
| Events in quadrant C | 5,215,631 | 810,683 |
| Events in quadrant D | 5,231,783 | 765,520 |
| Mode M0 | |||
|---|---|---|---|
| Quadrant | BADHDUFLAG | Total packets | Discarded packets |
| A | 0 | 18400 | 3 |
| B | 0 | 46499 | 2 |
| C | 0 | 21023 | 2 |
| D | 0 | 21742 | 4 |
| Mode SS | |||
|---|---|---|---|
| Quadrant | BADHDUFLAG | Total packets | Discarded packets |
| A | 0 | 184 | 0 |
| B | 0 | 184 | 0 |
| C | 0 | 184 | 0 |
| D | 0 | 184 | 0 |
| Mode M9 | |||
|---|---|---|---|
| Quadrant | BADHDUFLAG | Total packets | Discarded packets |
| A | 0 | 39 | 0 |
| B | 0 | 39 | 0 |
| C | 0 | 39 | 0 |
| D | 0 | 39 | 0 |
| Quadrant | Total seconds | Saturated seconds | Saturation percentage |
|---|---|---|---|
| A | 8993 | 17 | 0.189036% |
| B | 8993 | 3766 | 41.877015% |
| C | 8993 | 156 | 1.734683% |
| D | 8992 | 134 | 1.490214% |
Noise dominated data is calculated using 1-second bins in cleaned event files. If a bin has >2000 counts, and if more than 50% of those come from <1% of pixels, then it is considered to be noise-dominated and hence unusable.
| Quadrant | # 1 sec bins | Bins with >0 counts | Bins with >2000 counts | High rate bins dominated by noise | Noise dominated (total time) | Noise dominated (detector-on time) | Marked lightcurve |
|---|---|---|---|---|---|---|---|
| A | 12878 | 8995 | 10 | 10 | 0.08% | 0.11% | 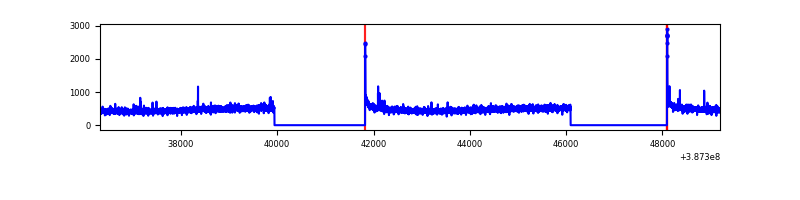 |
| B | 12878 | 8994 | 3183 | 3183 | 24.72% | 35.39% | 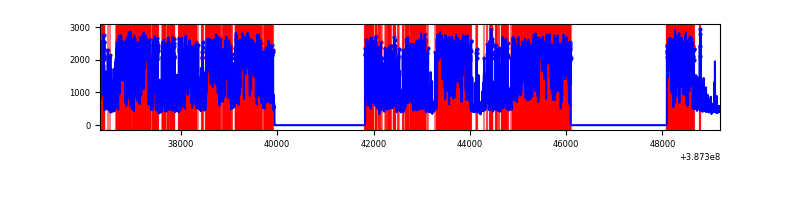 |
| C | 12878 | 8995 | 130 | 130 | 1.01% | 1.45% | 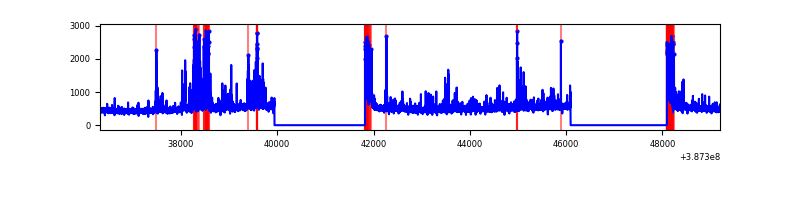 |
| D | 12878 | 8995 | 90 | 90 | 0.70% | 1.00% | 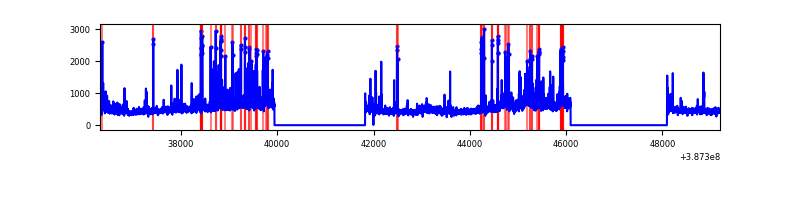 |
Top three noisy pixels from each quadrant. If the there are fewer than three noisy pixels in the level2.evt file, extra rows are filled as -1
| Pixel properties | Quadrant properties | ||||||
|---|---|---|---|---|---|---|---|
| Quadrant | DetID | PixID | Counts | Sigma | Mean | Median | Sigma |
| A | 10 | 83 | 126537 | 601.89 | 1051 | 1032 | 208.5 |
| A | 8 | 192 | 22928 | 105.01 | 1051 | 1032 | 208.5 |
| A | 13 | 6 | 19383 | 88.01 | 1051 | 1032 | 208.5 |
| B | 5 | 236 | 6610310 | 41069.81 | 865 | 844 | 160.9 |
| B | 5 | 172 | 3489273 | 21676.35 | 865 | 844 | 160.9 |
| B | 4 | 232 | 60465 | 370.47 | 865 | 844 | 160.9 |
| C | 0 | 10 | 522284 | 2267.83 | 1008 | 1013 | 229.9 |
| C | 15 | 214 | 366221 | 1588.87 | 1008 | 1013 | 229.9 |
| C | 1 | 23 | 362061 | 1570.77 | 1008 | 1013 | 229.9 |
| D | 8 | 195 | 557428 | 2298.68 | 1007 | 978 | 242.1 |
| D | 12 | 235 | 222095 | 913.43 | 1007 | 978 | 242.1 |
| D | 1 | 52 | 121500 | 497.87 | 1007 | 978 | 242.1 |
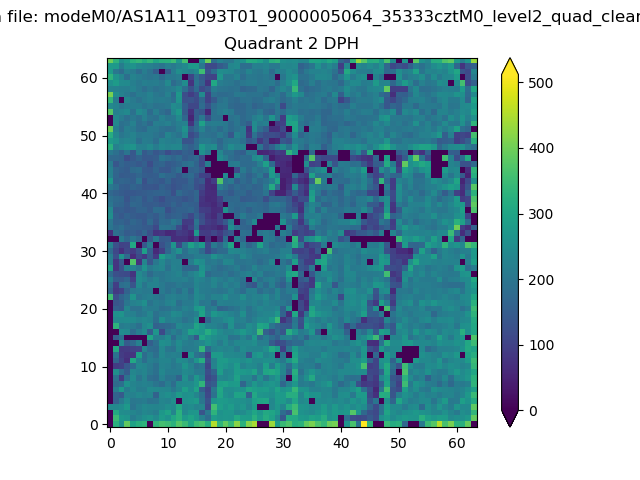
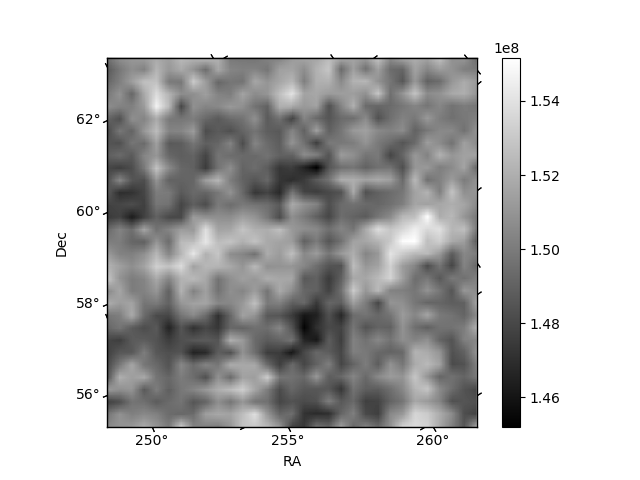
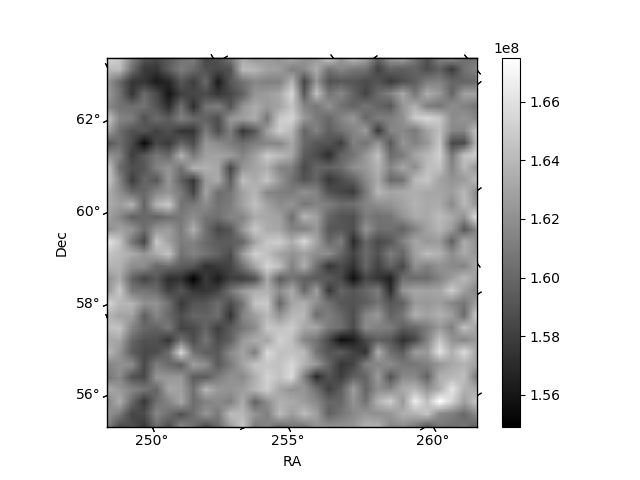
Histogram calculated using DETX and DETY for each event in the final _common_clean file
| Quadrant A | 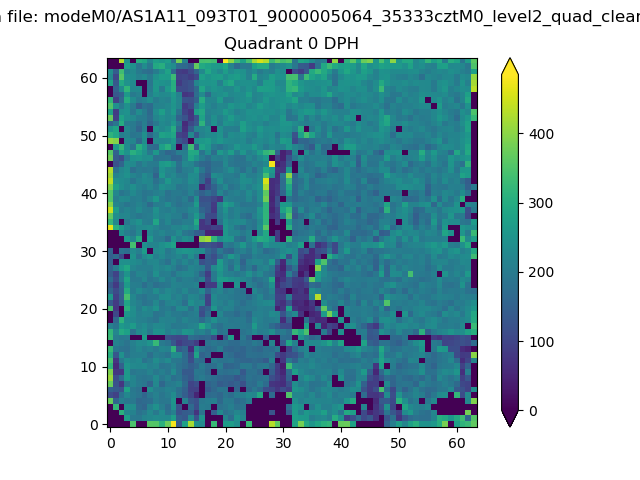 |
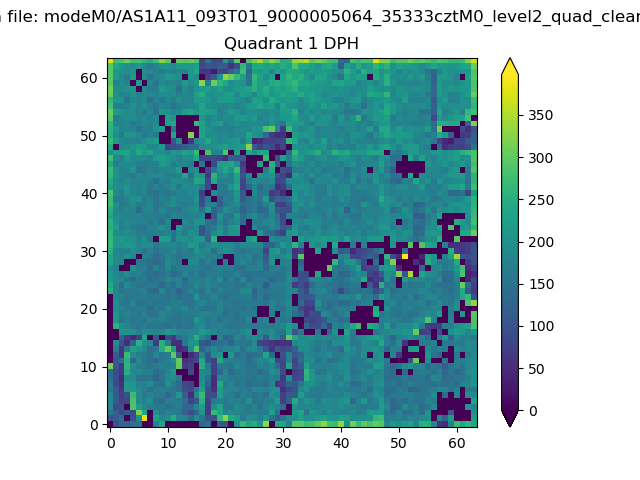 |
Quadrant B |
|---|---|---|---|
| Quadrant D | 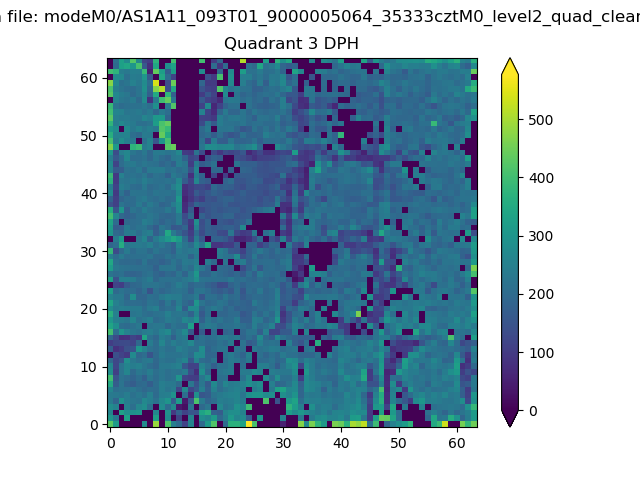 |
 |
Quadrant C |
| Plot type | Count rate plots | Images |
|---|---|---|
| Comparison with Poisson distribution Blue bars denote a histogram of data divided into 1 sec bins. Red curve is a Poisson curve with rate = median count rate of data. |
 |
 |
| Quadrant-wise count rates Data is divided into 100 sec bins |
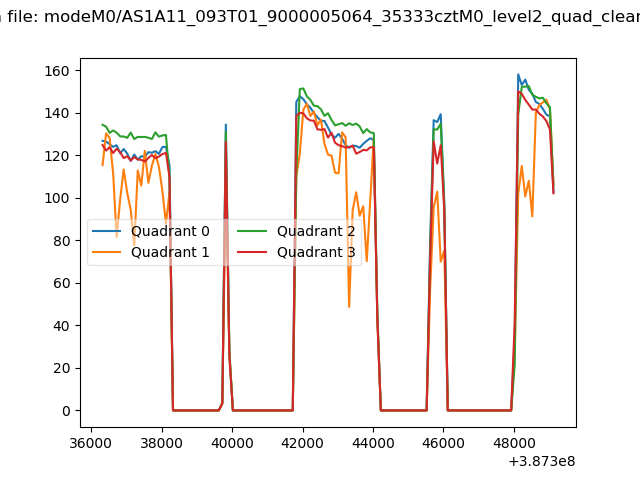 |
|
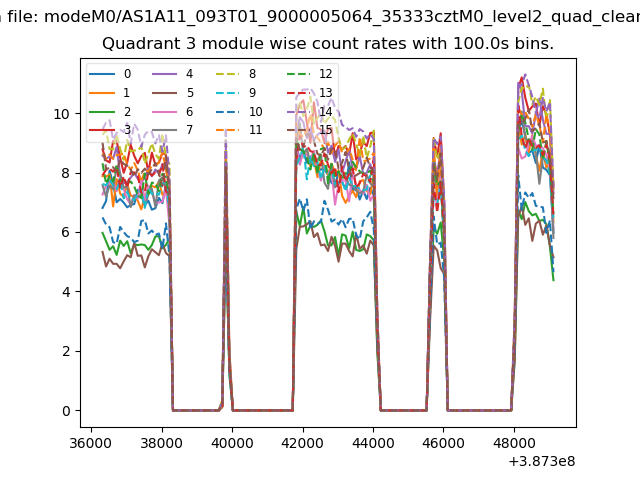
| Module-wise count rates for Quadrant A Data is divided into 100 sec bins |
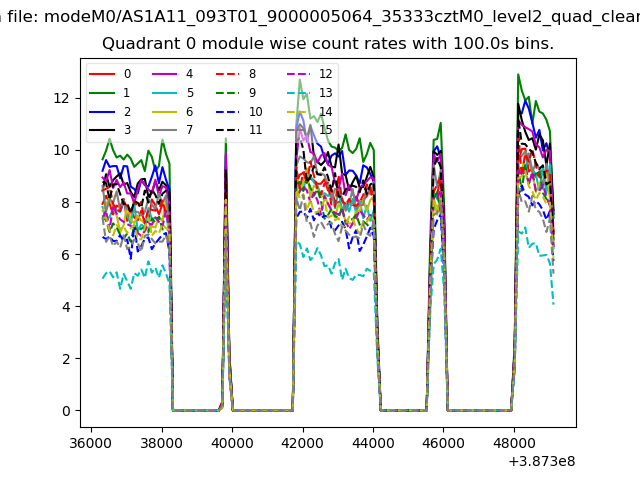 |
 |
| Module-wise count rates for Quadrant B Data is divided into 100 sec bins |
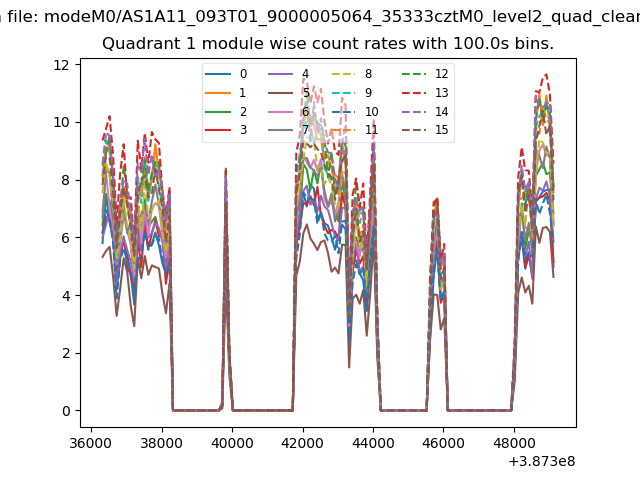 |
 |
| Module-wise count rates for Quadrant C Data is divided into 100 sec bins |
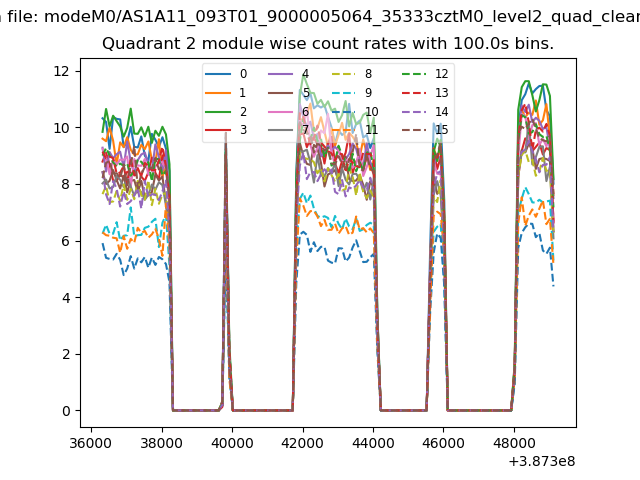 |
 |
| Module-wise count rates for Quadrant D Data is divided into 100 sec bins |
 |
 |
| Parameter | Plot |
|---|---|
| CZT HV Monitor | 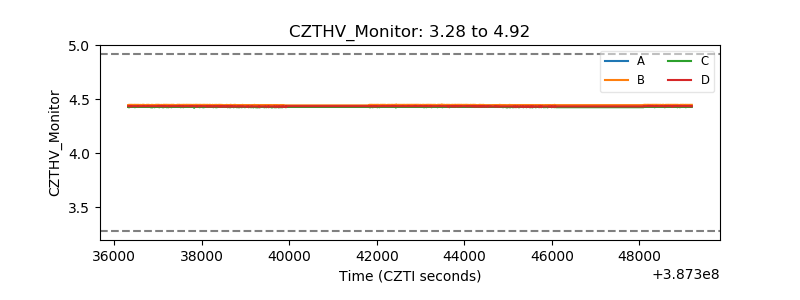 |
| D_VDD | 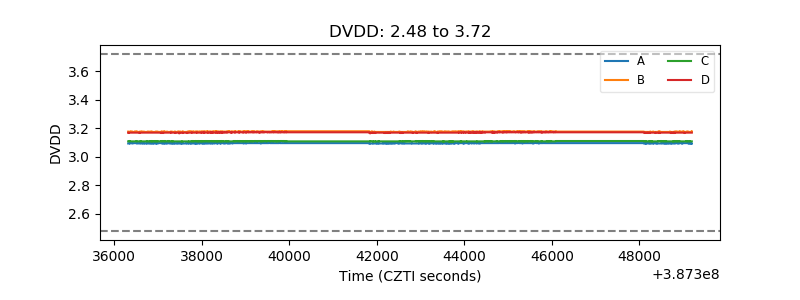 |
| Temperature 1 | 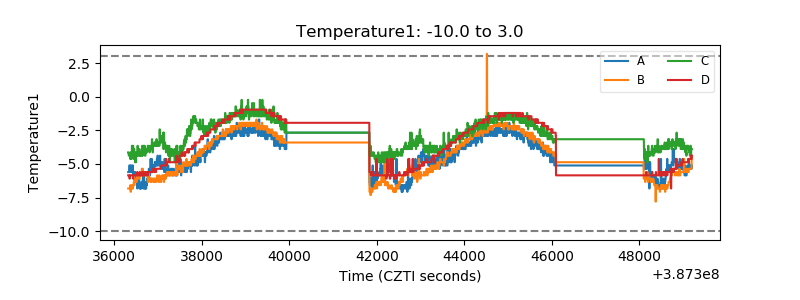 |
| Veto HV Monitor | 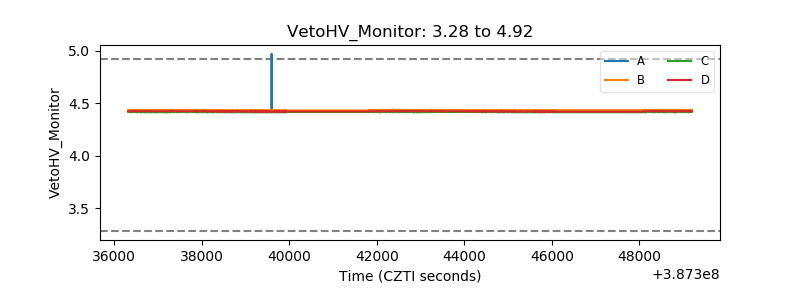 |
| Veto LLD | 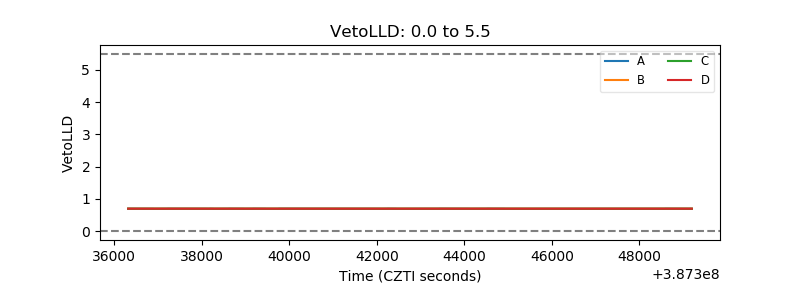 |
| Alpha Counter | 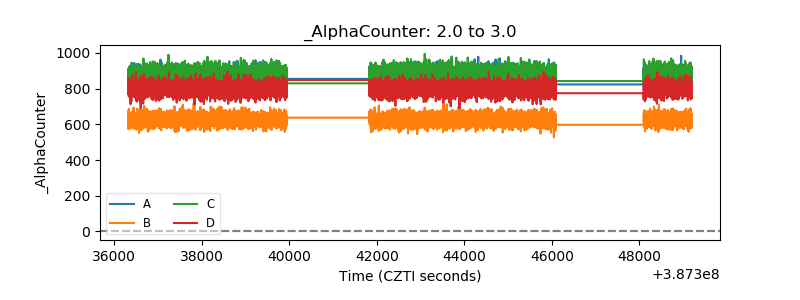 |
| _CPM_Rate | 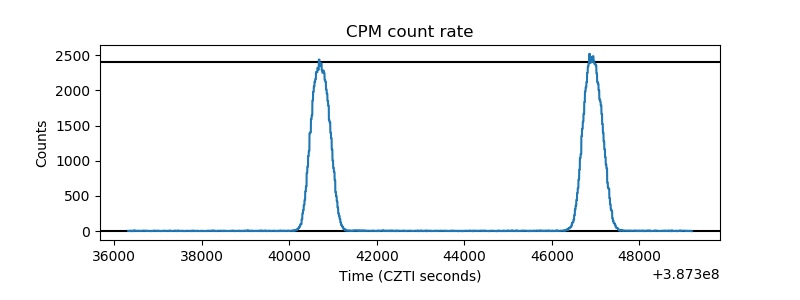 |
| CZT Counter | 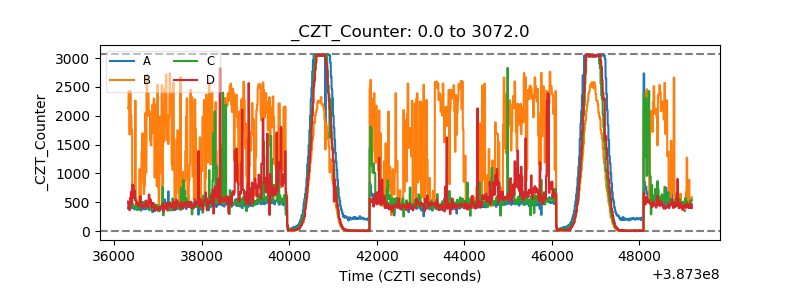 |
| +2.5 Volts monitor | 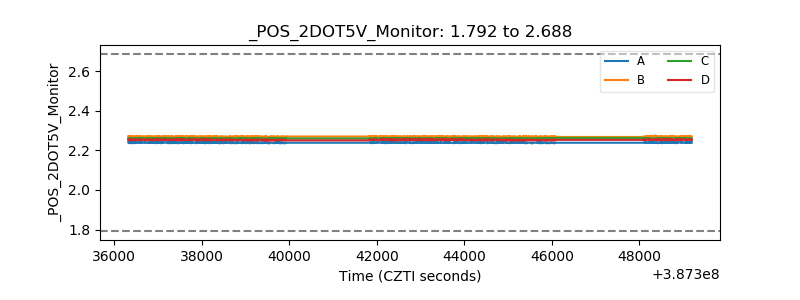 |
| +5 Volts monitor | 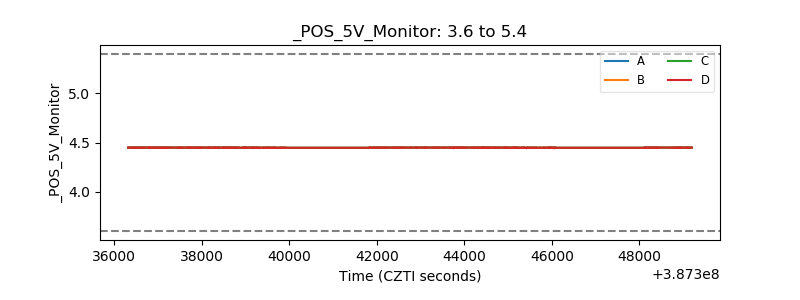 |
| _ROLL_ROT | 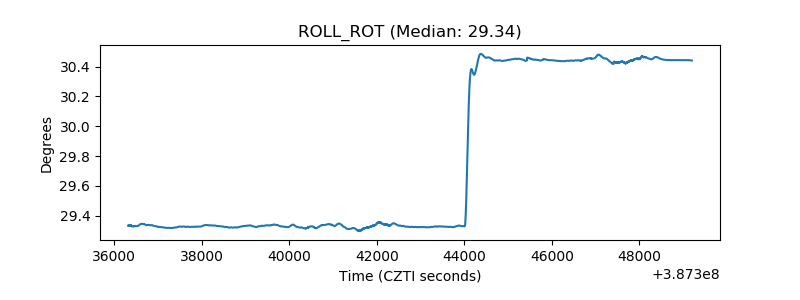 |
| _Roll_DEC | 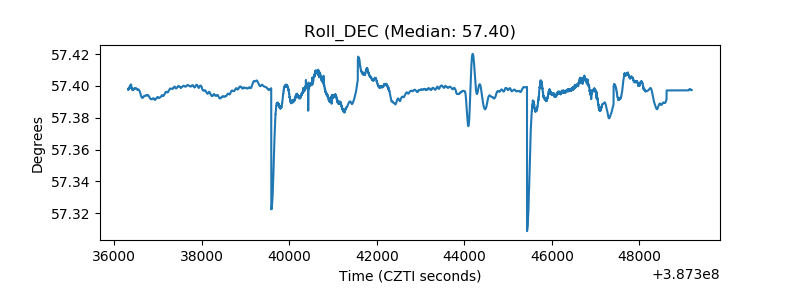 |
| _Roll_RA | 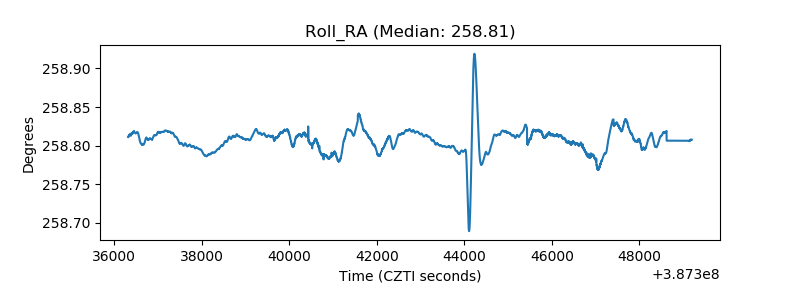 |
| Veto Counter | 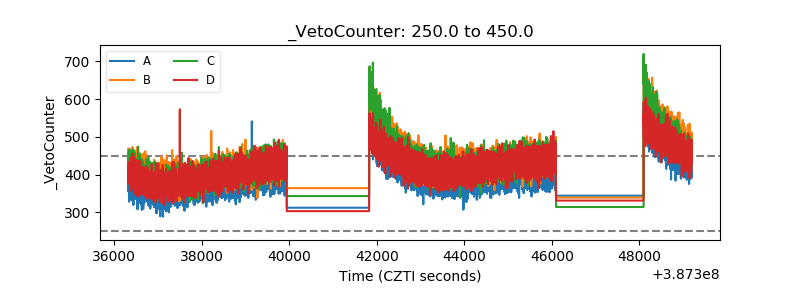 |