| Param | Original file | Final file |
|---|---|---|
| Filename | modeM0/AS1A11_093T01_9000005064_35332cztM0_level2.evt | modeM0/AS1A11_093T01_9000005064_35332cztM0_level2_quad_clean.evt |
| Size (bytes) | 577,111,680 | 77,685,120 |
| Size | 550.4 MB | 74.1 MB |
| Events in quadrant A | 2,579,521 | 507,137 |
| Events in quadrant B | 8,169,341 | 448,738 |
| Events in quadrant C | 3,218,328 | 523,531 |
| Events in quadrant D | 3,144,662 | 494,601 |
| Mode M0 | |||
|---|---|---|---|
| Quadrant | BADHDUFLAG | Total packets | Discarded packets |
| A | 0 | 11166 | 3 |
| B | 0 | 28008 | 2 |
| C | 0 | 12944 | 2 |
| D | 0 | 13019 | 2 |
| Mode SS | |||
|---|---|---|---|
| Quadrant | BADHDUFLAG | Total packets | Discarded packets |
| A | 0 | 110 | 0 |
| B | 0 | 110 | 0 |
| C | 0 | 110 | 0 |
| D | 0 | 110 | 0 |
| Mode M9 | |||
|---|---|---|---|
| Quadrant | BADHDUFLAG | Total packets | Discarded packets |
| A | 0 | 27 | 0 |
| B | 0 | 27 | 0 |
| C | 0 | 27 | 0 |
| D | 0 | 28 | 0 |
| Quadrant | Total seconds | Saturated seconds | Saturation percentage |
|---|---|---|---|
| A | 5397 | 14 | 0.259403% |
| B | 5397 | 2138 | 39.614601% |
| C | 5397 | 129 | 2.390217% |
| D | 5397 | 74 | 1.371132% |
Noise dominated data is calculated using 1-second bins in cleaned event files. If a bin has >2000 counts, and if more than 50% of those come from <1% of pixels, then it is considered to be noise-dominated and hence unusable.
| Quadrant | # 1 sec bins | Bins with >0 counts | Bins with >2000 counts | High rate bins dominated by noise | Noise dominated (total time) | Noise dominated (detector-on time) | Marked lightcurve |
|---|---|---|---|---|---|---|---|
| A | 7280 | 5398 | 10 | 10 | 0.14% | 0.19% | 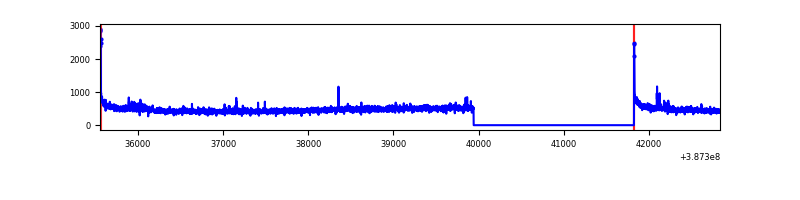 |
| B | 7280 | 5398 | 1781 | 1781 | 24.46% | 32.99% | 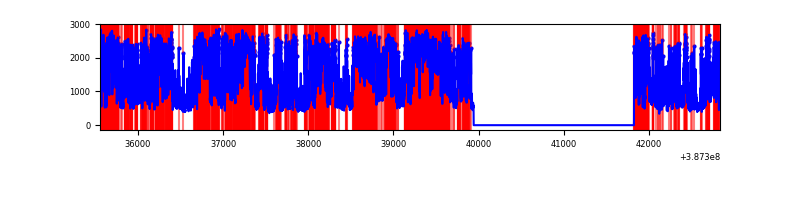 |
| C | 7280 | 5398 | 92 | 92 | 1.26% | 1.70% | 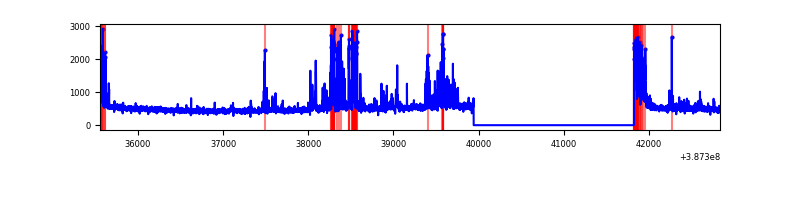 |
| D | 7280 | 5398 | 48 | 48 | 0.66% | 0.89% | 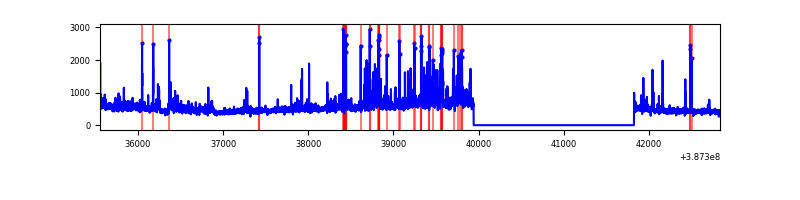 |
Top three noisy pixels from each quadrant. If the there are fewer than three noisy pixels in the level2.evt file, extra rows are filled as -1
| Pixel properties | Quadrant properties | ||||||
|---|---|---|---|---|---|---|---|
| Quadrant | DetID | PixID | Counts | Sigma | Mean | Median | Sigma |
| A | 10 | 83 | 99705 | 796.36 | 619 | 608 | 124.4 |
| A | 8 | 192 | 22086 | 172.6 | 619 | 608 | 124.4 |
| A | 12 | 16 | 21022 | 164.05 | 619 | 608 | 124.4 |
| B | 5 | 236 | 5155808 | 52575.29 | 523 | 509 | 98.1 |
| B | 5 | 172 | 899100 | 9164.1 | 523 | 509 | 98.1 |
| B | 4 | 232 | 40868 | 411.59 | 523 | 509 | 98.1 |
| C | 1 | 23 | 334844 | 2441.87 | 600 | 605 | 136.9 |
| C | 0 | 10 | 293808 | 2142.07 | 600 | 605 | 136.9 |
| C | 15 | 214 | 225845 | 1645.55 | 600 | 605 | 136.9 |
| D | 8 | 195 | 386389 | 2673.37 | 595 | 577 | 144.3 |
| D | 1 | 52 | 120610 | 831.73 | 595 | 577 | 144.3 |
| D | 12 | 233 | 70559 | 484.92 | 595 | 577 | 144.3 |
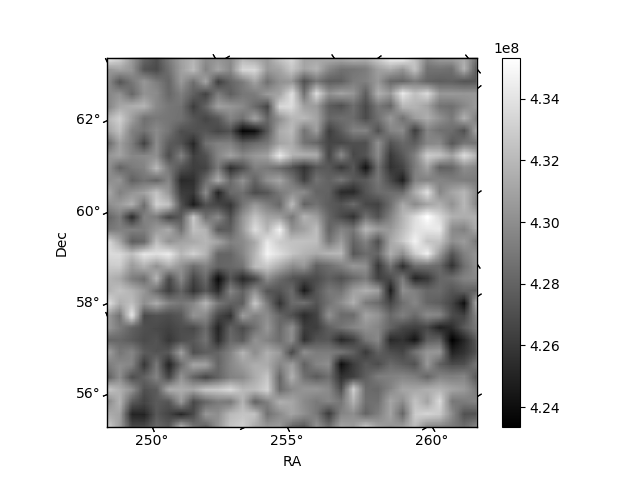
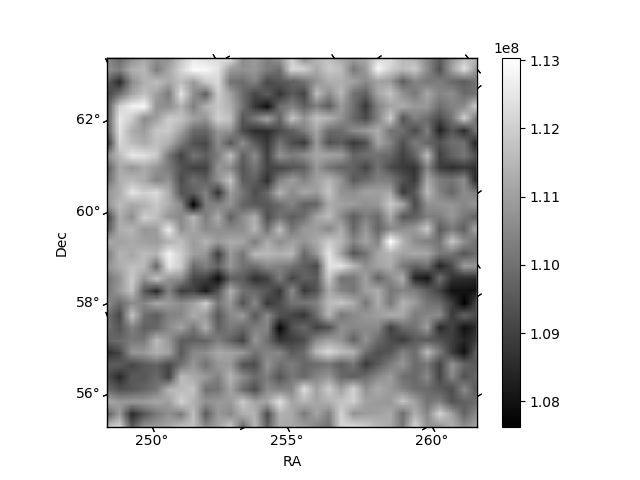
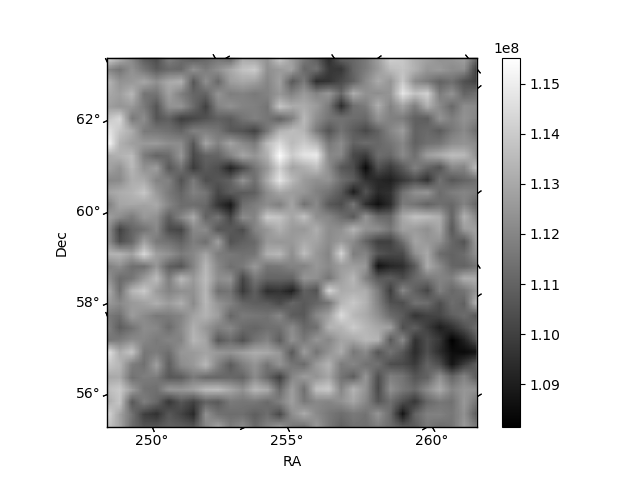
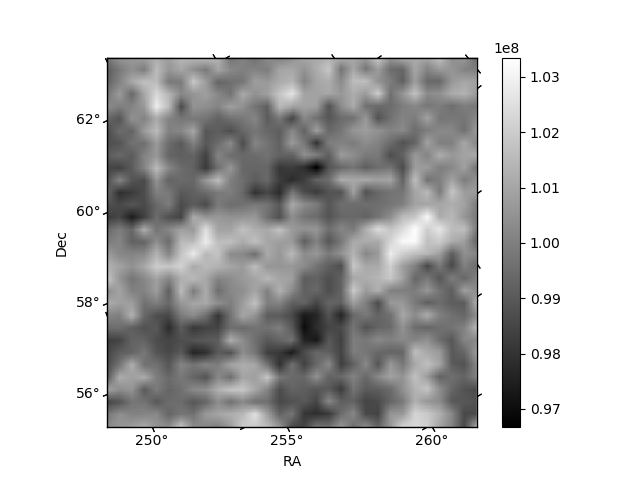
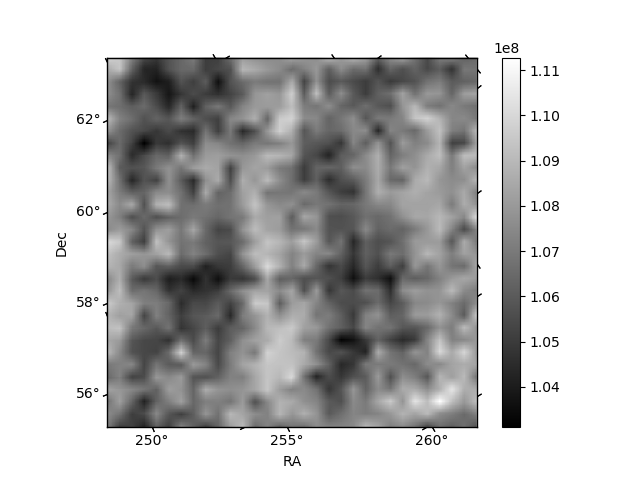
Histogram calculated using DETX and DETY for each event in the final _common_clean file
| Quadrant A | 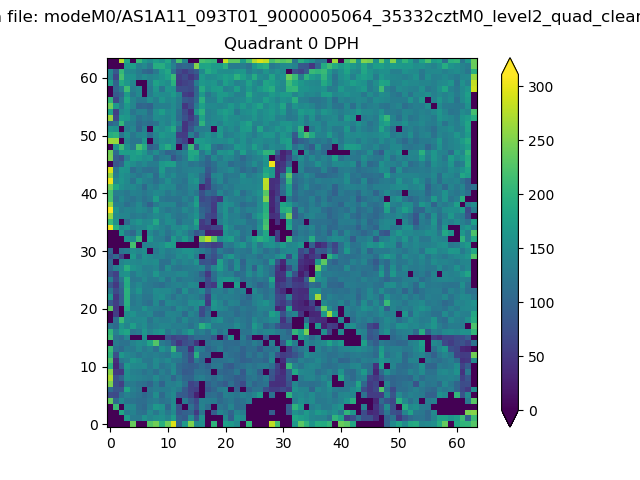 |
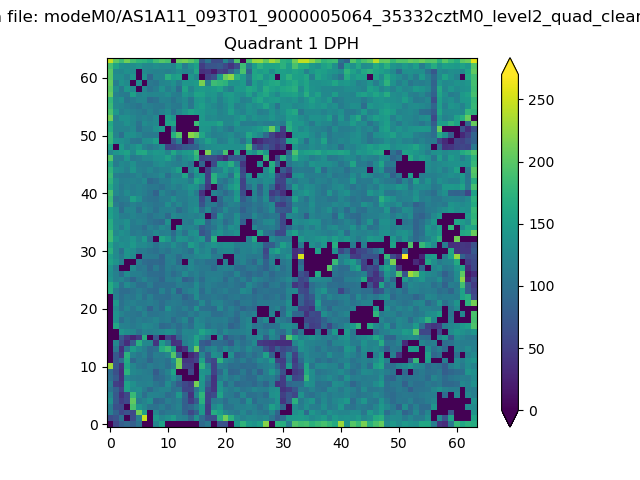 |
Quadrant B |
|---|---|---|---|
| Quadrant D | 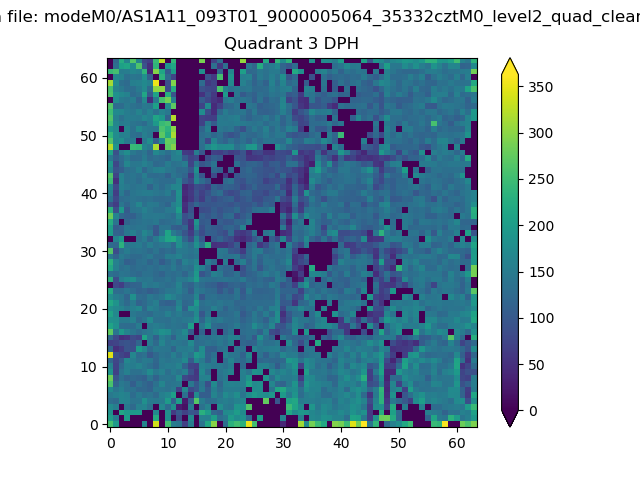 |
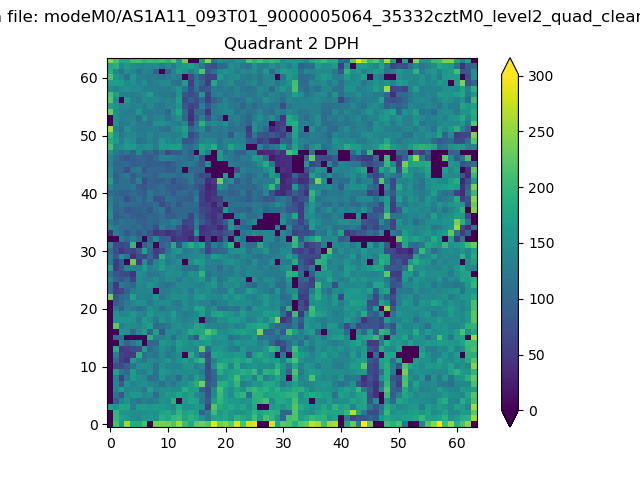 |
Quadrant C |
| Plot type | Count rate plots | Images |
|---|---|---|
| Comparison with Poisson distribution Blue bars denote a histogram of data divided into 1 sec bins. Red curve is a Poisson curve with rate = median count rate of data. |
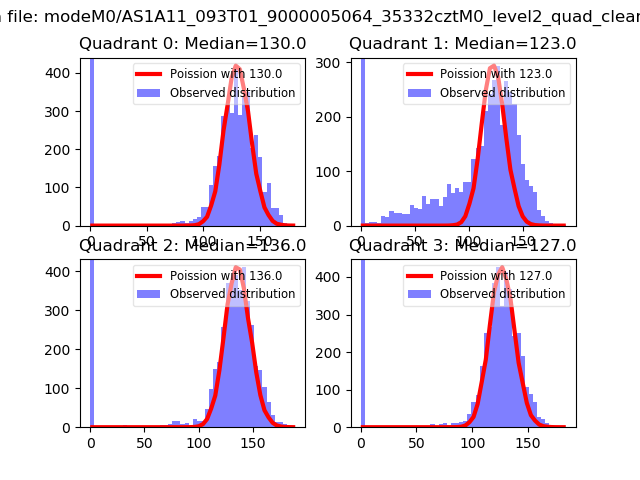 |
 |
| Quadrant-wise count rates Data is divided into 100 sec bins |
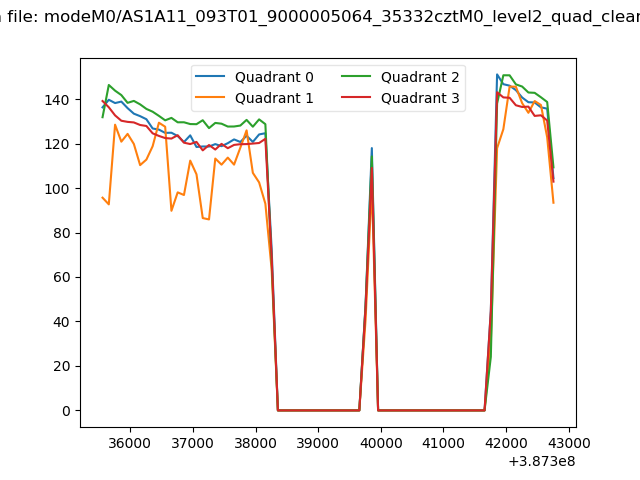 |
|
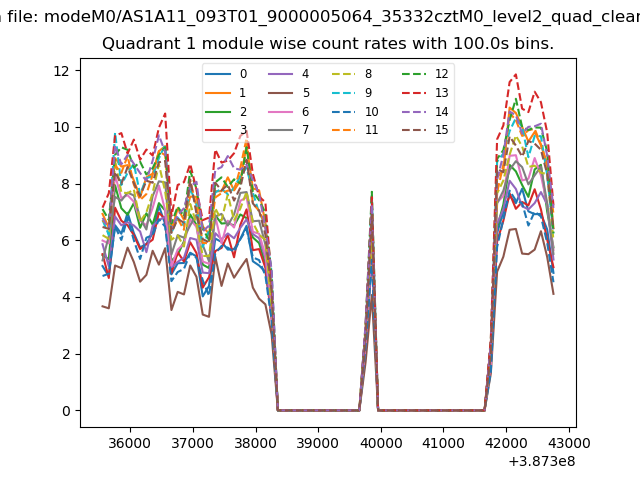
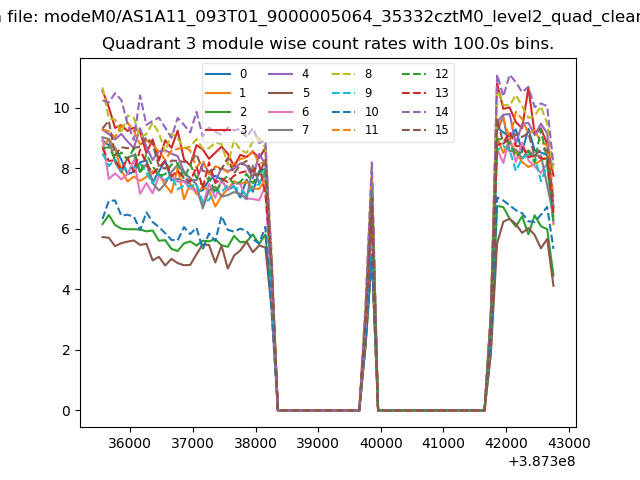
| Module-wise count rates for Quadrant A Data is divided into 100 sec bins |
 |
 |
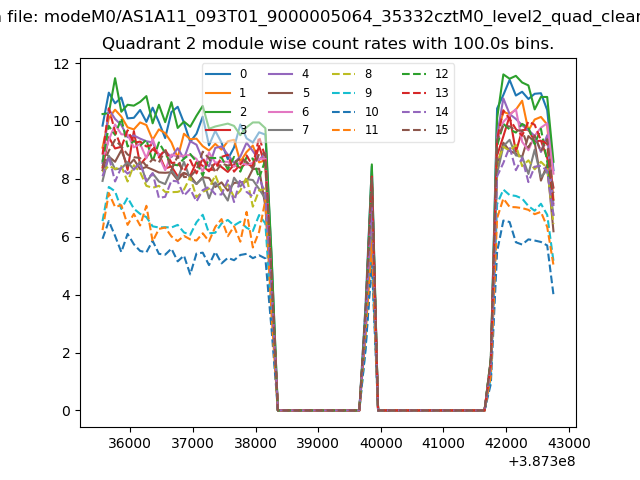
| Module-wise count rates for Quadrant B Data is divided into 100 sec bins |
 |
 |
| Module-wise count rates for Quadrant C Data is divided into 100 sec bins |
 |
 |
| Module-wise count rates for Quadrant D Data is divided into 100 sec bins |
 |
 |
| Parameter | Plot |
|---|---|
| CZT HV Monitor | 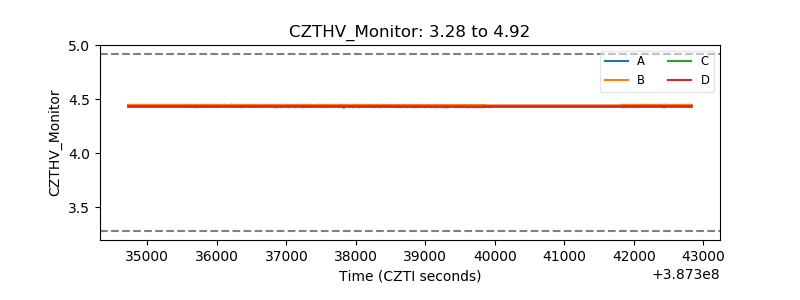 |
| D_VDD | 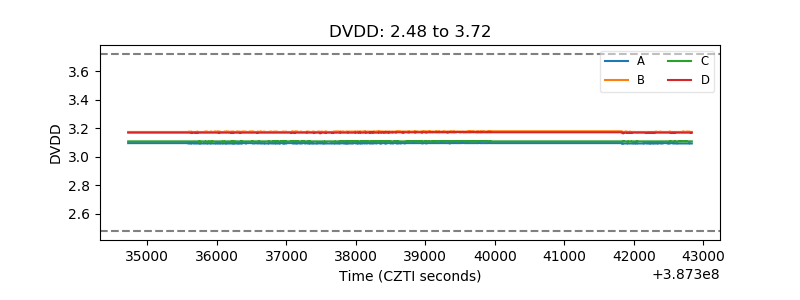 |
| Temperature 1 | 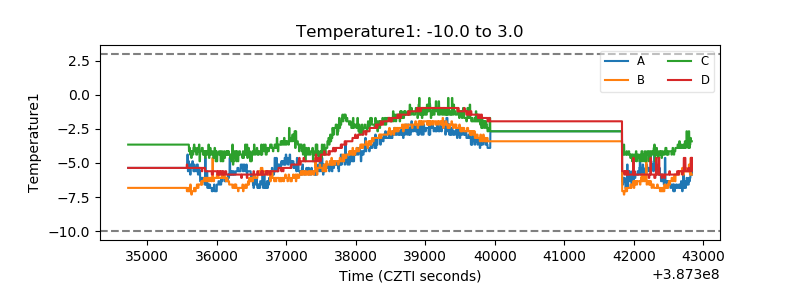 |
| Veto HV Monitor | 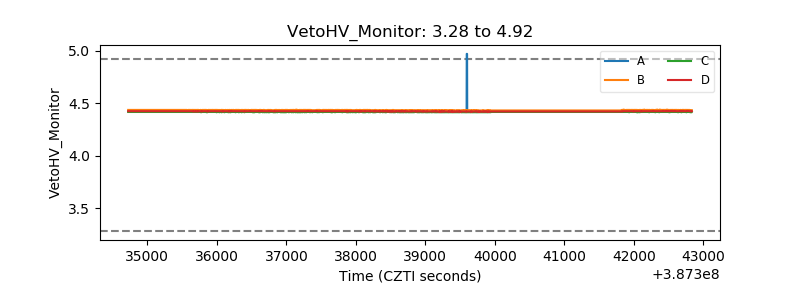 |
| Veto LLD | 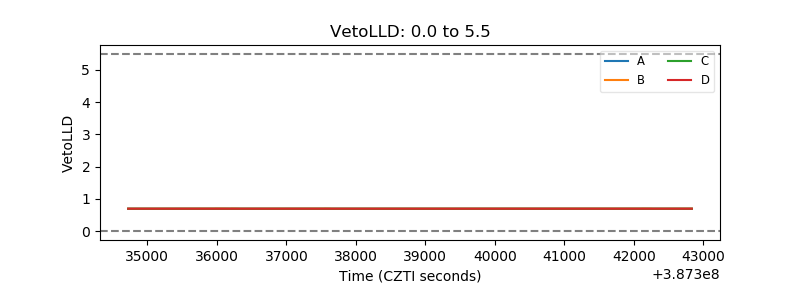 |
| Alpha Counter | 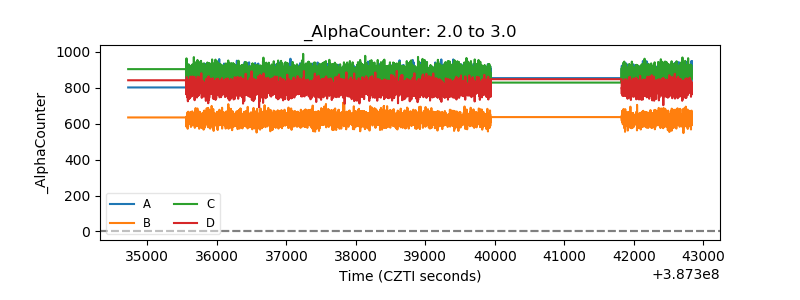 |
| _CPM_Rate | 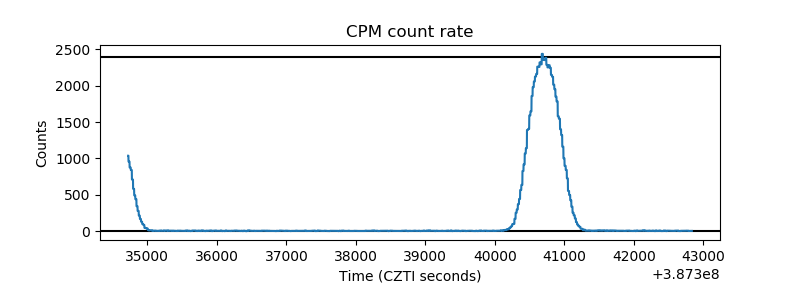 |
| CZT Counter | 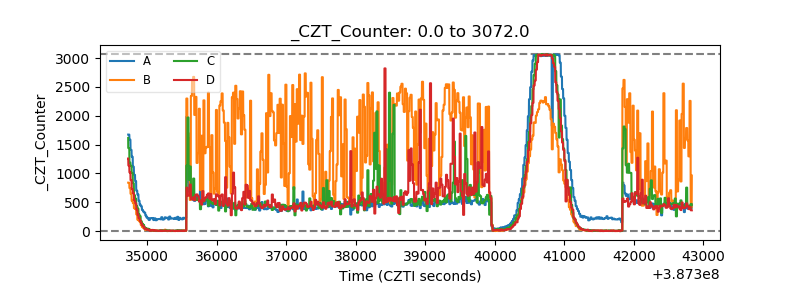 |
| +2.5 Volts monitor | 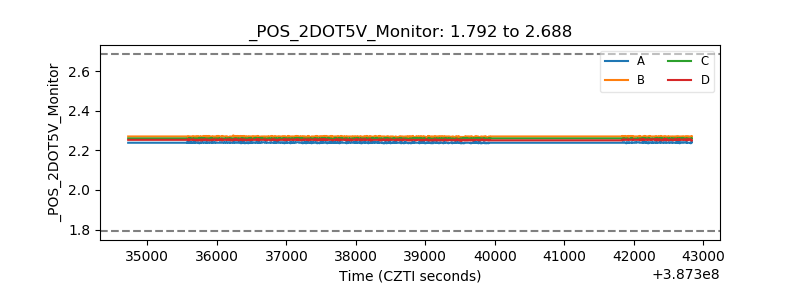 |
| +5 Volts monitor | 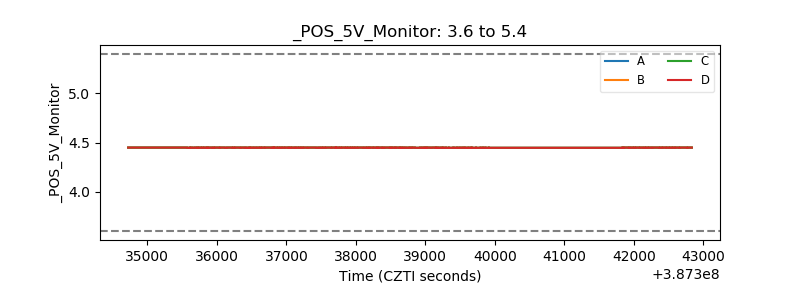 |
| _ROLL_ROT | 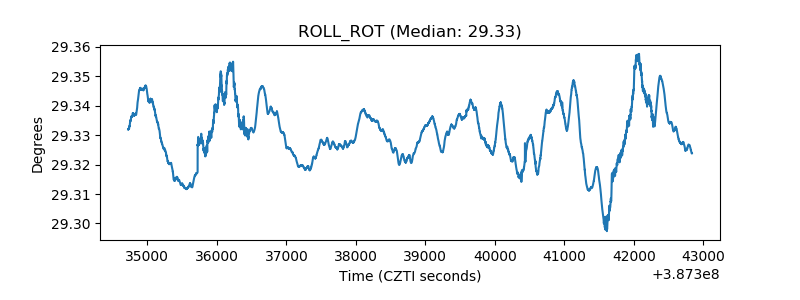 |
| _Roll_DEC | 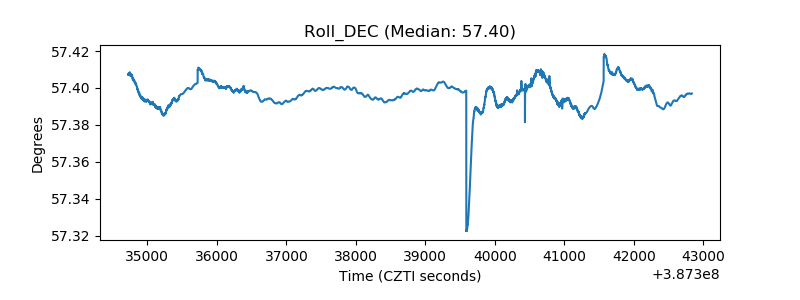 |
| _Roll_RA | 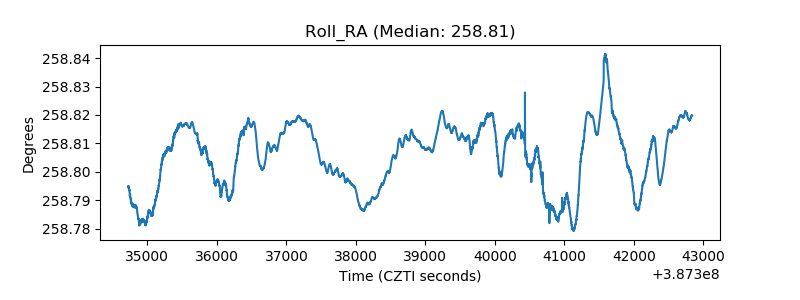 |
| Veto Counter | 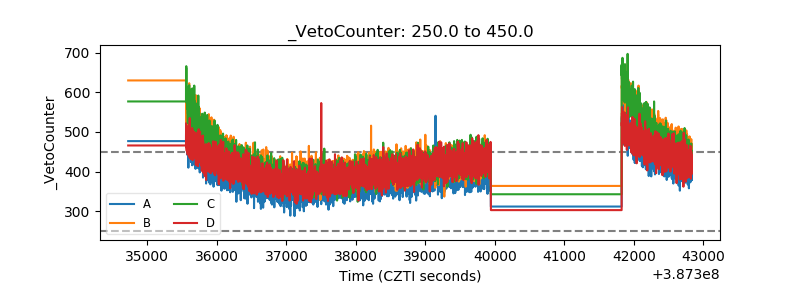 |