| Param | Original file | Final file |
|---|---|---|
| Filename | modeM0/AS1A11_093T01_9000005064_35329cztM0_level2.evt | modeM0/AS1A11_093T01_9000005064_35329cztM0_level2_quad_clean.evt |
| Size (bytes) | 521,133,120 | 85,008,960 |
| Size | 497.0 MB | 81.1 MB |
| Events in quadrant A | 2,804,314 | 544,423 |
| Events in quadrant B | 6,041,890 | 520,964 |
| Events in quadrant C | 3,185,767 | 567,056 |
| Events in quadrant D | 3,357,584 | 536,564 |
| Mode M0 | |||
|---|---|---|---|
| Quadrant | BADHDUFLAG | Total packets | Discarded packets |
| A | 0 | 12242 | 3 |
| B | 0 | 21965 | 2 |
| C | 0 | 12978 | 2 |
| D | 0 | 14051 | 2 |
| Mode SS | |||
|---|---|---|---|
| Quadrant | BADHDUFLAG | Total packets | Discarded packets |
| A | 0 | 120 | 0 |
| B | 0 | 120 | 0 |
| C | 0 | 120 | 0 |
| D | 0 | 120 | 0 |
| Mode M9 | |||
|---|---|---|---|
| Quadrant | BADHDUFLAG | Total packets | Discarded packets |
| A | 0 | 30 | 0 |
| B | 0 | 30 | 0 |
| C | 0 | 30 | 0 |
| D | 0 | 30 | 0 |
| Quadrant | Total seconds | Saturated seconds | Saturation percentage |
|---|---|---|---|
| A | 5787 | 37 | 0.639364% |
| B | 5787 | 1088 | 18.800760% |
| C | 5787 | 98 | 1.693451% |
| D | 5787 | 70 | 1.209608% |
Noise dominated data is calculated using 1-second bins in cleaned event files. If a bin has >2000 counts, and if more than 50% of those come from <1% of pixels, then it is considered to be noise-dominated and hence unusable.
| Quadrant | # 1 sec bins | Bins with >0 counts | Bins with >2000 counts | High rate bins dominated by noise | Noise dominated (total time) | Noise dominated (detector-on time) | Marked lightcurve |
|---|---|---|---|---|---|---|---|
| A | 8893 | 5789 | 28 | 28 | 0.31% | 0.48% | 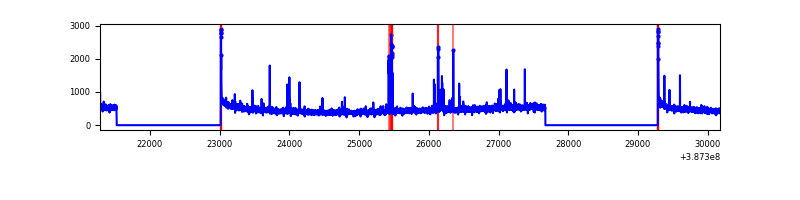 |
| B | 8893 | 5788 | 755 | 755 | 8.49% | 13.04% | 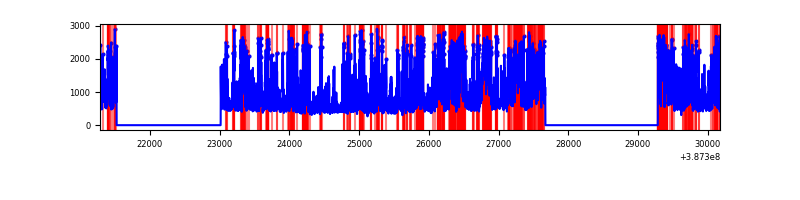 |
| C | 8893 | 5789 | 78 | 78 | 0.88% | 1.35% | 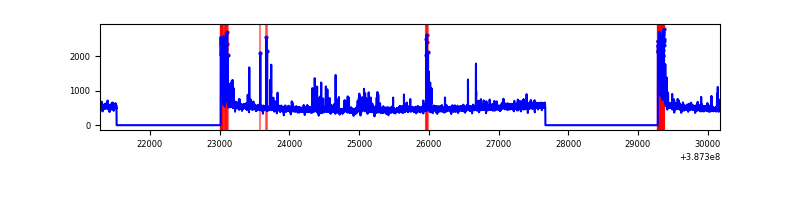 |
| D | 8893 | 5789 | 58 | 58 | 0.65% | 1.00% | 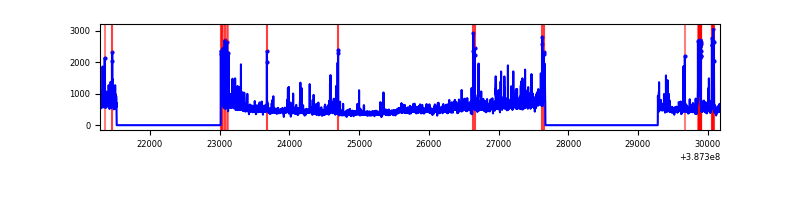 |
Top three noisy pixels from each quadrant. If the there are fewer than three noisy pixels in the level2.evt file, extra rows are filled as -1
| Pixel properties | Quadrant properties | ||||||
|---|---|---|---|---|---|---|---|
| Quadrant | DetID | PixID | Counts | Sigma | Mean | Median | Sigma |
| A | 10 | 83 | 98091 | 728.38 | 653 | 640 | 133.8 |
| A | 9 | 143 | 95790 | 711.18 | 653 | 640 | 133.8 |
| A | 8 | 192 | 33891 | 248.53 | 653 | 640 | 133.8 |
| B | 5 | 236 | 2459920 | 21097.74 | 607 | 590 | 116.6 |
| B | 5 | 172 | 1067044 | 9148.74 | 607 | 590 | 116.6 |
| B | 5 | 200 | 35432 | 298.9 | 607 | 590 | 116.6 |
| C | 0 | 10 | 411310 | 2776.67 | 640 | 644 | 147.9 |
| C | 15 | 214 | 238817 | 1610.38 | 640 | 644 | 147.9 |
| C | 15 | 159 | 20289 | 132.83 | 640 | 644 | 147.9 |
| D | 8 | 195 | 345467 | 2247.89 | 635 | 618 | 153.4 |
| D | 2 | 153 | 103335 | 669.56 | 635 | 618 | 153.4 |
| D | 1 | 47 | 99021 | 641.44 | 635 | 618 | 153.4 |
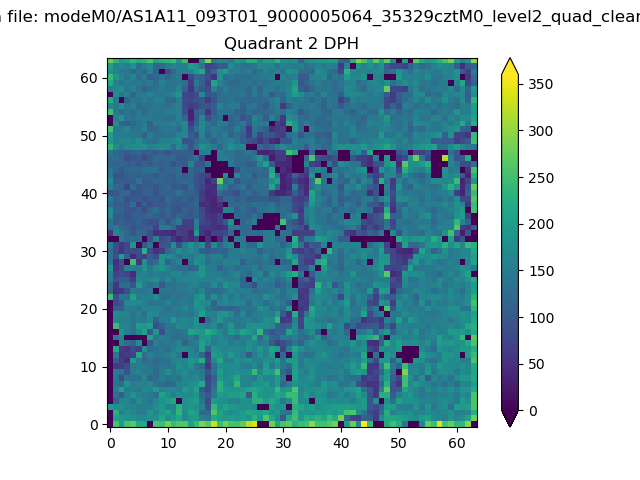
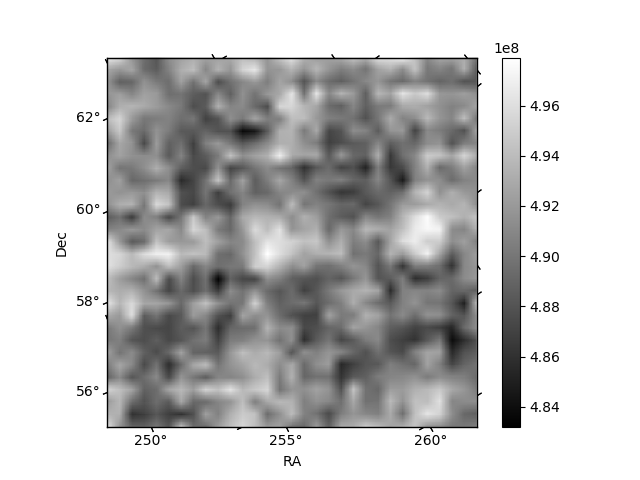
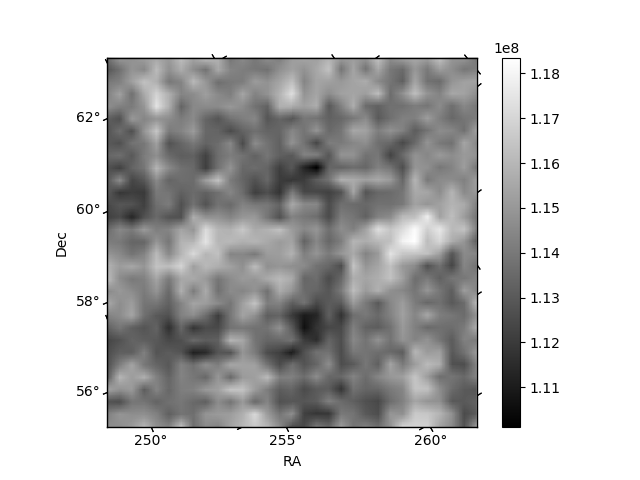
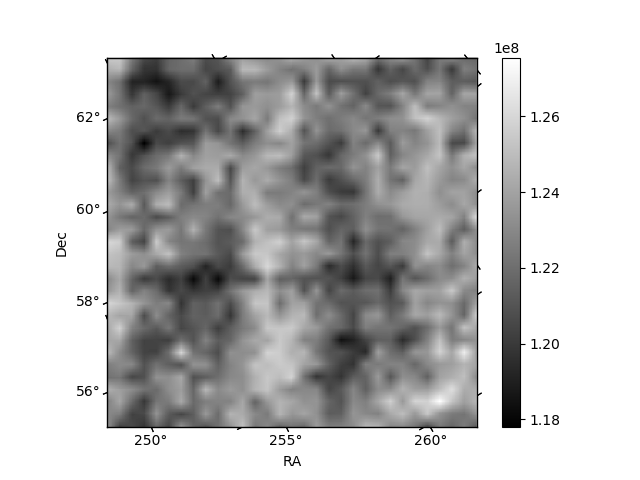
Histogram calculated using DETX and DETY for each event in the final _common_clean file
| Quadrant A | 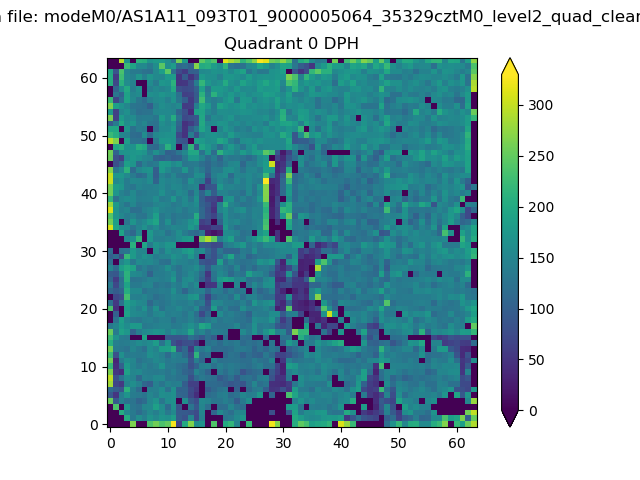 |
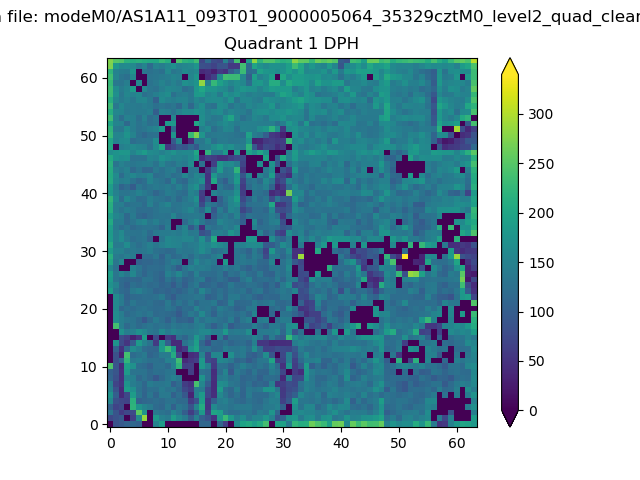 |
Quadrant B |
|---|---|---|---|
| Quadrant D | 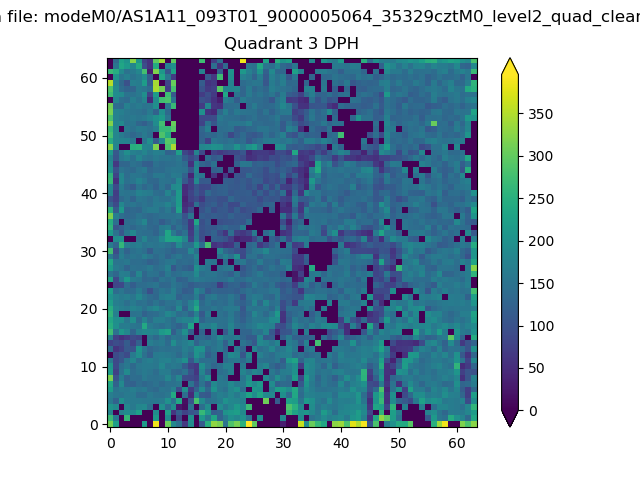 |
 |
Quadrant C |
| Plot type | Count rate plots | Images |
|---|---|---|
| Comparison with Poisson distribution Blue bars denote a histogram of data divided into 1 sec bins. Red curve is a Poisson curve with rate = median count rate of data. |
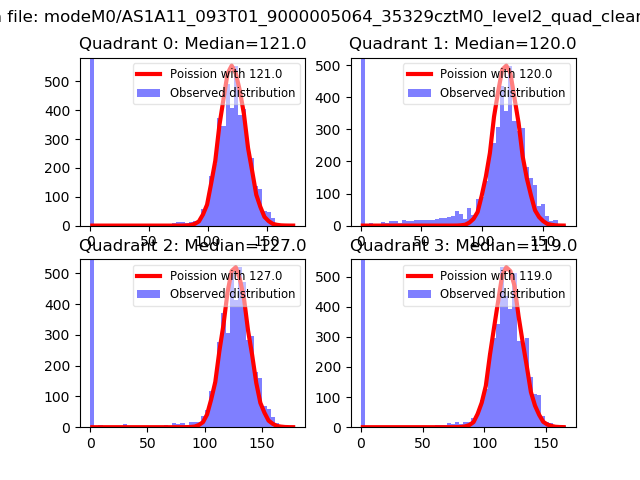 |
 |
| Quadrant-wise count rates Data is divided into 100 sec bins |
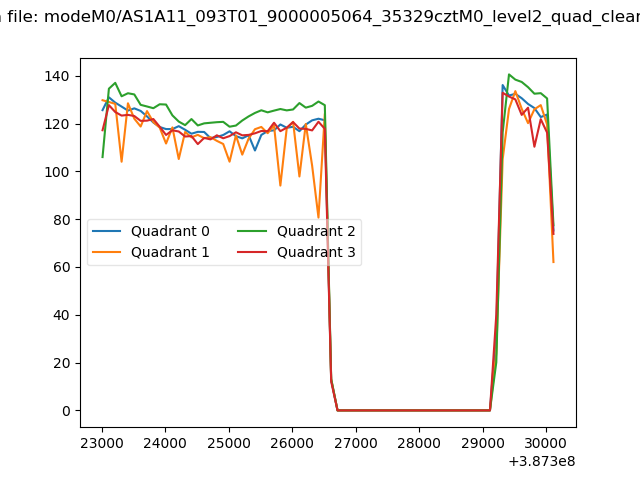 |
|
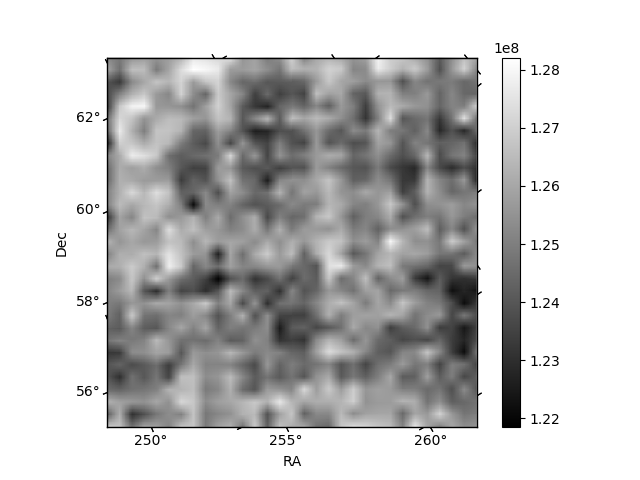
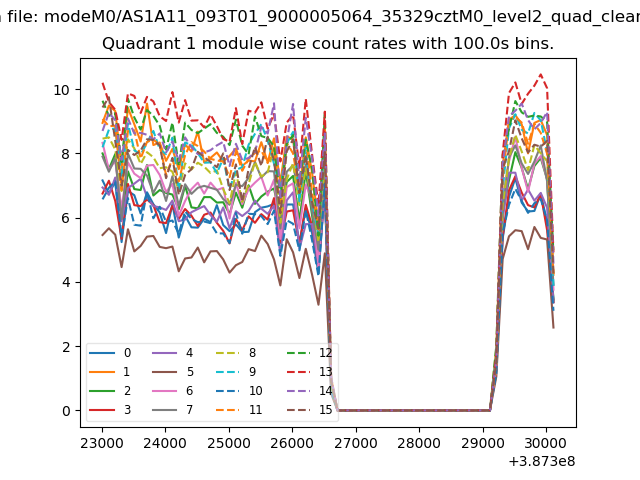
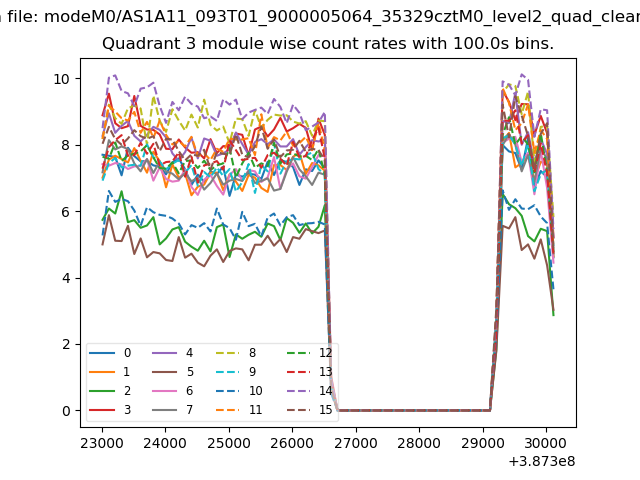
| Module-wise count rates for Quadrant A Data is divided into 100 sec bins |
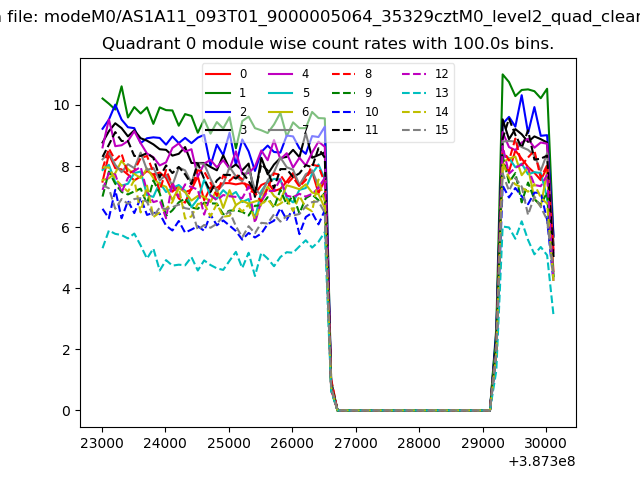 |
 |
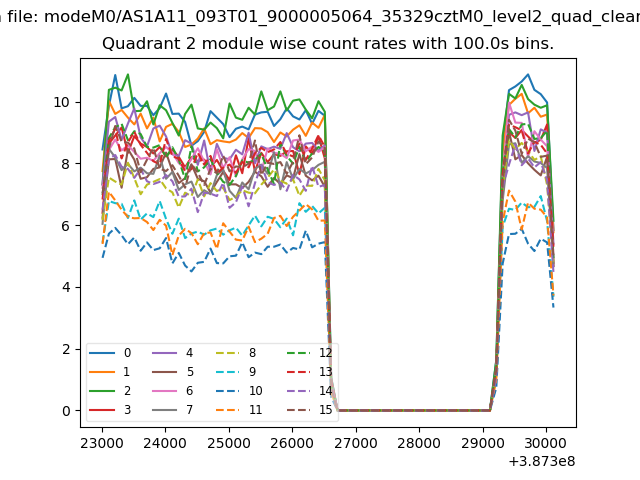
| Module-wise count rates for Quadrant B Data is divided into 100 sec bins |
 |
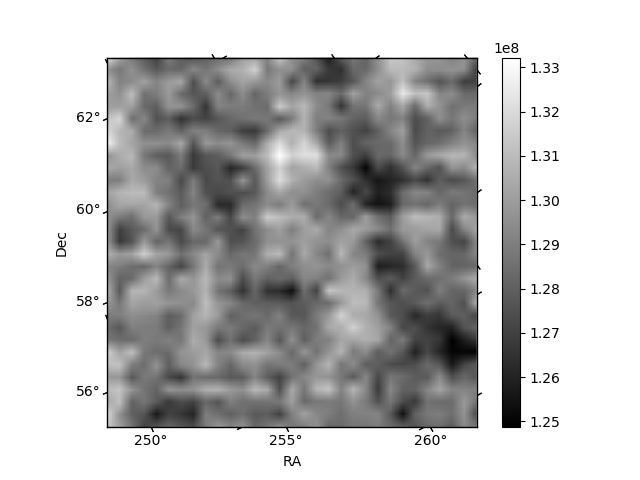 |
| Module-wise count rates for Quadrant C Data is divided into 100 sec bins |
 |
 |
| Module-wise count rates for Quadrant D Data is divided into 100 sec bins |
 |
 |
| Parameter | Plot |
|---|---|
| CZT HV Monitor | 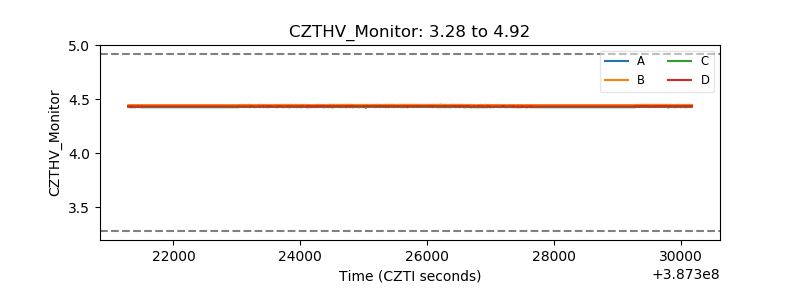 |
| D_VDD | 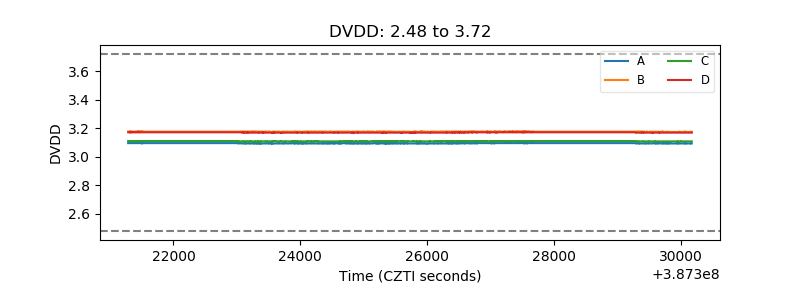 |
| Temperature 1 | 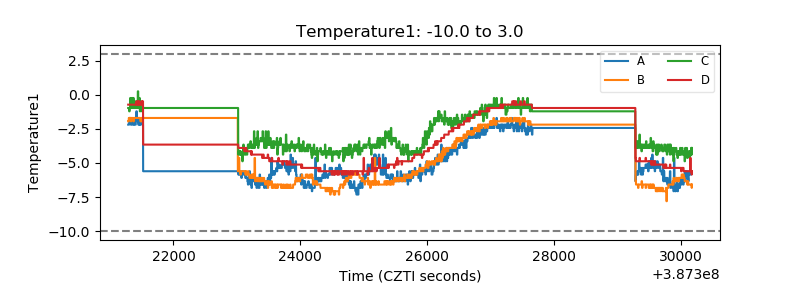 |
| Veto HV Monitor | 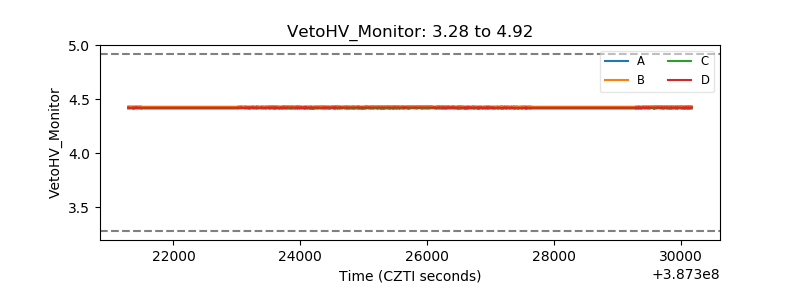 |
| Veto LLD | 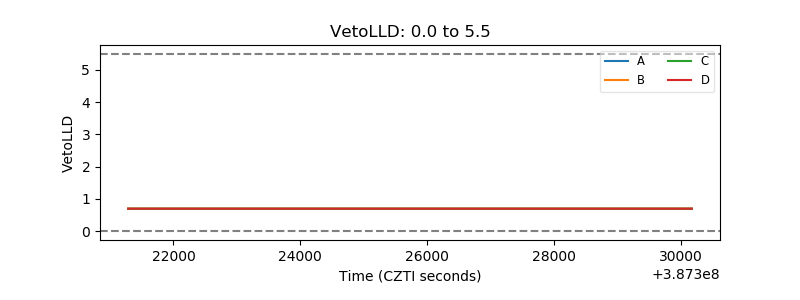 |
| Alpha Counter | 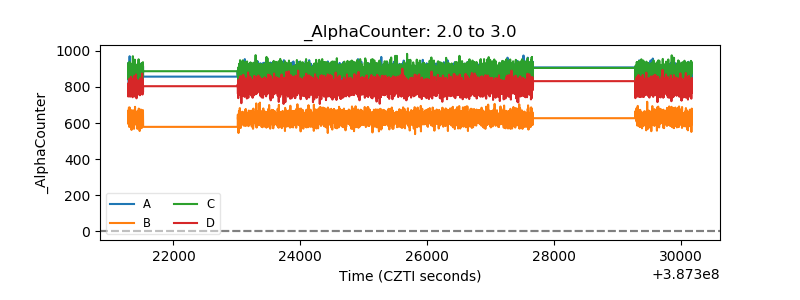 |
| _CPM_Rate | 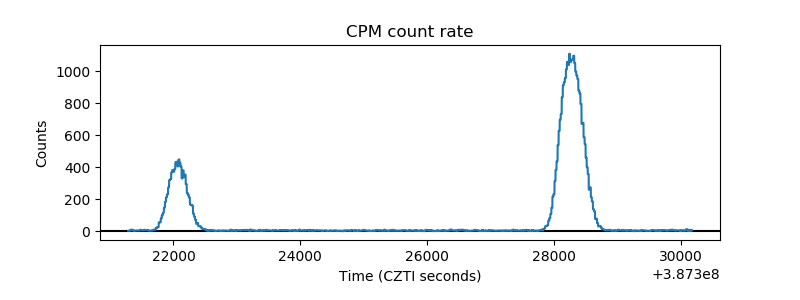 |
| CZT Counter | 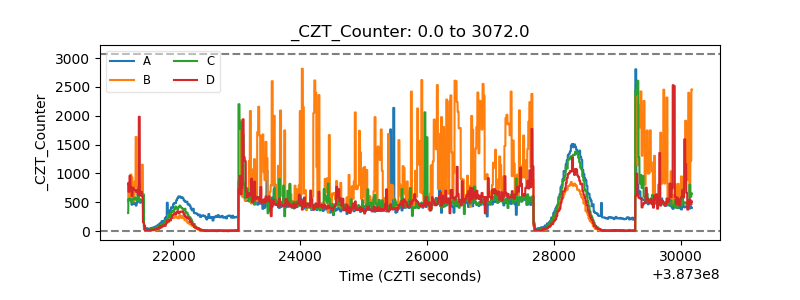 |
| +2.5 Volts monitor | 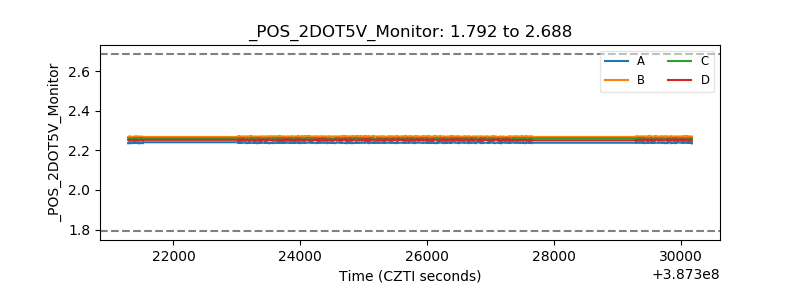 |
| +5 Volts monitor | 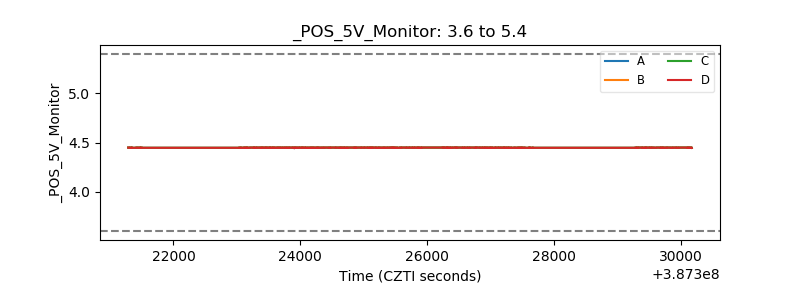 |
| _ROLL_ROT | 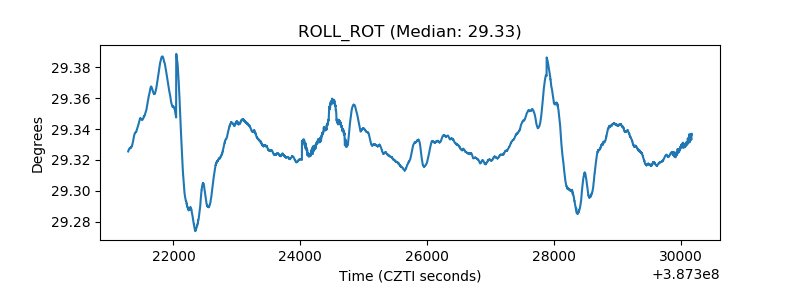 |
| _Roll_DEC | 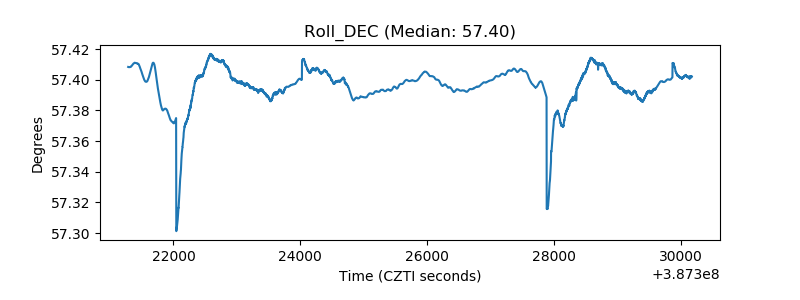 |
| _Roll_RA | 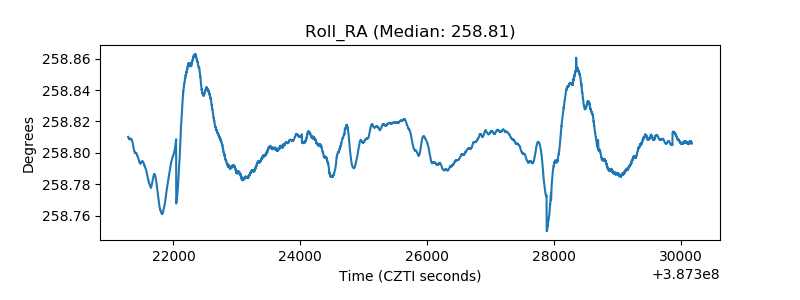 |
| Veto Counter | 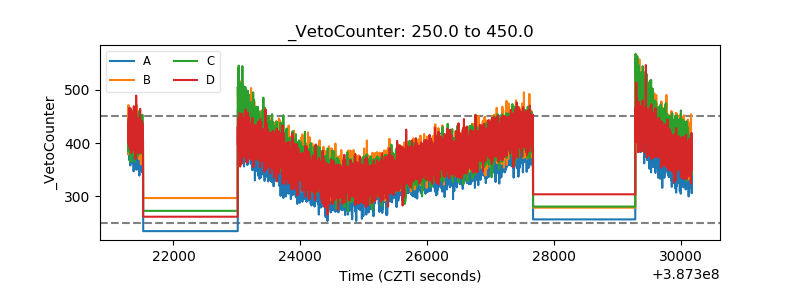 |