| Param | Original file | Final file |
|---|---|---|
| Filename | modeM0/AS1A11_093T01_9000005064cztM0_level2_bc.evt | modeM0/AS1A11_093T01_9000005064cztM0_level2_quad_clean.evt |
| Size (bytes) | 5,900,031,360 | 1,592,942,400 |
| Size | 5.5 GB | 1.5 GB |
| Events in quadrant A | 28,594,368 | 10,305,744 |
| Events in quadrant B | 62,451,051 | 9,696,365 |
| Events in quadrant C | 33,557,339 | 10,599,145 |
| Events in quadrant D | 46,355,453 | 9,857,101 |
| Mode M0 | |||
|---|---|---|---|
| Quadrant | BADHDUFLAG | Total packets | Discarded packets |
| A | 0 | 244228 | 0 |
| B | 0 | 410896 | 0 |
| C | 0 | 253811 | 0 |
| D | 0 | 309126 | 0 |
| Mode SS | |||
|---|---|---|---|
| Quadrant | BADHDUFLAG | Total packets | Discarded packets |
| A | 0 | 2318 | 0 |
| B | 0 | 2318 | 0 |
| C | 0 | 2318 | 0 |
| D | 0 | 2318 | 0 |
| Mode M9 | |||
|---|---|---|---|
| Quadrant | BADHDUFLAG | Total packets | Discarded packets |
| A | 0 | 437 | 0 |
| B | 0 | 437 | 0 |
| C | 0 | 437 | 0 |
| D | 0 | 437 | 0 |
| Quadrant | Total seconds | Saturated seconds | Saturation percentage |
|---|---|---|---|
| A | 113629 | 1042 | 0.917019% |
| B | 113629 | 21473 | 18.897465% |
| C | 113629 | 1443 | 1.269922% |
| D | 113627 | 4394 | 3.867039% |
Noise dominated data is calculated using 1-second bins in cleaned event files. If a bin has >2000 counts, and if more than 50% of those come from <1% of pixels, then it is considered to be noise-dominated and hence unusable.
| Quadrant | # 1 sec bins | Bins with >0 counts | Bins with >2000 counts | High rate bins dominated by noise | Noise dominated (total time) | Noise dominated (detector-on time) | Marked lightcurve |
|---|---|---|---|---|---|---|---|
| A | 157307 | 113651 | 275 | 275 | 0.17% | 0.24% | 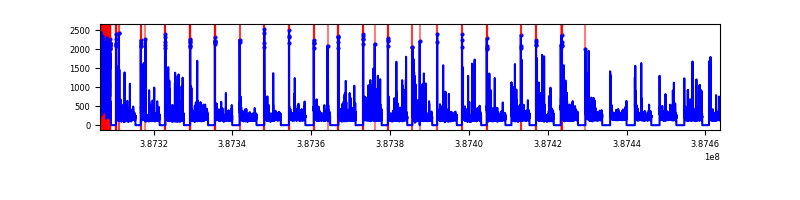 |
| B | 157307 | 113601 | 491 | 491 | 0.31% | 0.43% | 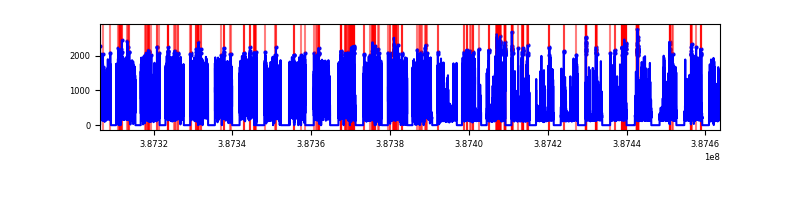 |
| C | 157307 | 113625 | 117 | 117 | 0.07% | 0.10% |  |
| D | 157307 | 113623 | 436 | 436 | 0.28% | 0.38% | 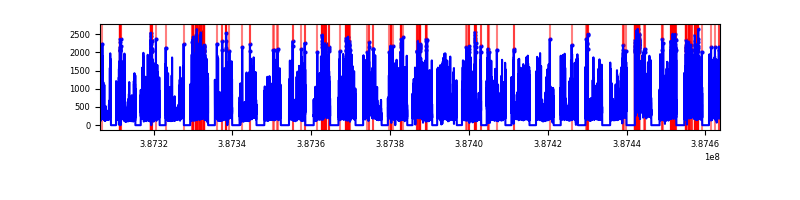 |
Top three noisy pixels from each quadrant. If the there are fewer than three noisy pixels in the level2.evt file, extra rows are filled as -1
| Pixel properties | Quadrant properties | ||||||
|---|---|---|---|---|---|---|---|
| Quadrant | DetID | PixID | Counts | Sigma | Mean | Median | Sigma |
| A | 15 | 169 | 3098352 | 2430.41 | 5784 | 5704 | 1272.5 |
| A | 10 | 83 | 1607255 | 1258.61 | 5784 | 5704 | 1272.5 |
| A | 9 | 143 | 400298 | 310.1 | 5784 | 5704 | 1272.5 |
| B | 5 | 236 | 25578703 | 23978.85 | 5367 | 5254 | 1066.5 |
| B | 5 | 172 | 14655077 | 13736.35 | 5367 | 5254 | 1066.5 |
| B | 4 | 232 | 579122 | 538.09 | 5367 | 5254 | 1066.5 |
| C | 15 | 214 | 4414400 | 3320.82 | 5732 | 5697 | 1327.6 |
| C | 0 | 10 | 4164610 | 3132.67 | 5732 | 5697 | 1327.6 |
| C | 1 | 23 | 889793 | 665.94 | 5732 | 5697 | 1327.6 |
| D | 8 | 195 | 6995209 | 5233.32 | 5646 | 5466 | 1335.6 |
| D | 7 | 80 | 3851890 | 2879.87 | 5646 | 5466 | 1335.6 |
| D | 10 | 118 | 1789260 | 1335.55 | 5646 | 5466 | 1335.6 |
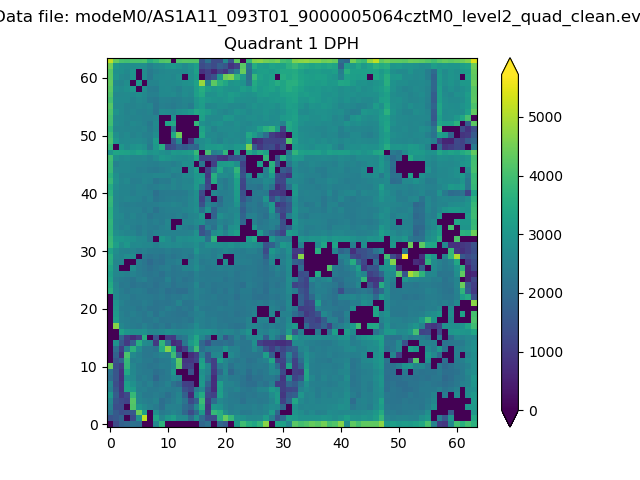
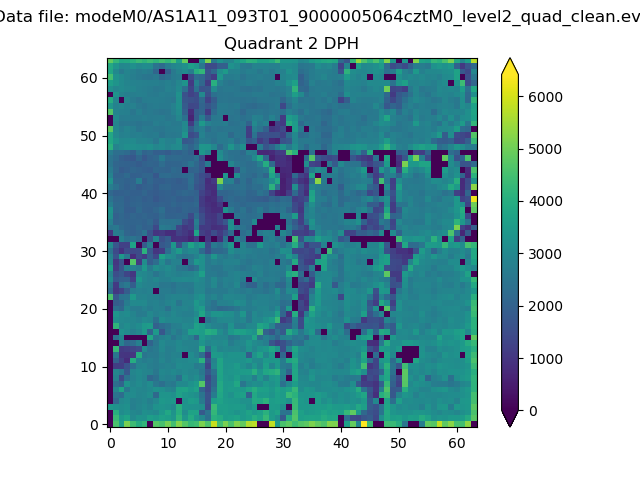
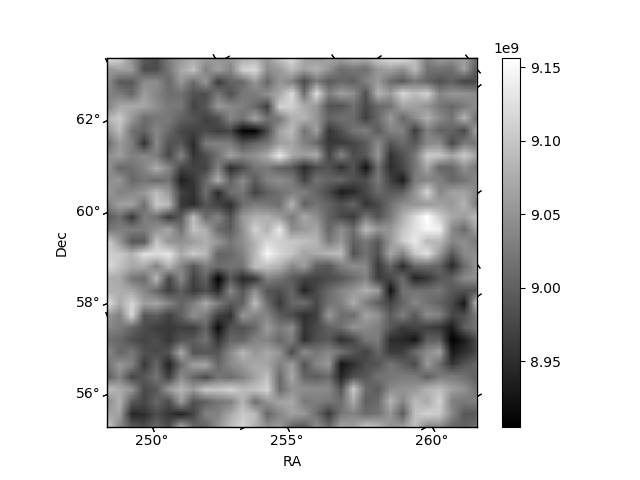
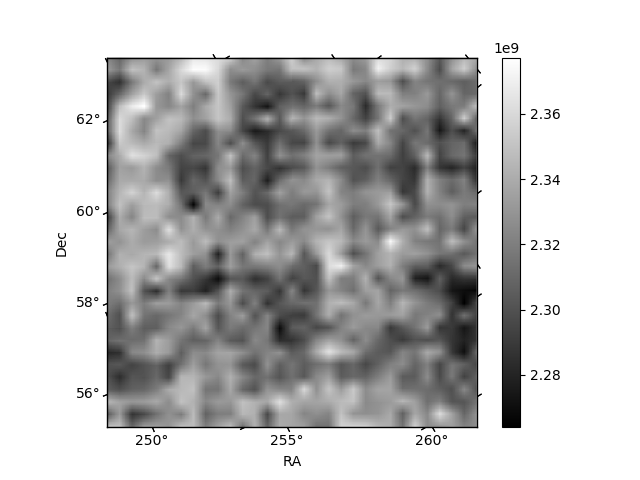
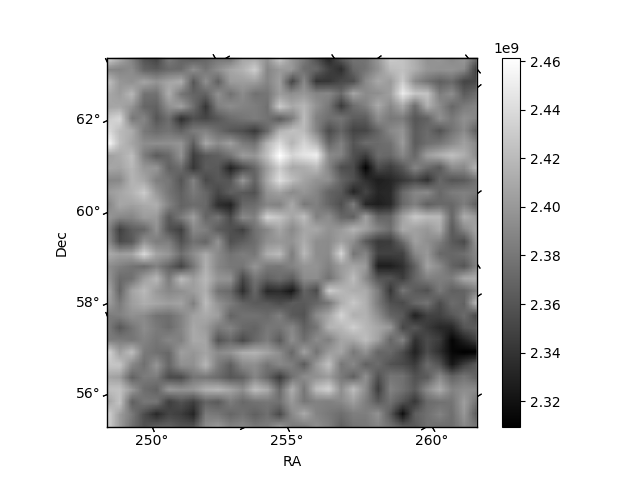
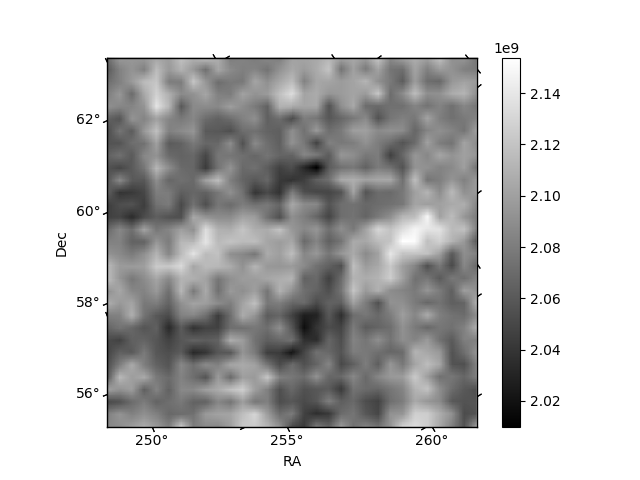
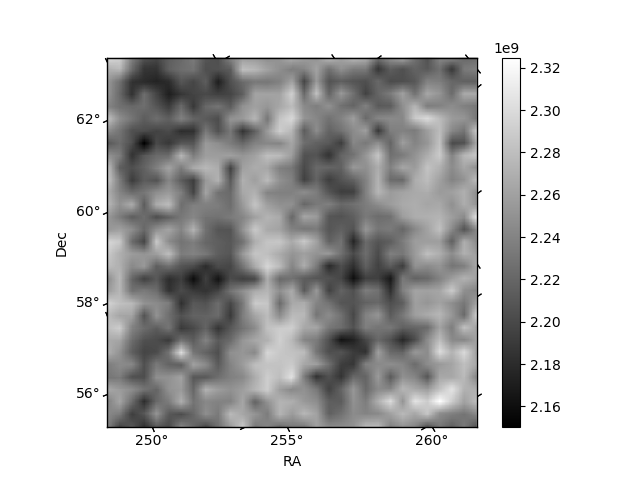
Histogram calculated using DETX and DETY for each event in the final _common_clean file
| Quadrant A | 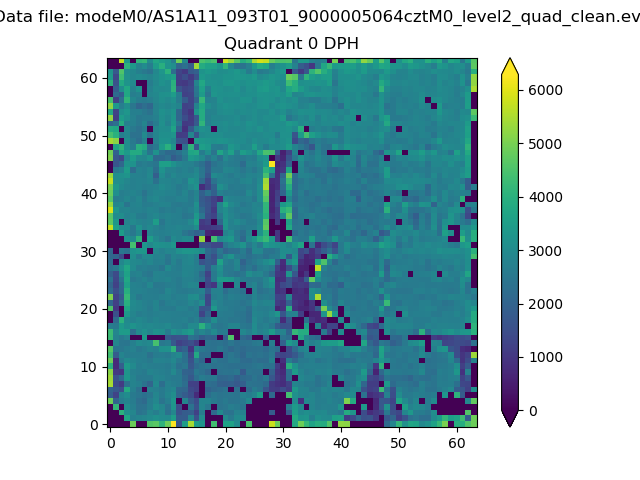 |
 |
Quadrant B |
|---|---|---|---|
| Quadrant D | 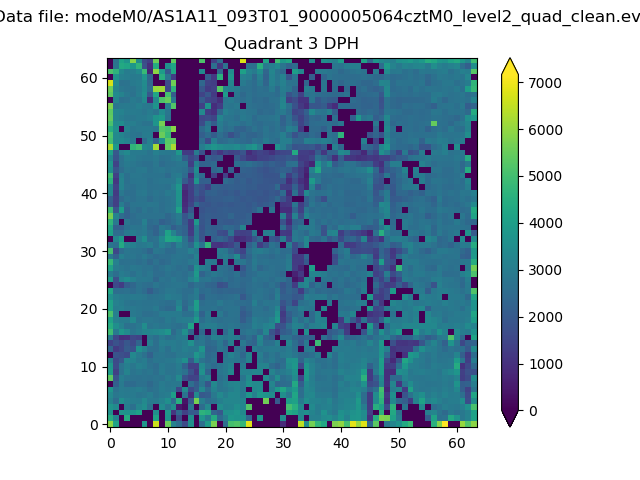 |
 |
Quadrant C |
| Plot type | Count rate plots | Images |
|---|---|---|
| Comparison with Poisson distribution Blue bars denote a histogram of data divided into 1 sec bins. Red curve is a Poisson curve with rate = median count rate of data. |
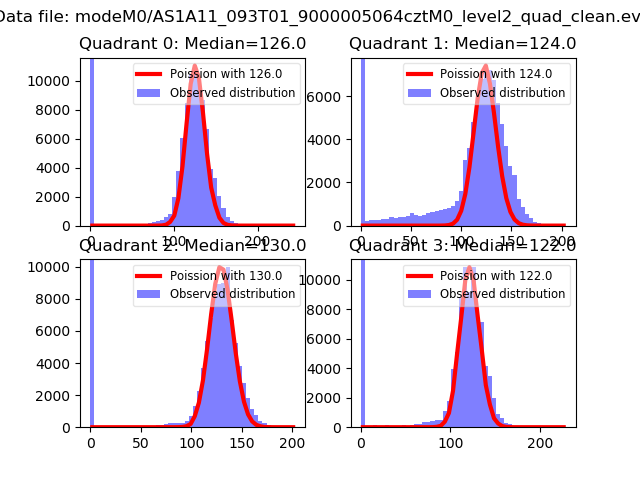 |
 |
| Quadrant-wise count rates Data is divided into 100 sec bins |
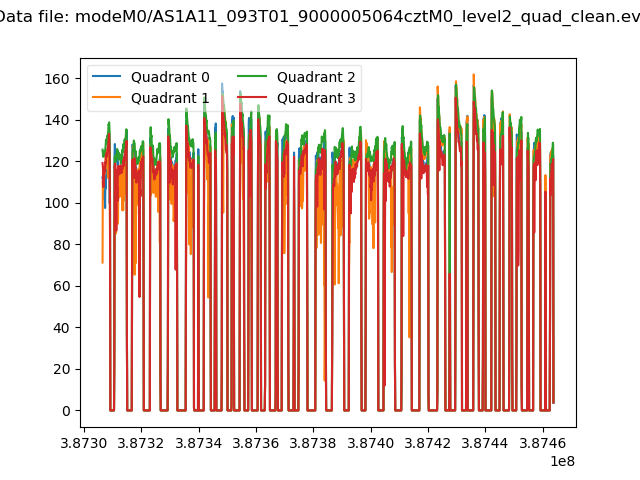 |
|
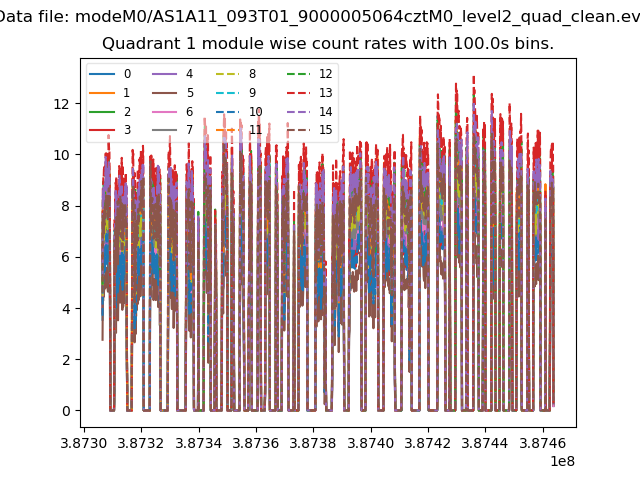
| Module-wise count rates for Quadrant A Data is divided into 100 sec bins |
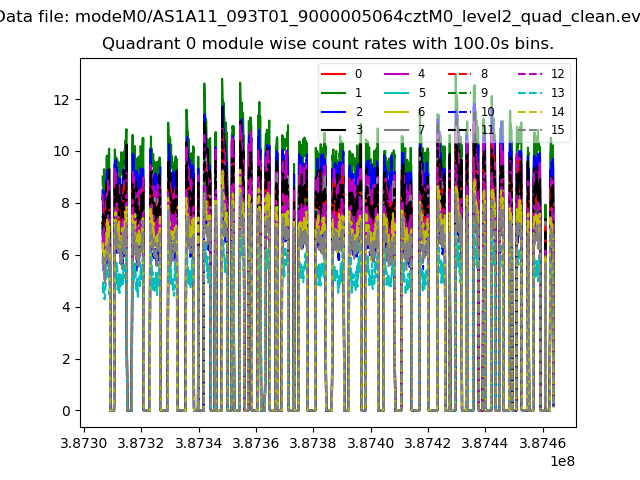 |
 |
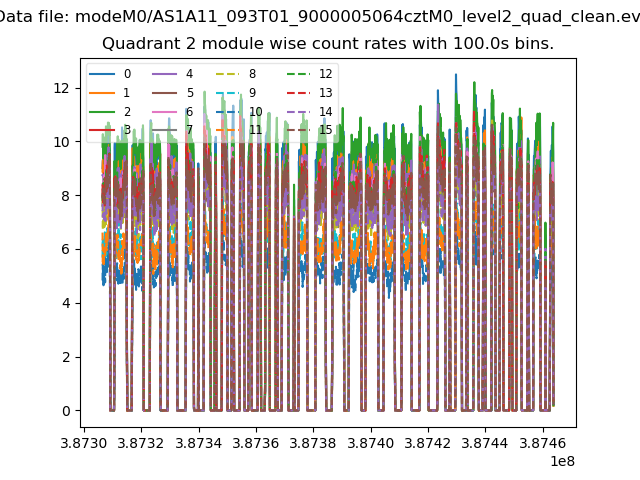
| Module-wise count rates for Quadrant B Data is divided into 100 sec bins |
 |
 |
| Module-wise count rates for Quadrant C Data is divided into 100 sec bins |
 |
 |
| Module-wise count rates for Quadrant D Data is divided into 100 sec bins |
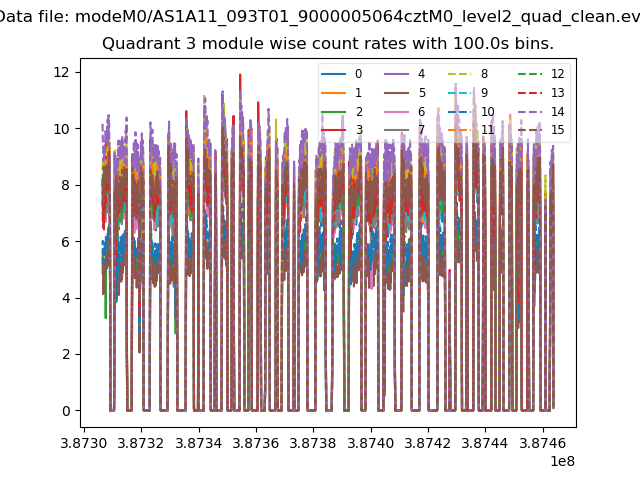 |
 |
| Parameter | Plot |
|---|---|
| CZT HV Monitor | 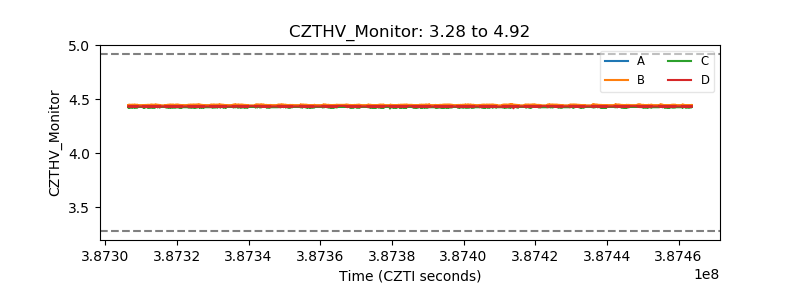 |
| D_VDD | 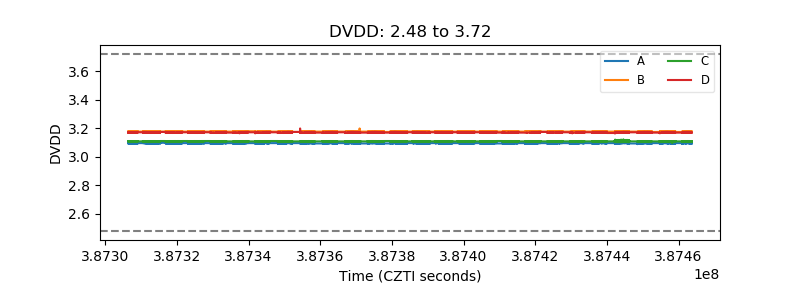 |
| Temperature 1 |  |
| Veto HV Monitor | 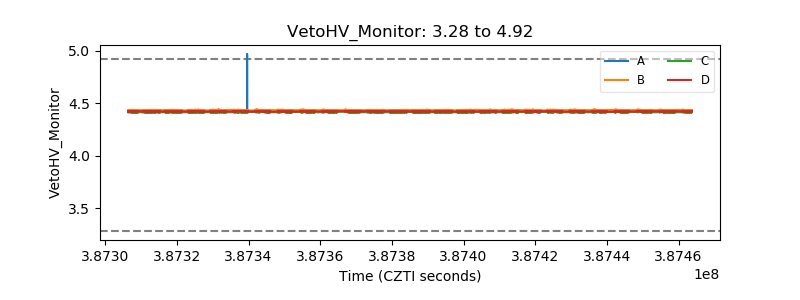 |
| Veto LLD | 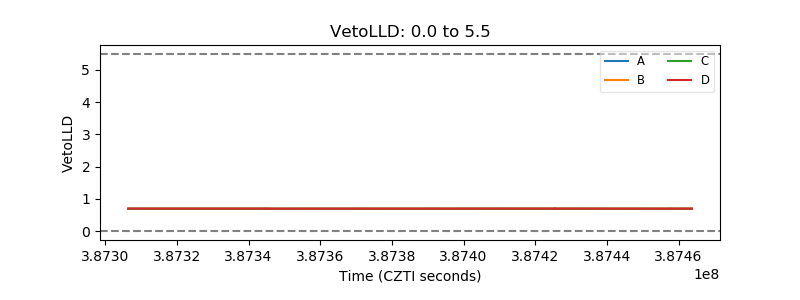 |
| Alpha Counter | 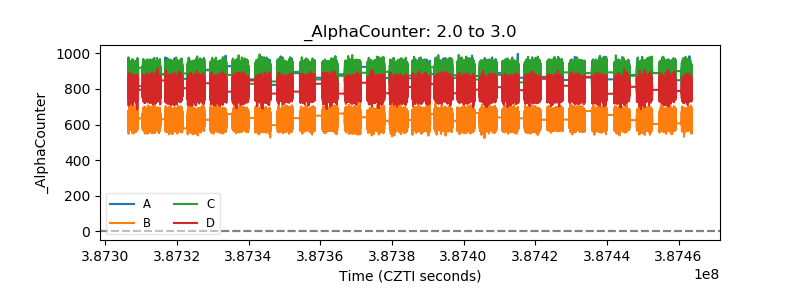 |
| _CPM_Rate |  |
| CZT Counter | 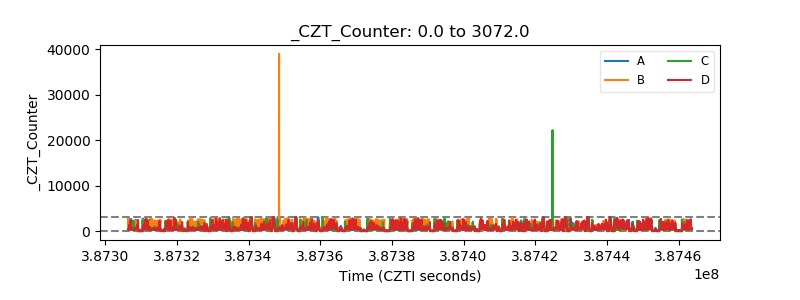 |
| +2.5 Volts monitor | 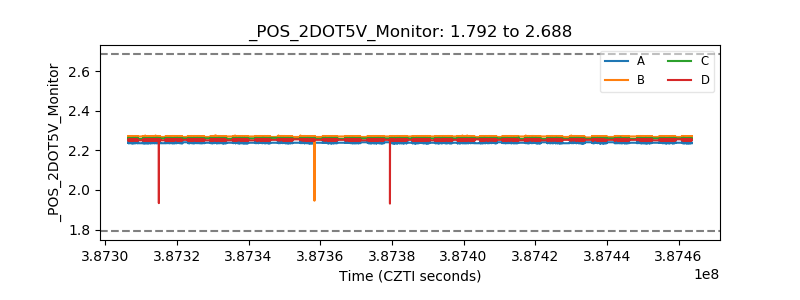 |
| +5 Volts monitor | 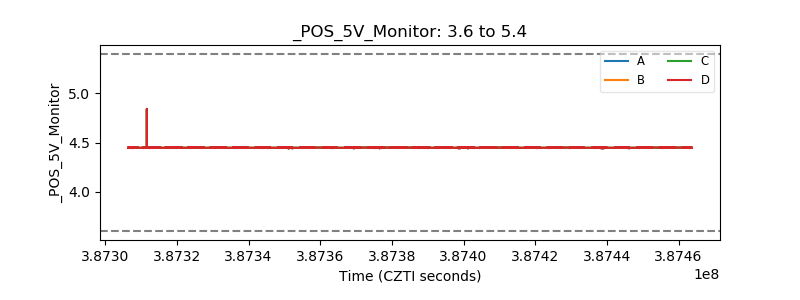 |
| _ROLL_ROT | 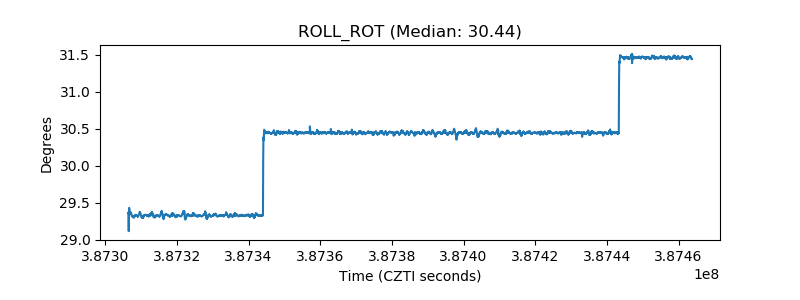 |
| _Roll_DEC | 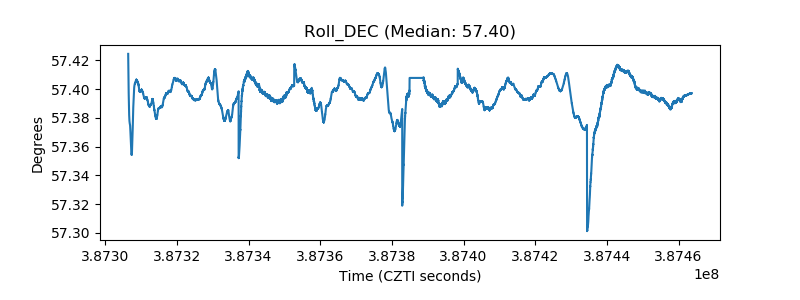 |
| _Roll_RA | 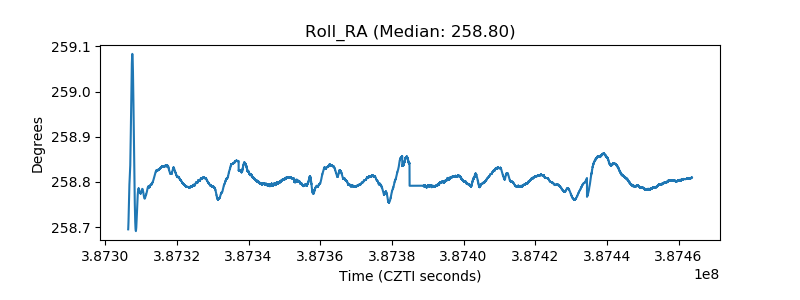 |
| Veto Counter | 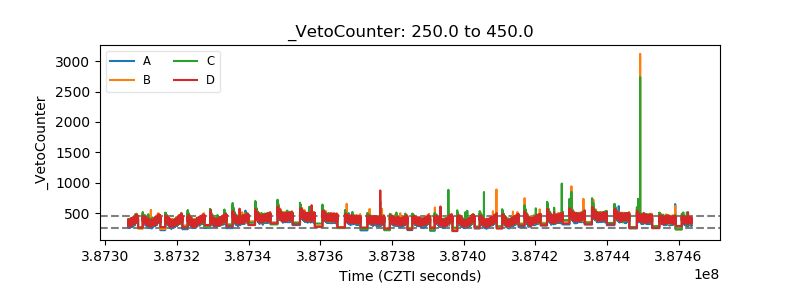 |