| Param | Original file | Final file |
|---|---|---|
| Filename | modeM0/AS1A11_046T08_9000005062_35324cztM0_level2.evt | modeM0/AS1A11_046T08_9000005062_35324cztM0_level2_quad_clean.evt |
| Size (bytes) | 1,017,313,920 | 86,961,600 |
| Size | 970.2 MB | 82.9 MB |
| Events in quadrant A | 14,273,359 | 294,910 |
| Events in quadrant B | 8,939,273 | 554,712 |
| Events in quadrant C | 3,322,077 | 705,771 |
| Events in quadrant D | 3,889,662 | 673,683 |
| Mode SS | |||
|---|---|---|---|
| Quadrant | BADHDUFLAG | Total packets | Discarded packets |
| A | 0 | 116 | 0 |
| B | 0 | 116 | 0 |
| C | 0 | 116 | 0 |
| D | 0 | 116 | 0 |
| Mode M0 | |||
|---|---|---|---|
| Quadrant | BADHDUFLAG | Total packets | Discarded packets |
| A | 0 | 46300 | 2 |
| B | 0 | 30512 | 1 |
| C | 0 | 13311 | 1 |
| D | 0 | 15454 | 1 |
| Mode M9 | |||
|---|---|---|---|
| Quadrant | BADHDUFLAG | Total packets | Discarded packets |
| A | 0 | 15 | 0 |
| B | 0 | 15 | 0 |
| C | 0 | 15 | 0 |
| D | 0 | 15 | 0 |
| Quadrant | Total seconds | Saturated seconds | Saturation percentage |
|---|---|---|---|
| A | 5729 | 5444 | 95.025310% |
| B | 5729 | 2593 | 45.260953% |
| C | 5729 | 49 | 0.855298% |
| D | 5729 | 125 | 2.181882% |
Noise dominated data is calculated using 1-second bins in cleaned event files. If a bin has >2000 counts, and if more than 50% of those come from <1% of pixels, then it is considered to be noise-dominated and hence unusable.
| Quadrant | # 1 sec bins | Bins with >0 counts | Bins with >2000 counts | High rate bins dominated by noise | Noise dominated (total time) | Noise dominated (detector-on time) | Marked lightcurve |
|---|---|---|---|---|---|---|---|
| A | 7160 | 5728 | 5308 | 5308 | 74.13% | 92.67% | 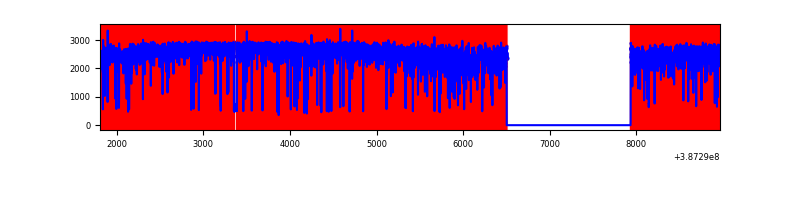 |
| B | 7161 | 5729 | 2154 | 2154 | 30.08% | 37.60% | 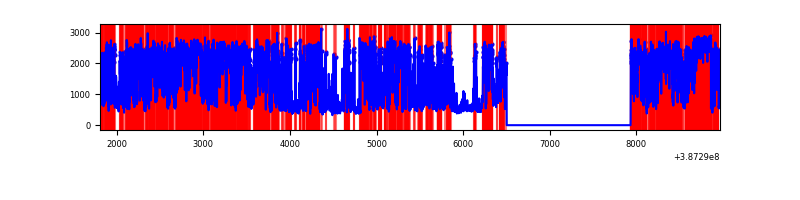 |
| C | 7161 | 5730 | 37 | 37 | 0.52% | 0.65% | 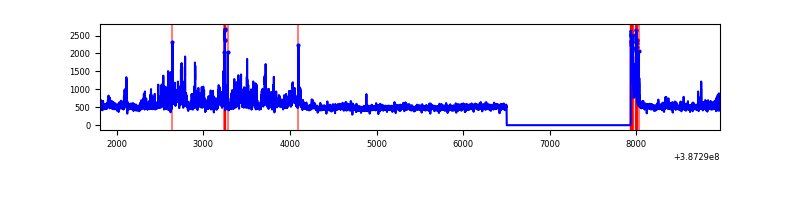 |
| D | 7161 | 5730 | 100 | 100 | 1.40% | 1.75% | 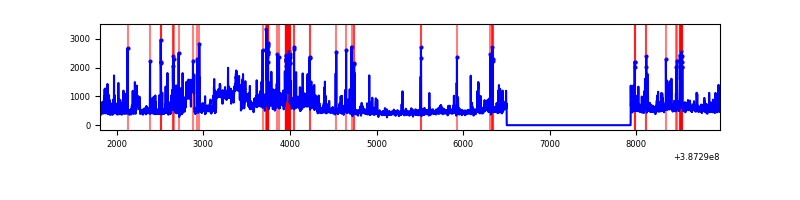 |
Top three noisy pixels from each quadrant. If the there are fewer than three noisy pixels in the level2.evt file, extra rows are filled as -1
| Pixel properties | Quadrant properties | ||||||
|---|---|---|---|---|---|---|---|
| Quadrant | DetID | PixID | Counts | Sigma | Mean | Median | Sigma |
| A | 15 | 169 | 12934539 | 194820.78 | 325 | 318 | 66.4 |
| A | 10 | 83 | 46768 | 699.65 | 325 | 318 | 66.4 |
| A | 8 | 192 | 11001 | 160.91 | 325 | 318 | 66.4 |
| B | 5 | 236 | 4032005 | 40484.61 | 522 | 508 | 99.6 |
| B | 5 | 172 | 2256957 | 22659.44 | 522 | 508 | 99.6 |
| B | 5 | 200 | 492737 | 4943.0 | 522 | 508 | 99.6 |
| C | 0 | 10 | 336377 | 2293.14 | 635 | 640 | 146.4 |
| C | 3 | 233 | 261893 | 1784.4 | 635 | 640 | 146.4 |
| C | 15 | 214 | 237279 | 1616.28 | 635 | 640 | 146.4 |
| D | 8 | 195 | 485494 | 3129.22 | 632 | 613 | 155.0 |
| D | 2 | 120 | 296979 | 1912.62 | 632 | 613 | 155.0 |
| D | 10 | 118 | 242414 | 1560.48 | 632 | 613 | 155.0 |
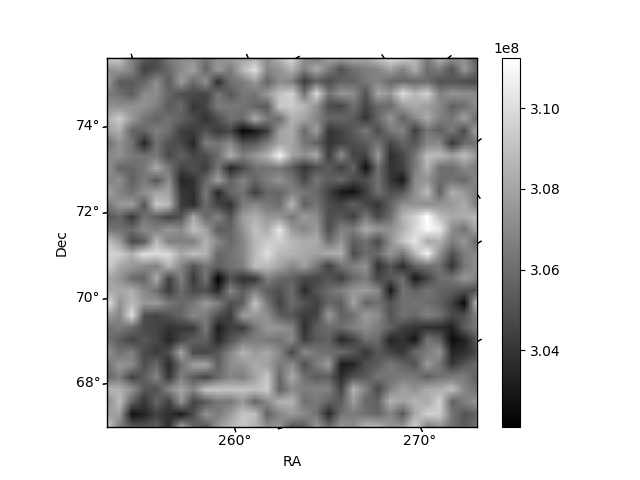
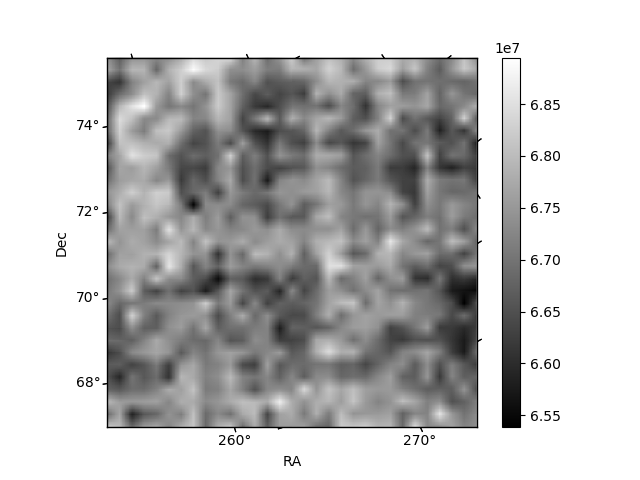
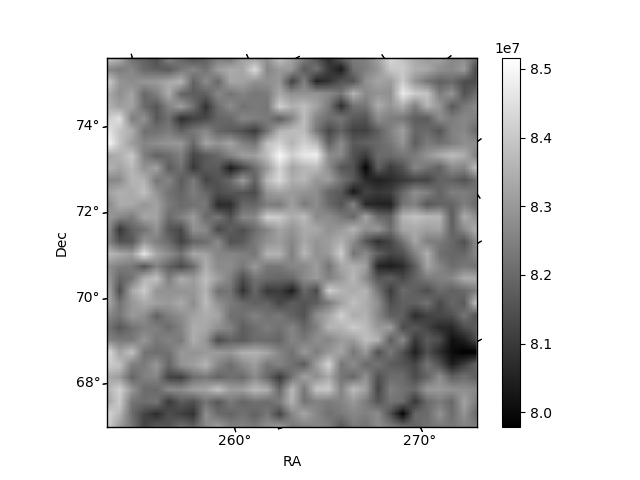
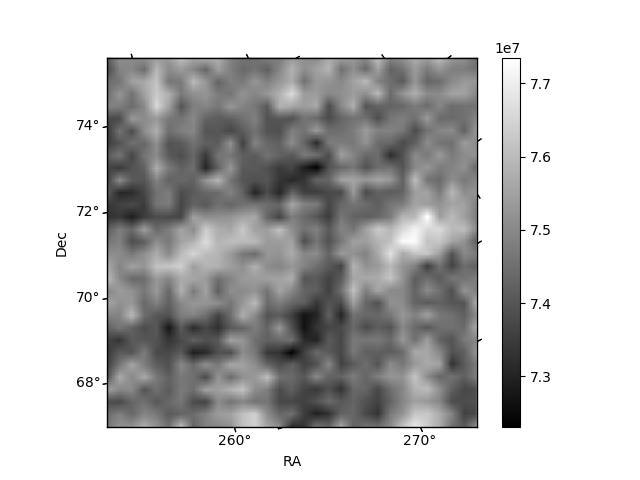
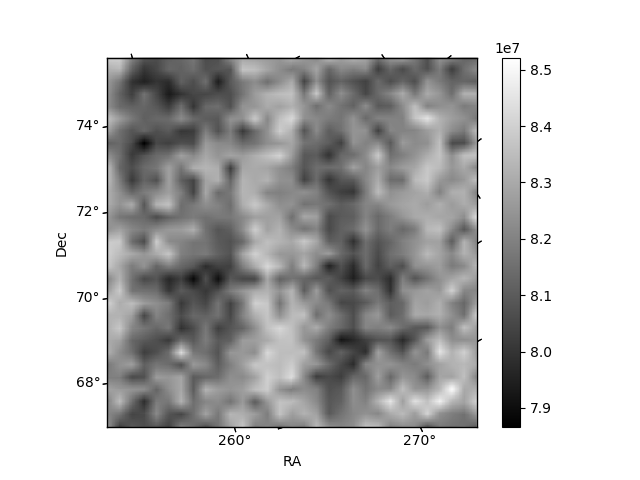
Histogram calculated using DETX and DETY for each event in the final _common_clean file
| Quadrant A | 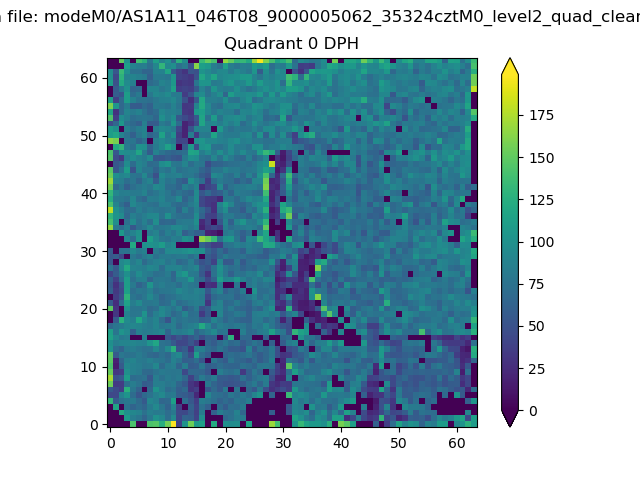 |
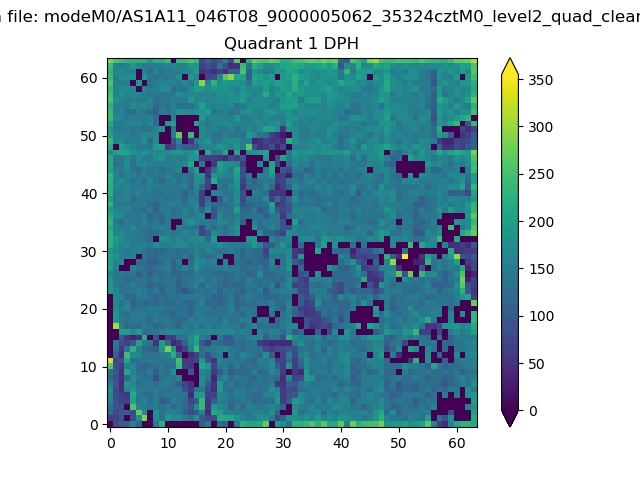 |
Quadrant B |
|---|---|---|---|
| Quadrant D |  |
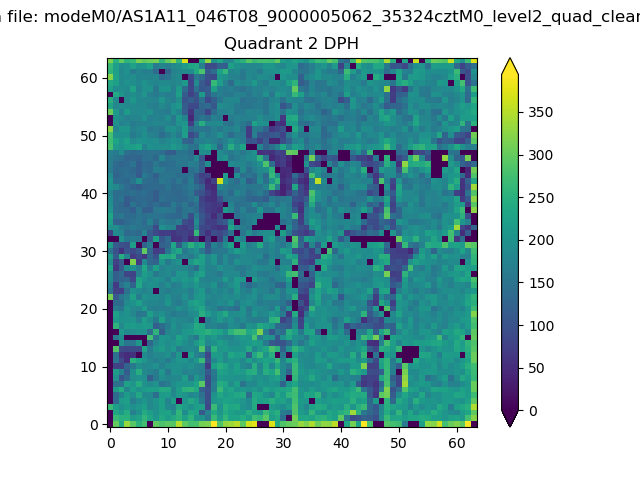 |
Quadrant C |
| Plot type | Count rate plots | Images |
|---|---|---|
| Comparison with Poisson distribution Blue bars denote a histogram of data divided into 1 sec bins. Red curve is a Poisson curve with rate = median count rate of data. |
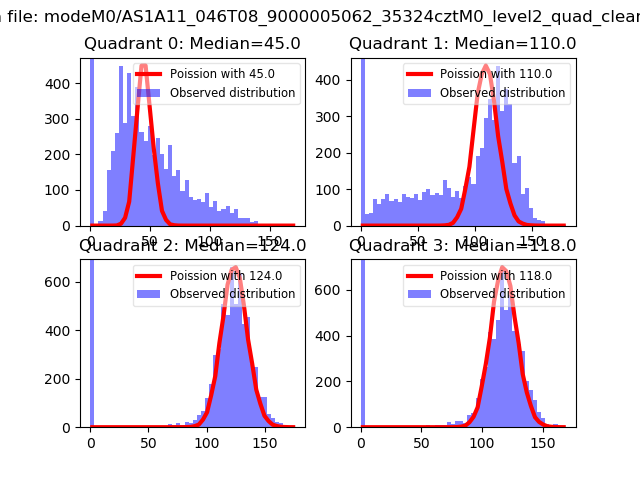 |
 |
| Quadrant-wise count rates Data is divided into 100 sec bins |
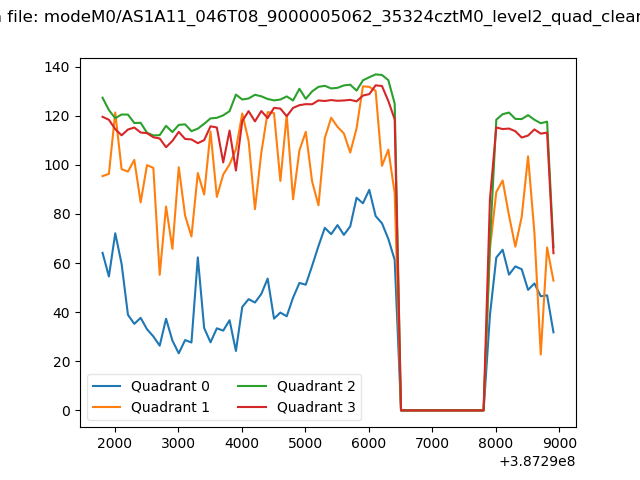 |
|
| Module-wise count rates for Quadrant A Data is divided into 100 sec bins |
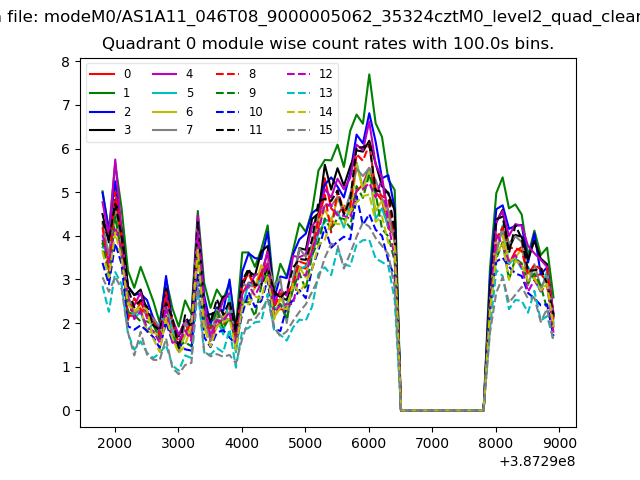 |
 |
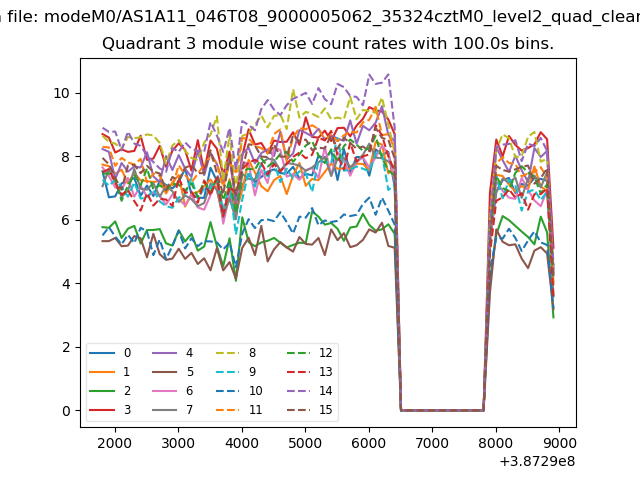
| Module-wise count rates for Quadrant B Data is divided into 100 sec bins |
 |
 |
| Module-wise count rates for Quadrant C Data is divided into 100 sec bins |
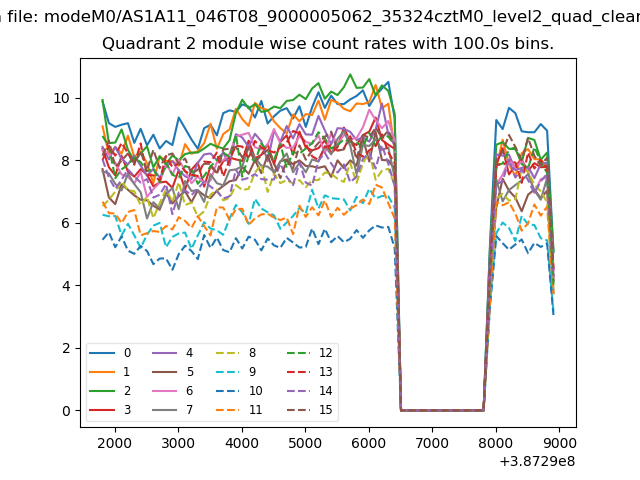 |
 |
| Module-wise count rates for Quadrant D Data is divided into 100 sec bins |
 |
 |
| Parameter | Plot |
|---|---|
| CZT HV Monitor | 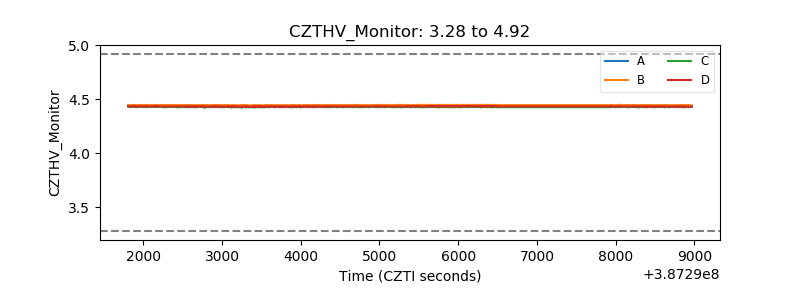 |
| D_VDD | 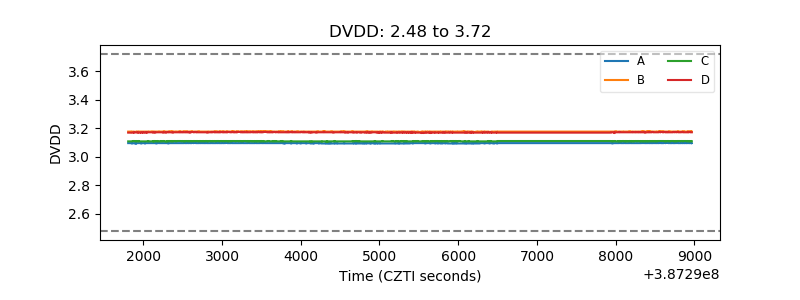 |
| Temperature 1 | 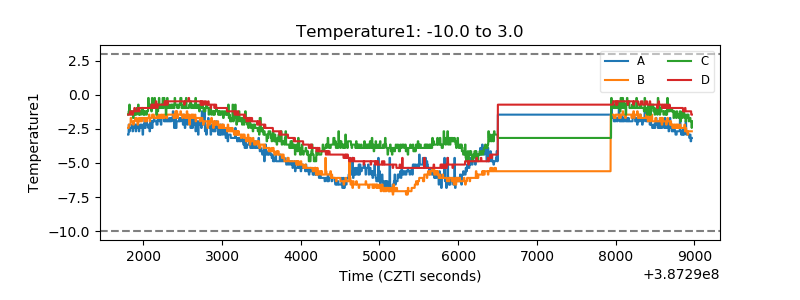 |
| Veto HV Monitor |  |
| Veto LLD | 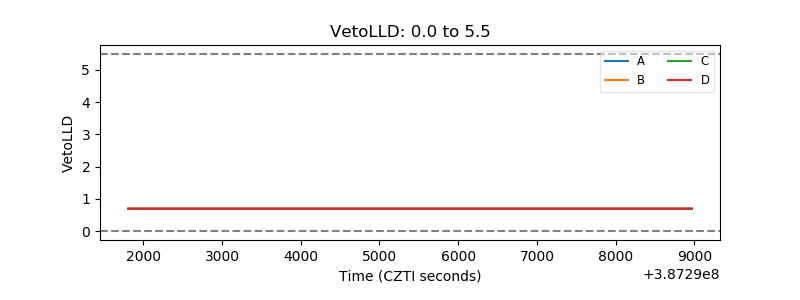 |
| Alpha Counter | 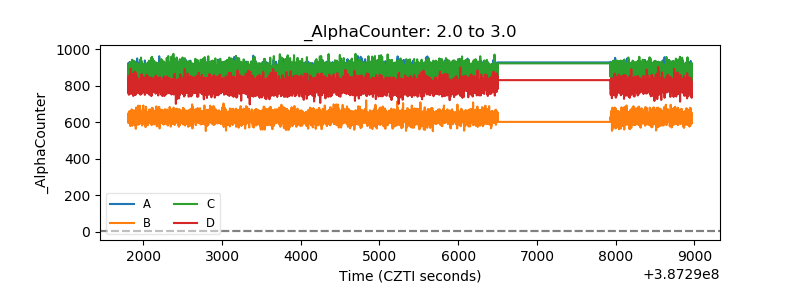 |
| _CPM_Rate | 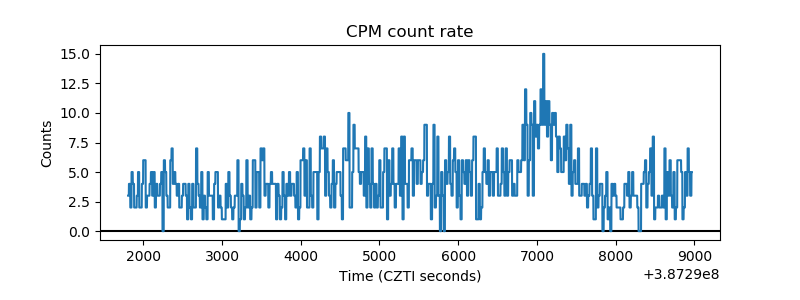 |
| CZT Counter | 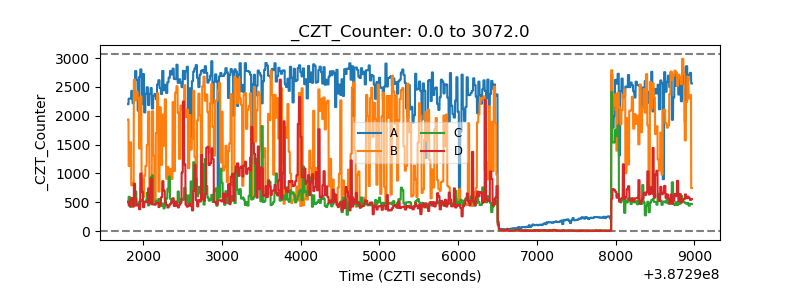 |
| +2.5 Volts monitor | 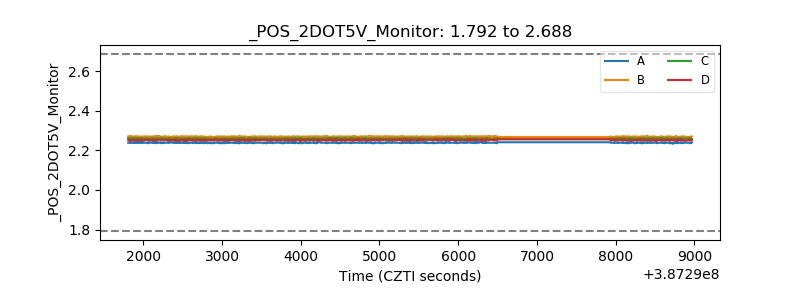 |
| +5 Volts monitor | 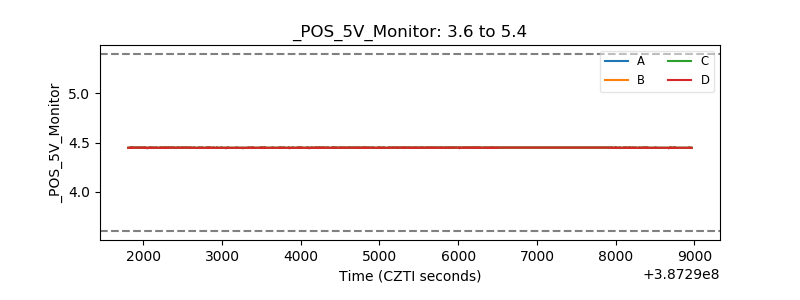 |
| _ROLL_ROT | 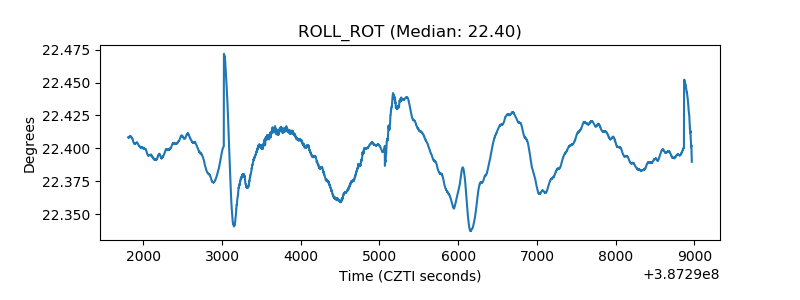 |
| _Roll_DEC | 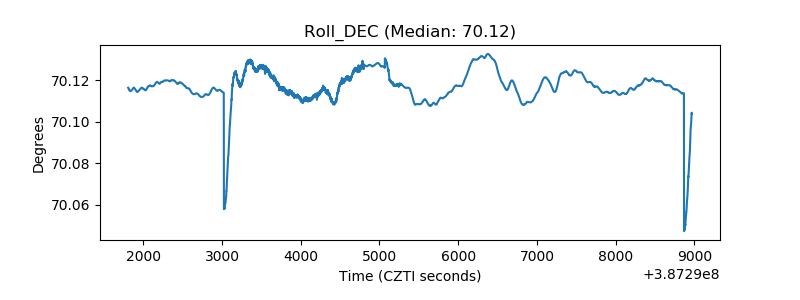 |
| _Roll_RA | 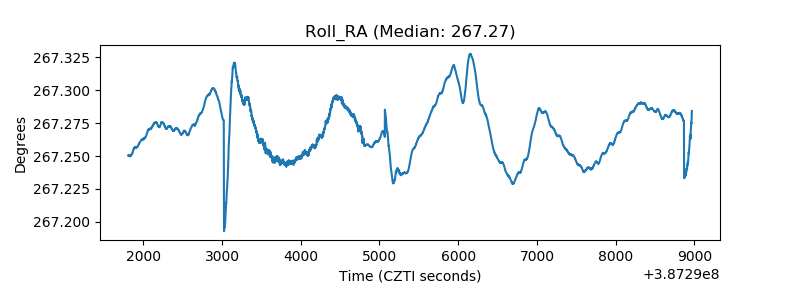 |
| Veto Counter | 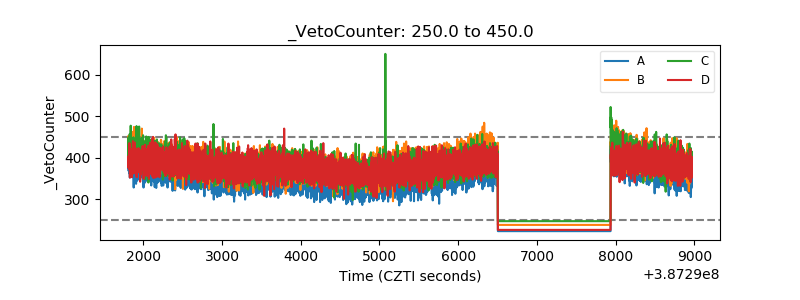 |