| Param | Original file | Final file |
|---|---|---|
| Filename | modeM0/AS1A11_046T08_9000005062_35322cztM0_level2.evt | modeM0/AS1A11_046T08_9000005062_35322cztM0_level2_quad_clean.evt |
| Size (bytes) | 870,727,680 | 83,606,400 |
| Size | 830.4 MB | 79.7 MB |
| Events in quadrant A | 11,660,145 | 352,818 |
| Events in quadrant B | 7,503,721 | 549,805 |
| Events in quadrant C | 3,457,948 | 649,751 |
| Events in quadrant D | 3,409,041 | 622,967 |
| Mode SS | |||
|---|---|---|---|
| Quadrant | BADHDUFLAG | Total packets | Discarded packets |
| A | 0 | 102 | 0 |
| B | 0 | 102 | 0 |
| C | 0 | 102 | 0 |
| D | 0 | 102 | 0 |
| Mode M0 | |||
|---|---|---|---|
| Quadrant | BADHDUFLAG | Total packets | Discarded packets |
| A | 0 | 38065 | 3 |
| B | 0 | 25819 | 2 |
| C | 0 | 13381 | 2 |
| D | 0 | 13377 | 2 |
| Mode M9 | |||
|---|---|---|---|
| Quadrant | BADHDUFLAG | Total packets | Discarded packets |
| A | 0 | 21 | 0 |
| B | 0 | 21 | 0 |
| C | 0 | 21 | 0 |
| D | 0 | 22 | 0 |
| Quadrant | Total seconds | Saturated seconds | Saturation percentage |
|---|---|---|---|
| A | 5043 | 4142 | 82.133651% |
| B | 5043 | 1950 | 38.667460% |
| C | 5043 | 186 | 3.688281% |
| D | 5043 | 221 | 4.382312% |
Noise dominated data is calculated using 1-second bins in cleaned event files. If a bin has >2000 counts, and if more than 50% of those come from <1% of pixels, then it is considered to be noise-dominated and hence unusable.
| Quadrant | # 1 sec bins | Bins with >0 counts | Bins with >2000 counts | High rate bins dominated by noise | Noise dominated (total time) | Noise dominated (detector-on time) | Marked lightcurve |
|---|---|---|---|---|---|---|---|
| A | 7075 | 5043 | 4052 | 4052 | 57.27% | 80.35% | 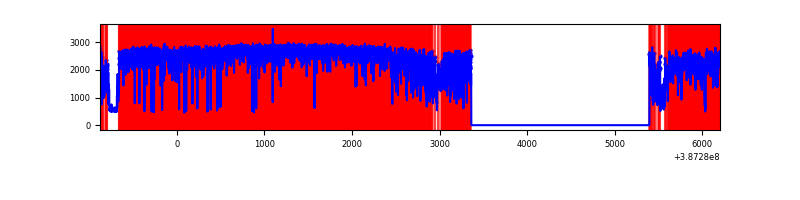 |
| B | 7075 | 5043 | 1537 | 1537 | 21.72% | 30.48% | 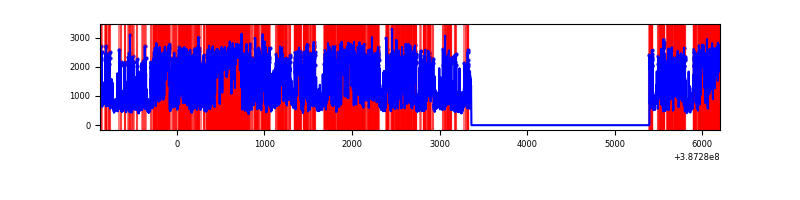 |
| C | 7076 | 5043 | 163 | 163 | 2.30% | 3.23% | 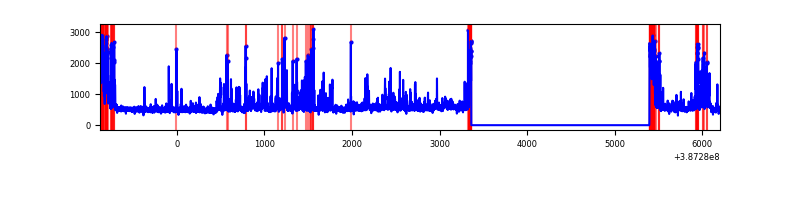 |
| D | 7076 | 5044 | 200 | 200 | 2.83% | 3.97% | 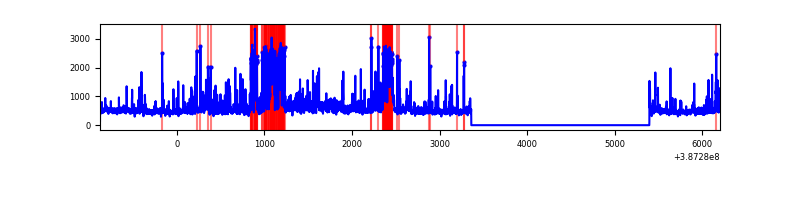 |
Top three noisy pixels from each quadrant. If the there are fewer than three noisy pixels in the level2.evt file, extra rows are filled as -1
| Pixel properties | Quadrant properties | ||||||
|---|---|---|---|---|---|---|---|
| Quadrant | DetID | PixID | Counts | Sigma | Mean | Median | Sigma |
| A | 15 | 169 | 10126897 | 140861.26 | 360 | 352 | 71.9 |
| A | 10 | 83 | 77747 | 1076.57 | 360 | 352 | 71.9 |
| A | 8 | 192 | 27946 | 383.84 | 360 | 352 | 71.9 |
| B | 5 | 236 | 3945978 | 41591.75 | 497 | 487 | 94.9 |
| B | 5 | 172 | 1441617 | 15191.8 | 497 | 487 | 94.9 |
| B | 4 | 232 | 138316 | 1452.94 | 497 | 487 | 94.9 |
| C | 0 | 10 | 536213 | 4140.06 | 564 | 567 | 129.4 |
| C | 3 | 233 | 511489 | 3948.96 | 564 | 567 | 129.4 |
| C | 15 | 214 | 209756 | 1616.84 | 564 | 567 | 129.4 |
| D | 10 | 118 | 264453 | 1922.93 | 570 | 555 | 137.2 |
| D | 12 | 233 | 214139 | 1556.31 | 570 | 555 | 137.2 |
| D | 12 | 6 | 192221 | 1396.6 | 570 | 555 | 137.2 |
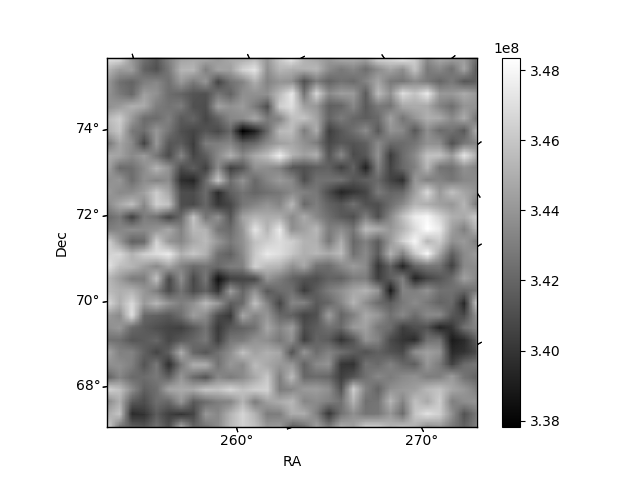
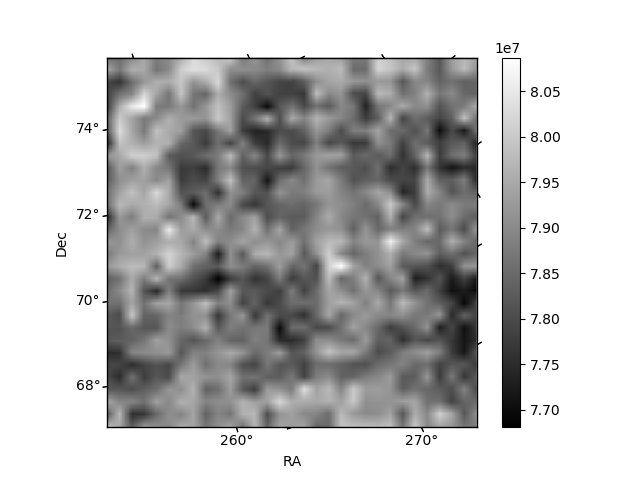
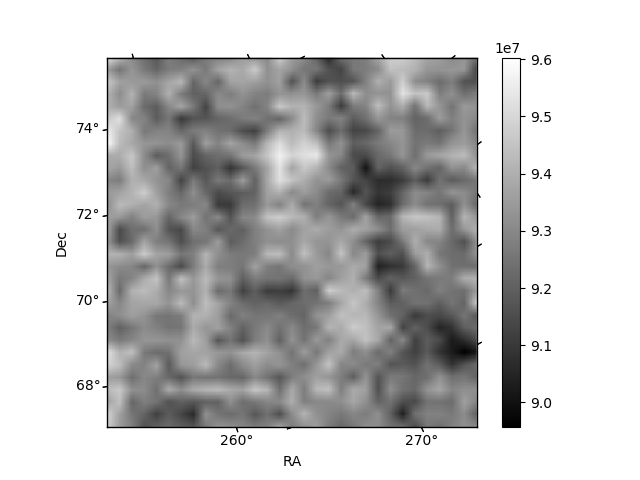
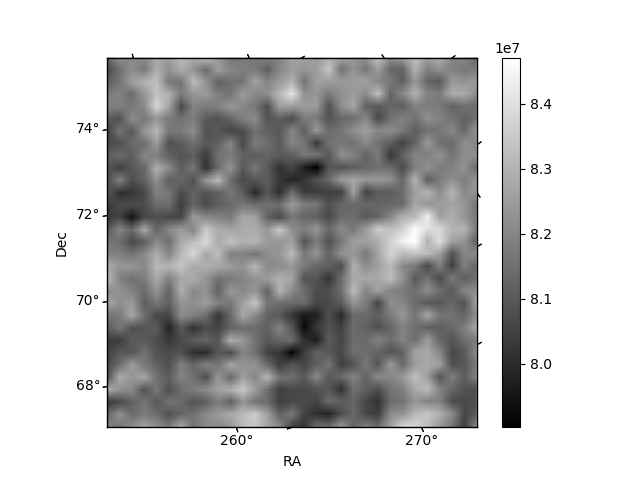
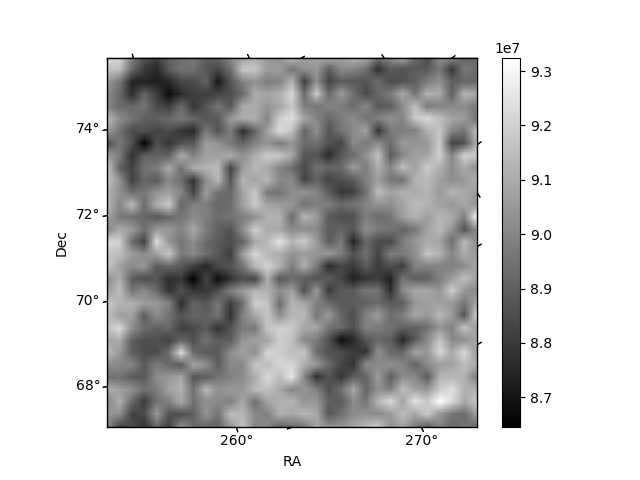
Histogram calculated using DETX and DETY for each event in the final _common_clean file
| Quadrant A | 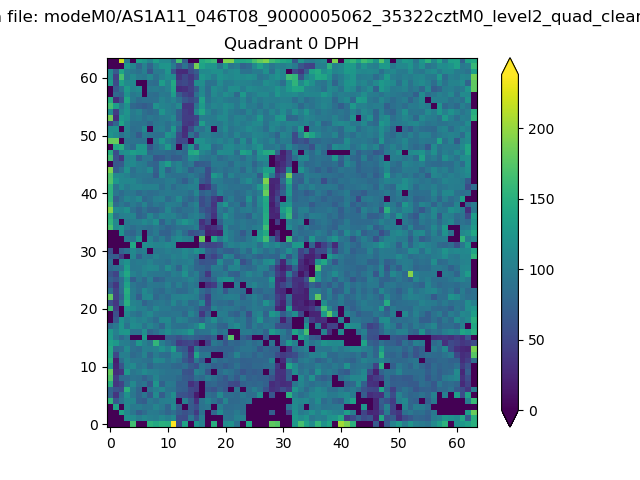 |
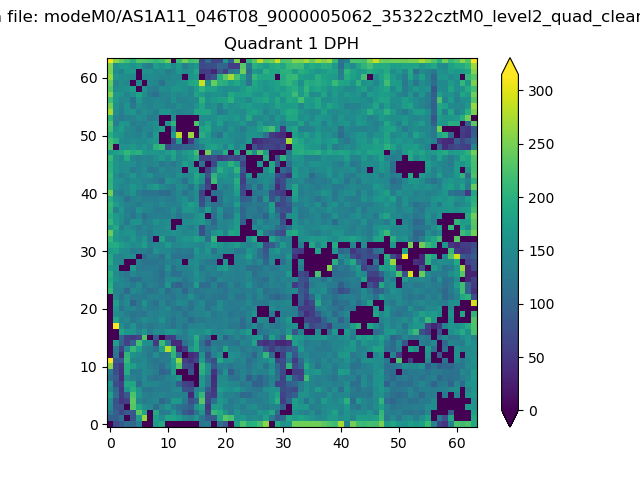 |
Quadrant B |
|---|---|---|---|
| Quadrant D | 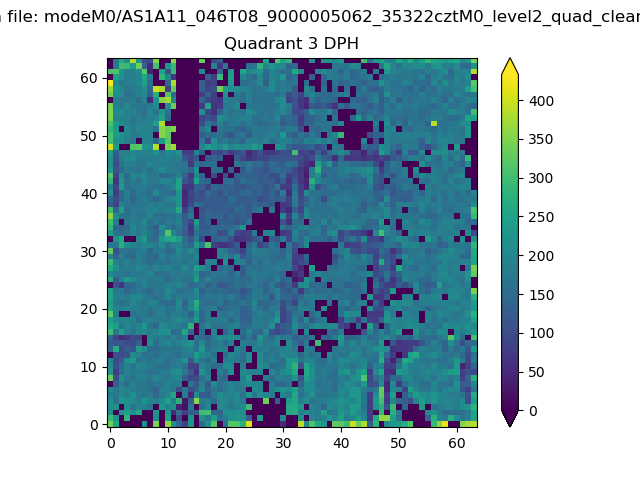 |
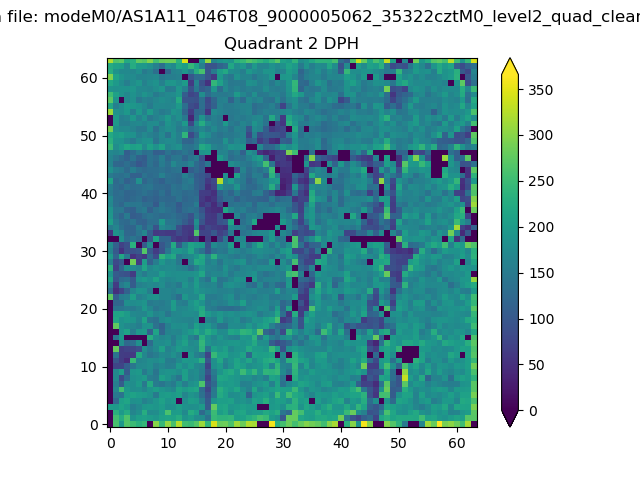 |
Quadrant C |
| Plot type | Count rate plots | Images |
|---|---|---|
| Comparison with Poisson distribution Blue bars denote a histogram of data divided into 1 sec bins. Red curve is a Poisson curve with rate = median count rate of data. |
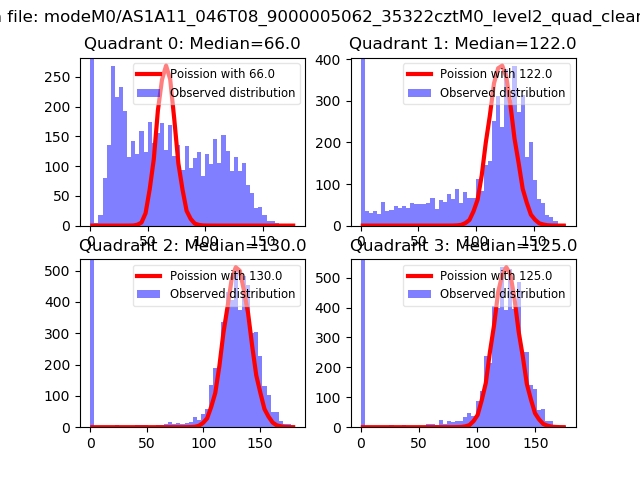 |
 |
| Quadrant-wise count rates Data is divided into 100 sec bins |
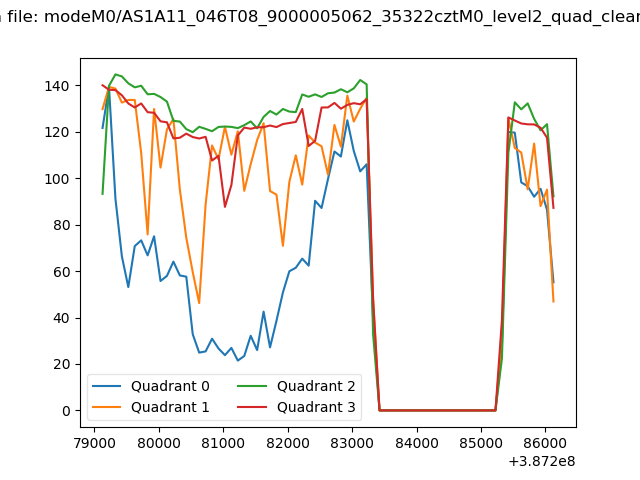 |
|
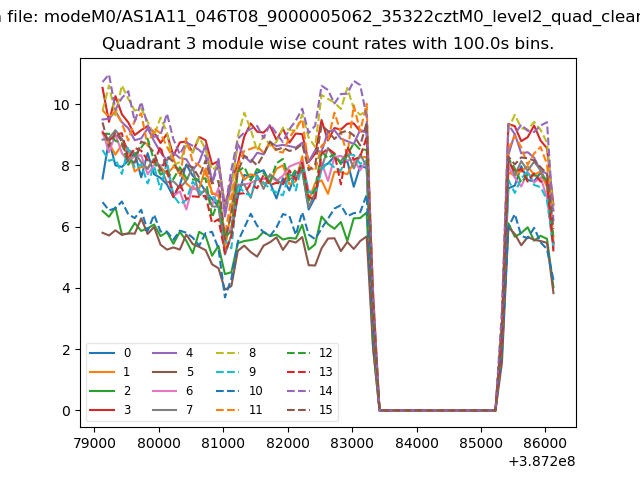
| Module-wise count rates for Quadrant A Data is divided into 100 sec bins |
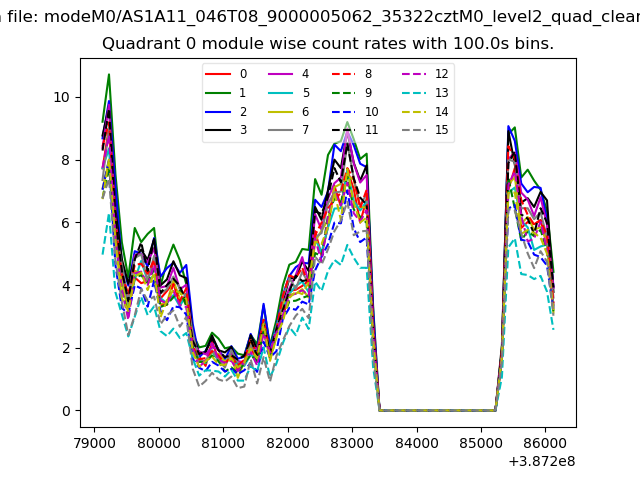 |
 |
| Module-wise count rates for Quadrant B Data is divided into 100 sec bins |
 |
 |
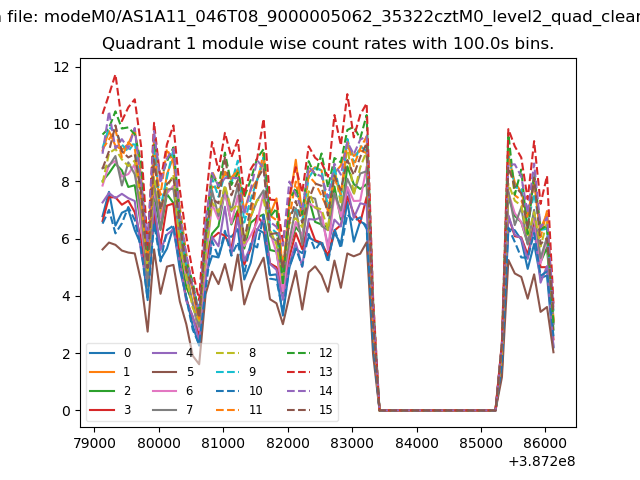
| Module-wise count rates for Quadrant C Data is divided into 100 sec bins |
 |
 |
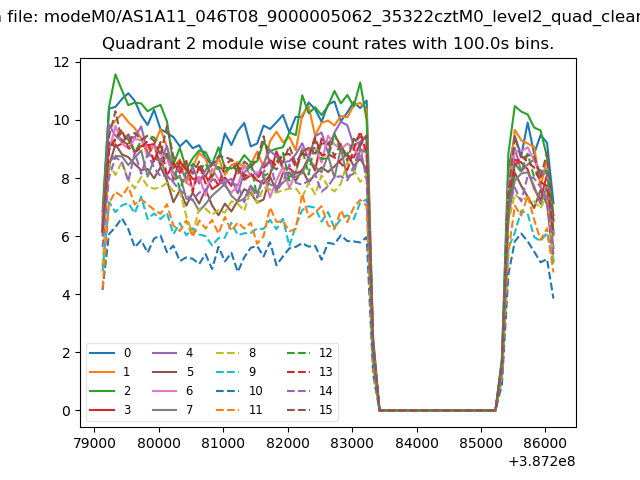
| Module-wise count rates for Quadrant D Data is divided into 100 sec bins |
 |
 |
| Parameter | Plot |
|---|---|
| CZT HV Monitor | 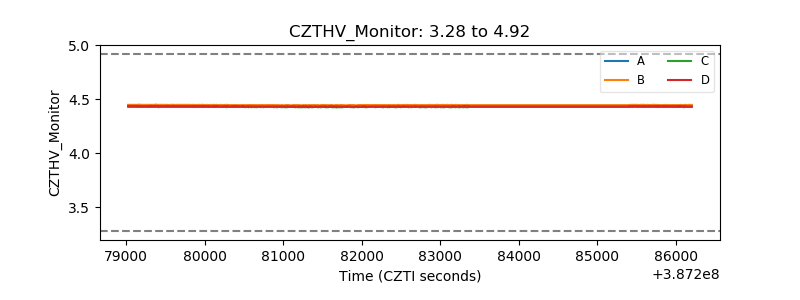 |
| D_VDD | 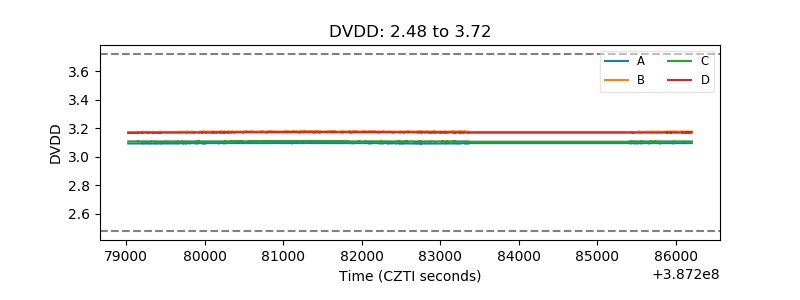 |
| Temperature 1 | 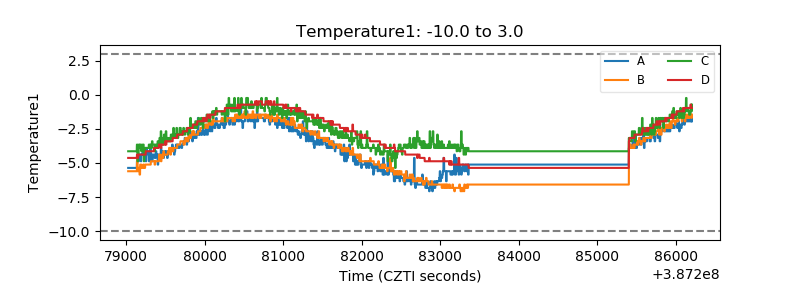 |
| Veto HV Monitor | 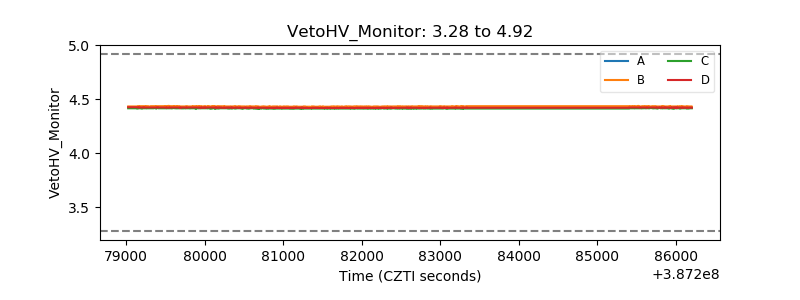 |
| Veto LLD | 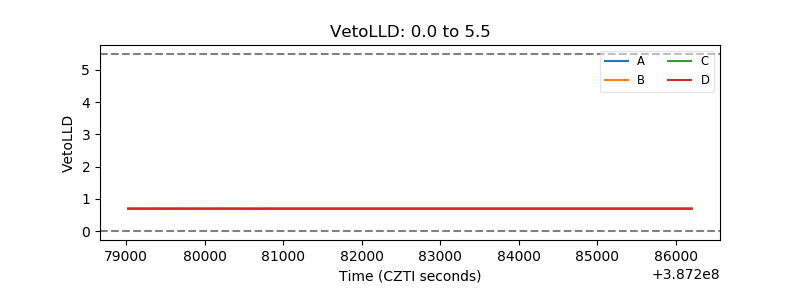 |
| Alpha Counter | 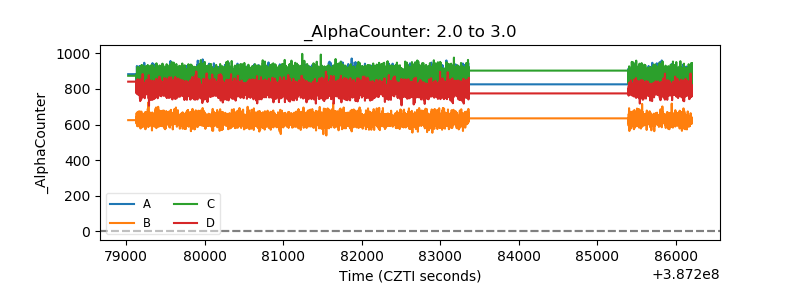 |
| _CPM_Rate | 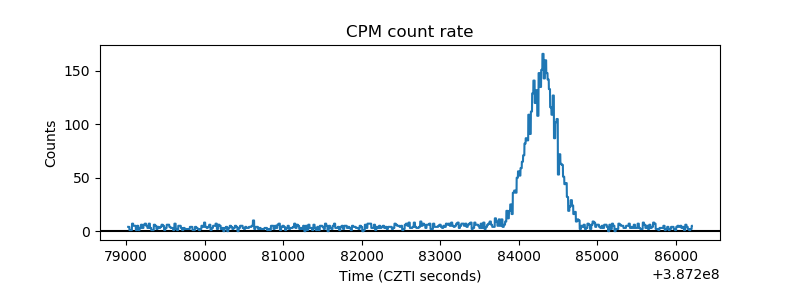 |
| CZT Counter | 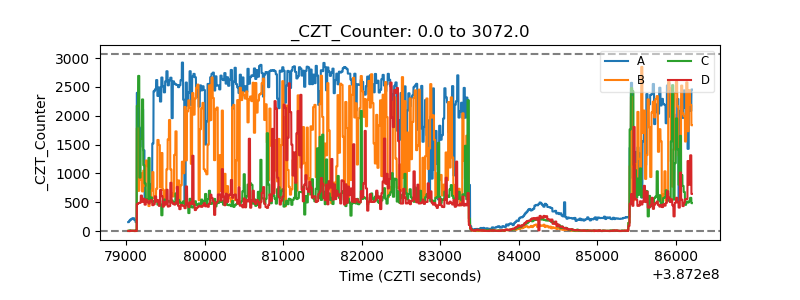 |
| +2.5 Volts monitor | 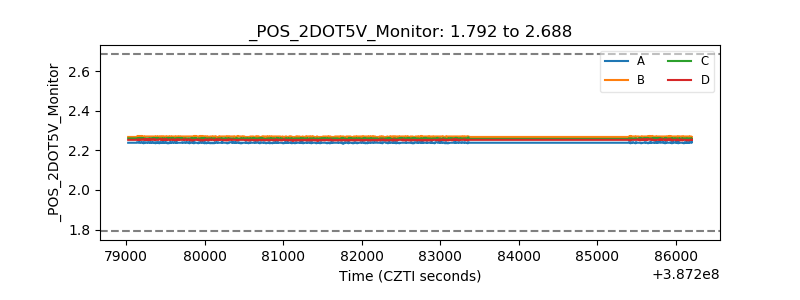 |
| +5 Volts monitor | 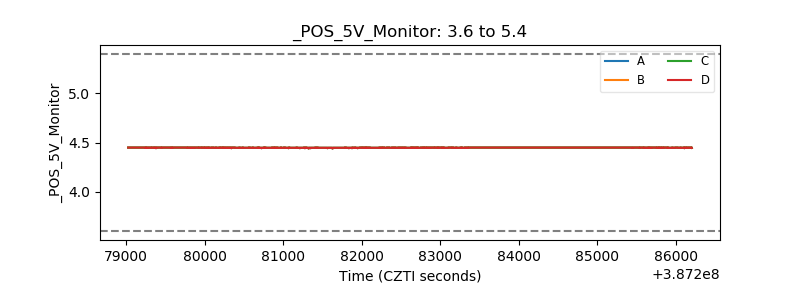 |
| _ROLL_ROT | 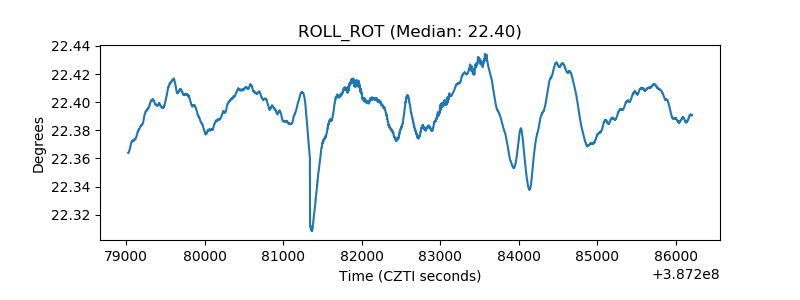 |
| _Roll_DEC | 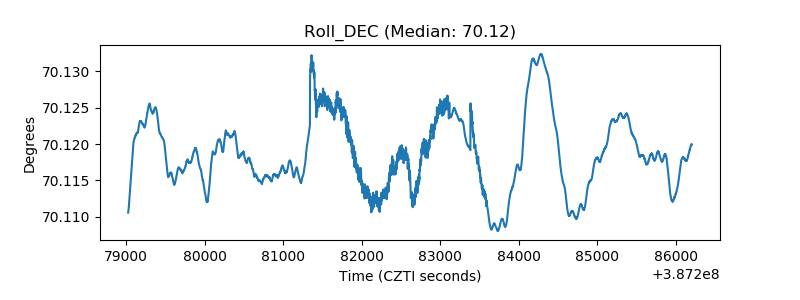 |
| _Roll_RA | 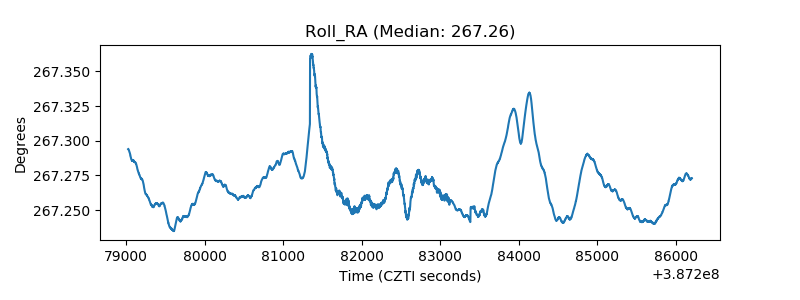 |
| Veto Counter | 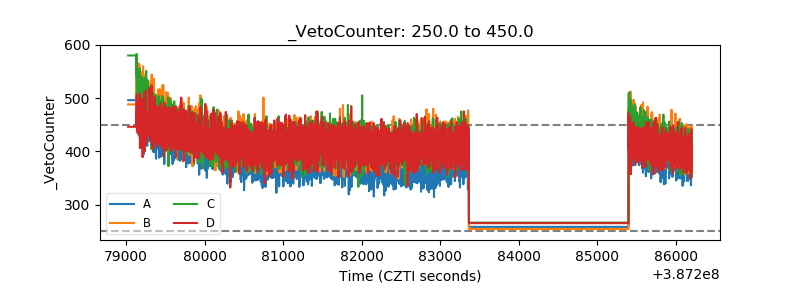 |