| Param | Original file | Final file |
|---|---|---|
| Filename | modeM0/AS1T05_023T01_9000005058_35317cztM0_level2.evt | modeM0/AS1T05_023T01_9000005058_35317cztM0_level2_quad_clean.evt |
| Size (bytes) | 525,588,480 | 72,239,040 |
| Size | 501.2 MB | 68.9 MB |
| Events in quadrant A | 2,629,149 | 468,616 |
| Events in quadrant B | 5,000,512 | 437,228 |
| Events in quadrant C | 3,048,937 | 466,539 |
| Events in quadrant D | 4,873,876 | 437,524 |
| Mode M0 | |||
|---|---|---|---|
| Quadrant | BADHDUFLAG | Total packets | Discarded packets |
| A | 0 | 11236 | 3 |
| B | 0 | 18441 | 2 |
| C | 0 | 12366 | 2 |
| D | 0 | 18240 | 2 |
| Mode M9 | |||
|---|---|---|---|
| Quadrant | BADHDUFLAG | Total packets | Discarded packets |
| A | 0 | 26 | 0 |
| B | 0 | 26 | 0 |
| C | 0 | 26 | 0 |
| D | 0 | 27 | 0 |
| Mode SS | |||
|---|---|---|---|
| Quadrant | BADHDUFLAG | Total packets | Discarded packets |
| A | 0 | 110 | 0 |
| B | 0 | 110 | 0 |
| C | 0 | 110 | 0 |
| D | 0 | 110 | 0 |
| Quadrant | Total seconds | Saturated seconds | Saturation percentage |
|---|---|---|---|
| A | 5387 | 18 | 0.334138% |
| B | 5387 | 742 | 13.773900% |
| C | 5387 | 80 | 1.485057% |
| D | 5387 | 320 | 5.940226% |
Noise dominated data is calculated using 1-second bins in cleaned event files. If a bin has >2000 counts, and if more than 50% of those come from <1% of pixels, then it is considered to be noise-dominated and hence unusable.
| Quadrant | # 1 sec bins | Bins with >0 counts | Bins with >2000 counts | High rate bins dominated by noise | Noise dominated (total time) | Noise dominated (detector-on time) | Marked lightcurve |
|---|---|---|---|---|---|---|---|
| A | 7179 | 5388 | 13 | 13 | 0.18% | 0.24% | 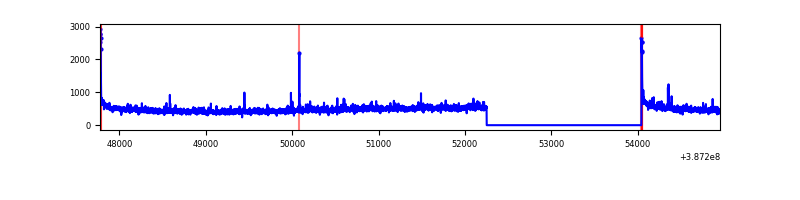 |
| B | 7179 | 5388 | 600 | 600 | 8.36% | 11.14% | 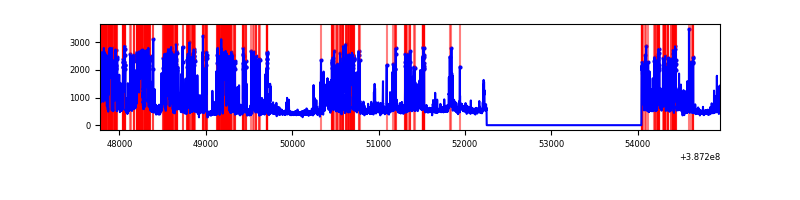 |
| C | 7179 | 5388 | 63 | 63 | 0.88% | 1.17% | 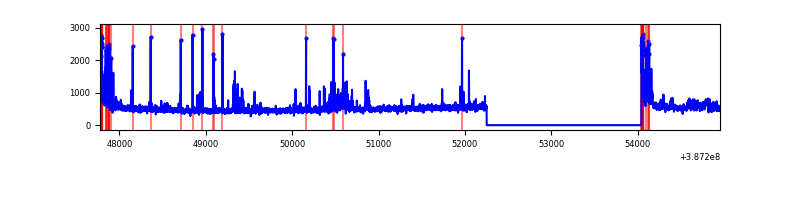 |
| D | 7178 | 5387 | 340 | 340 | 4.74% | 6.31% |  |
Top three noisy pixels from each quadrant. If the there are fewer than three noisy pixels in the level2.evt file, extra rows are filled as -1
| Pixel properties | Quadrant properties | ||||||
|---|---|---|---|---|---|---|---|
| Quadrant | DetID | PixID | Counts | Sigma | Mean | Median | Sigma |
| A | 10 | 83 | 94741 | 748.32 | 623 | 612 | 125.8 |
| A | 15 | 169 | 66927 | 527.2 | 623 | 612 | 125.8 |
| A | 8 | 192 | 30437 | 237.11 | 623 | 612 | 125.8 |
| B | 5 | 236 | 1376343 | 12155.84 | 587 | 570 | 113.2 |
| B | 5 | 172 | 1266252 | 11183.12 | 587 | 570 | 113.2 |
| B | 0 | 190 | 25902 | 223.82 | 587 | 570 | 113.2 |
| C | 0 | 10 | 340353 | 2437.14 | 602 | 609 | 139.4 |
| C | 15 | 214 | 220747 | 1579.15 | 602 | 609 | 139.4 |
| C | 15 | 159 | 80077 | 570.06 | 602 | 609 | 139.4 |
| D | 2 | 249 | 1049488 | 7261.56 | 589 | 573 | 144.4 |
| D | 7 | 80 | 667166 | 4614.78 | 589 | 573 | 144.4 |
| D | 8 | 195 | 390984 | 2702.79 | 589 | 573 | 144.4 |
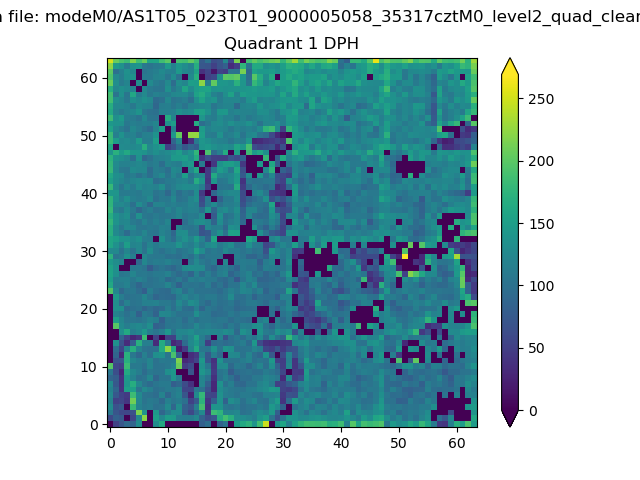
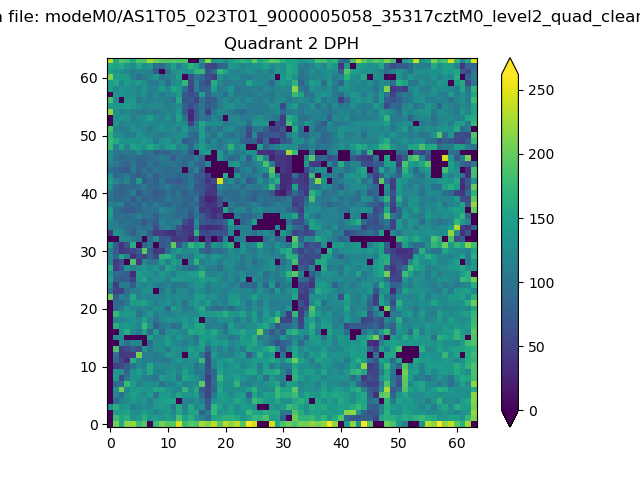
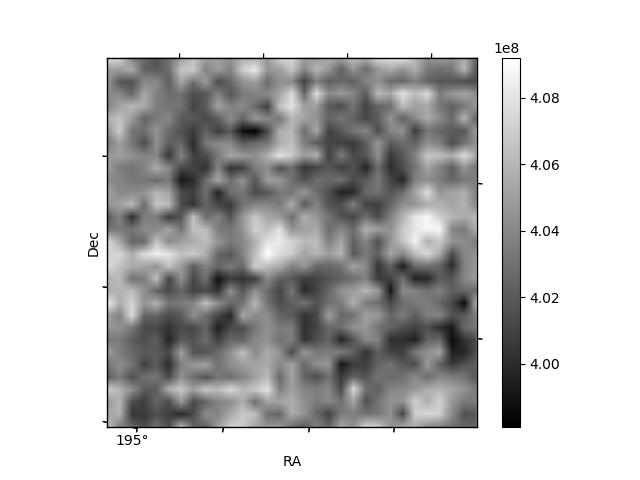
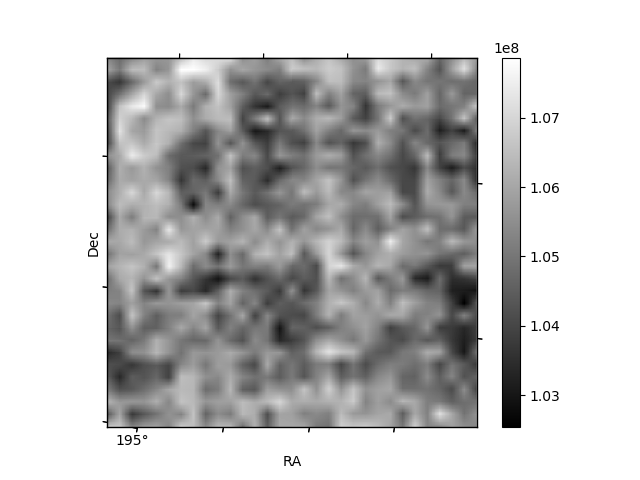
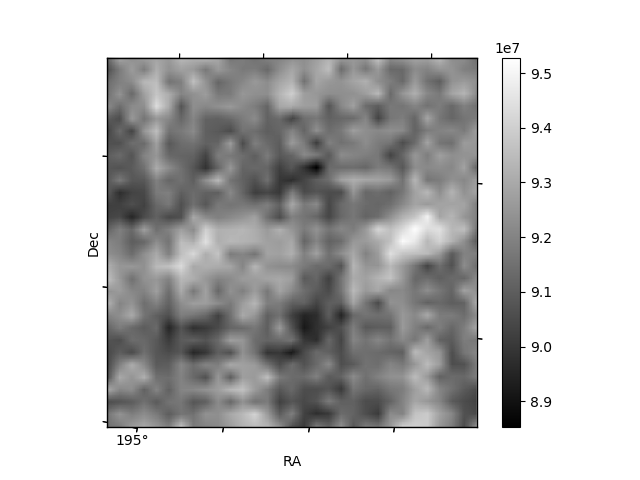
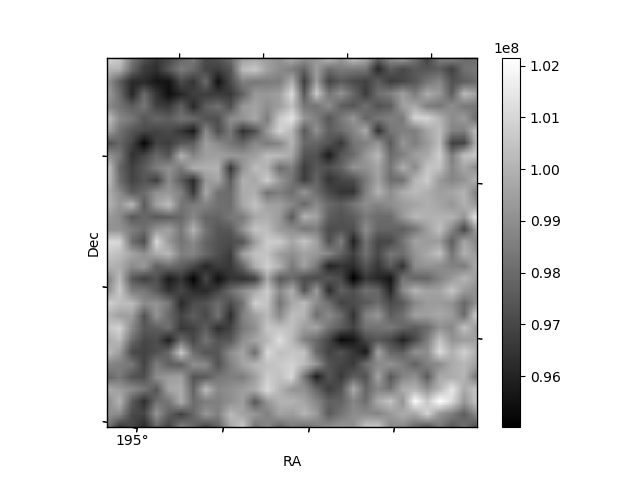
Histogram calculated using DETX and DETY for each event in the final _common_clean file
| Quadrant A | 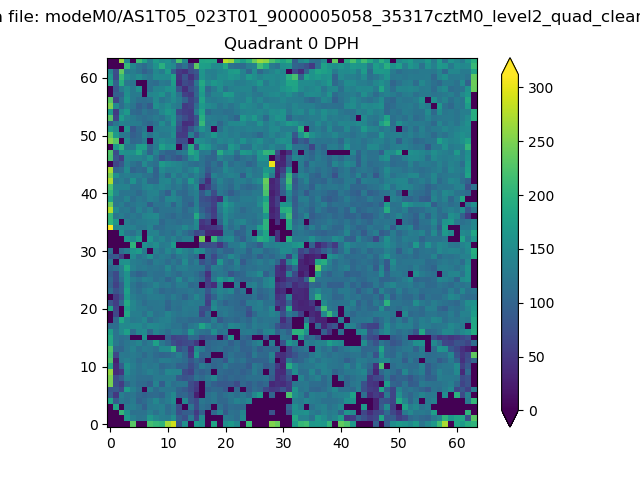 |
 |
Quadrant B |
|---|---|---|---|
| Quadrant D | 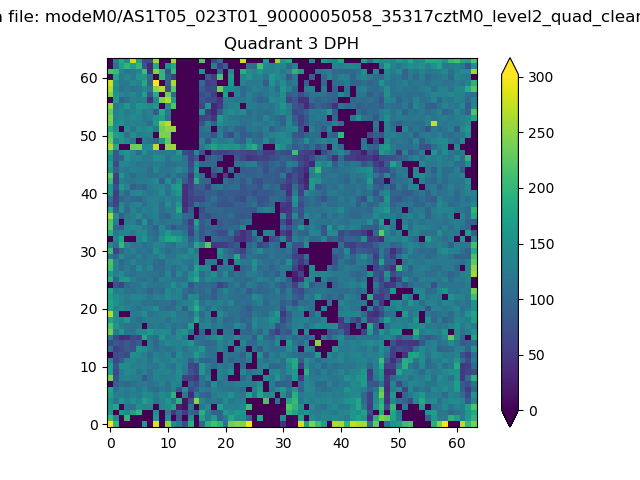 |
 |
Quadrant C |
| Plot type | Count rate plots | Images |
|---|---|---|
| Comparison with Poisson distribution Blue bars denote a histogram of data divided into 1 sec bins. Red curve is a Poisson curve with rate = median count rate of data. |
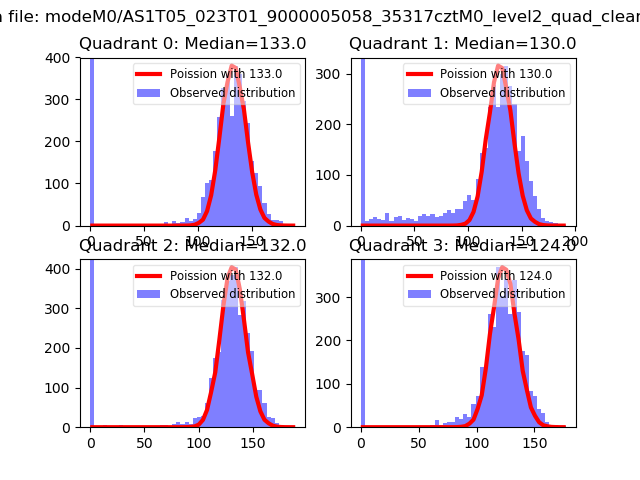 |
 |
| Quadrant-wise count rates Data is divided into 100 sec bins |
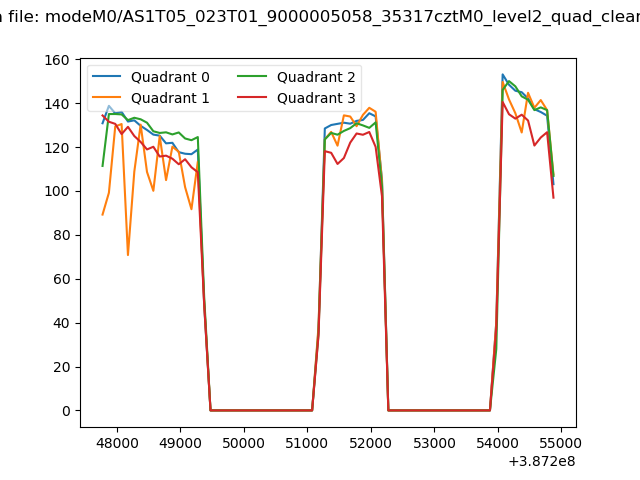 |
|
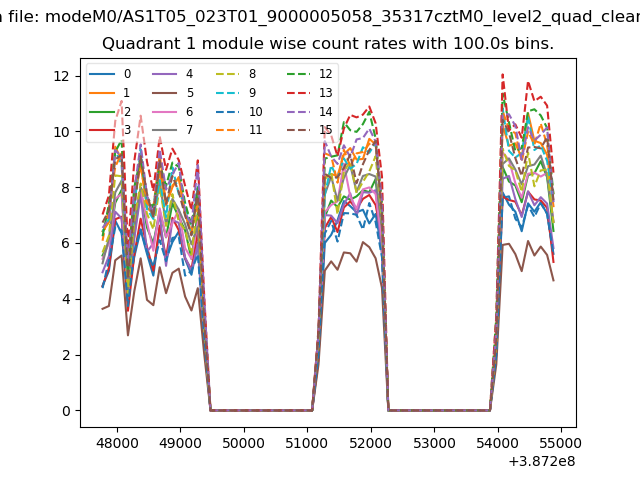
| Module-wise count rates for Quadrant A Data is divided into 100 sec bins |
 |
 |
| Module-wise count rates for Quadrant B Data is divided into 100 sec bins |
 |
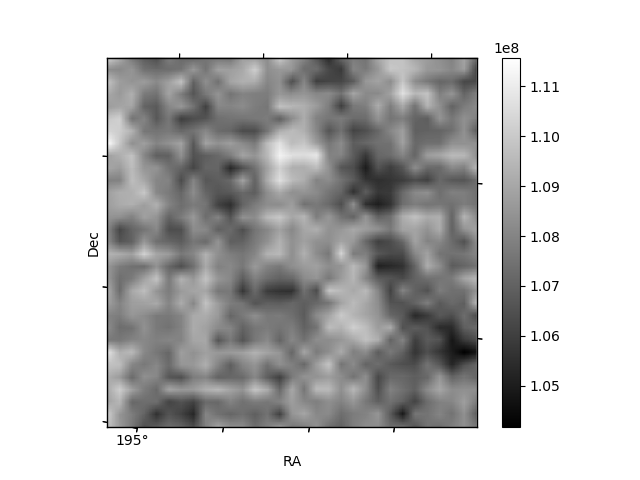 |
| Module-wise count rates for Quadrant C Data is divided into 100 sec bins |
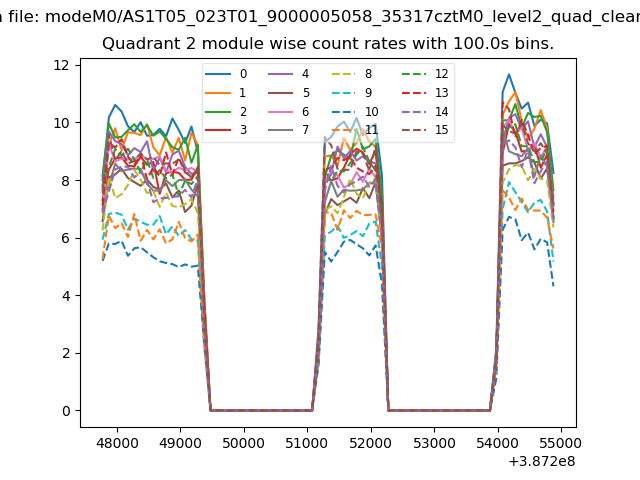 |
 |
| Module-wise count rates for Quadrant D Data is divided into 100 sec bins |
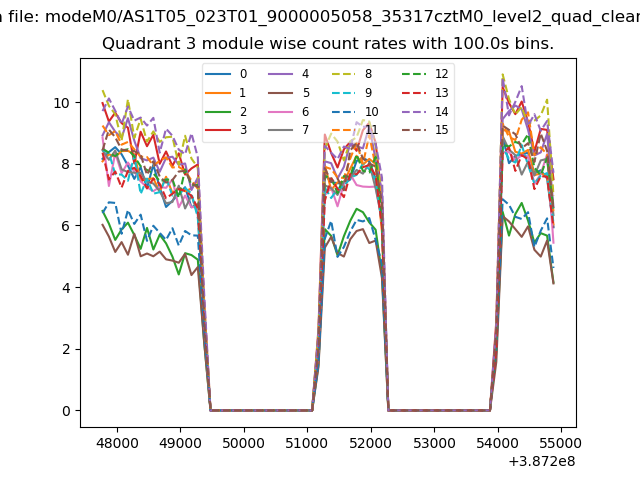 |
 |
| Parameter | Plot |
|---|---|
| CZT HV Monitor | 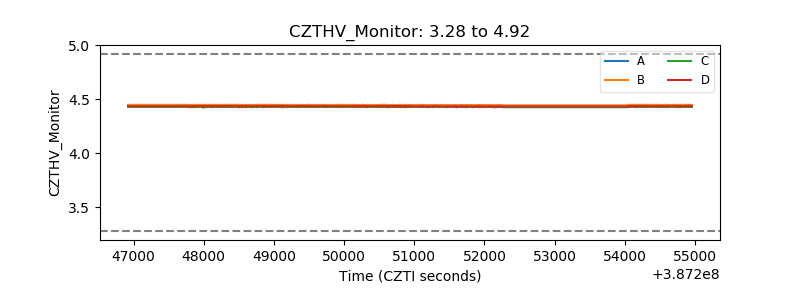 |
| D_VDD | 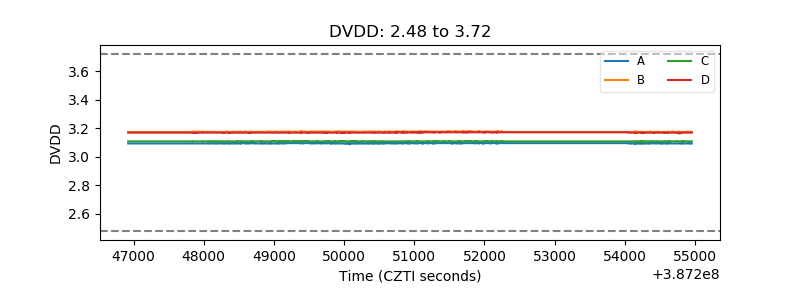 |
| Temperature 1 | 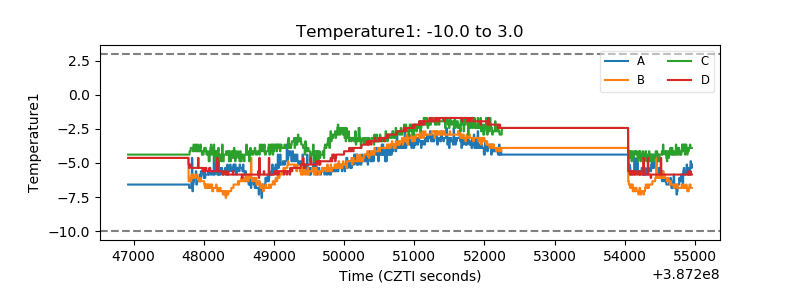 |
| Veto HV Monitor | 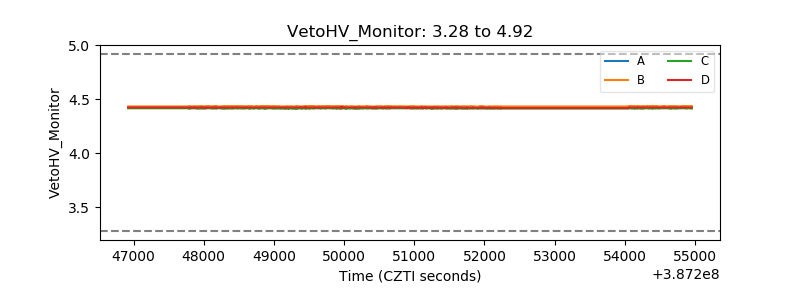 |
| Veto LLD | 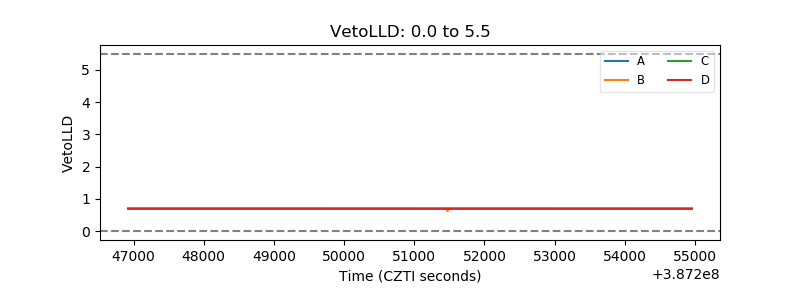 |
| Alpha Counter | 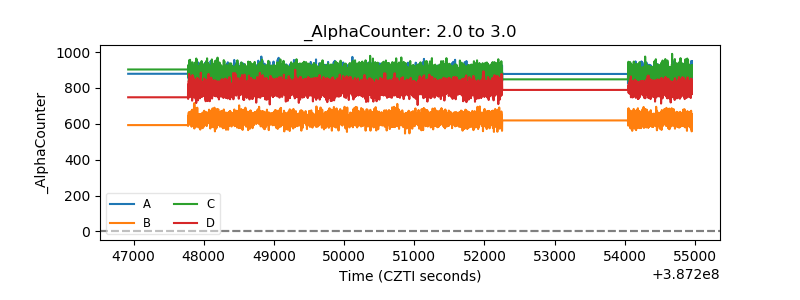 |
| _CPM_Rate | 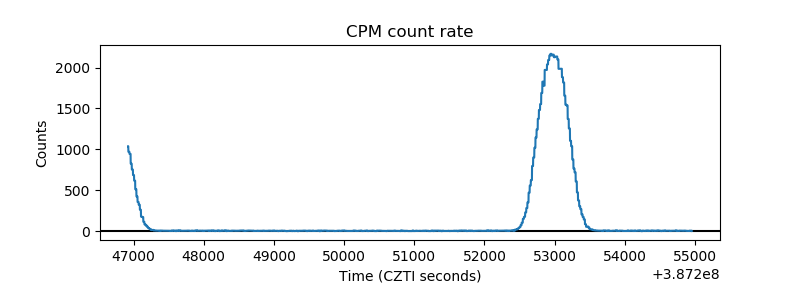 |
| CZT Counter | 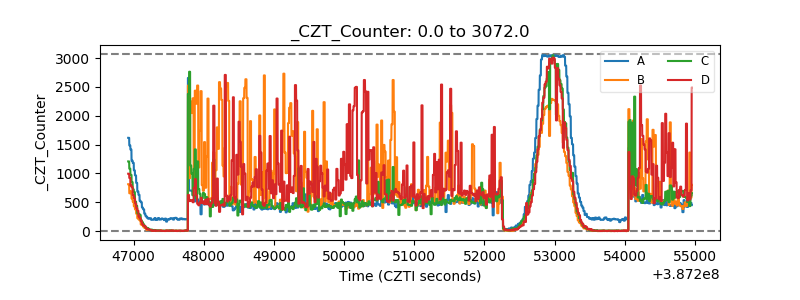 |
| +2.5 Volts monitor | 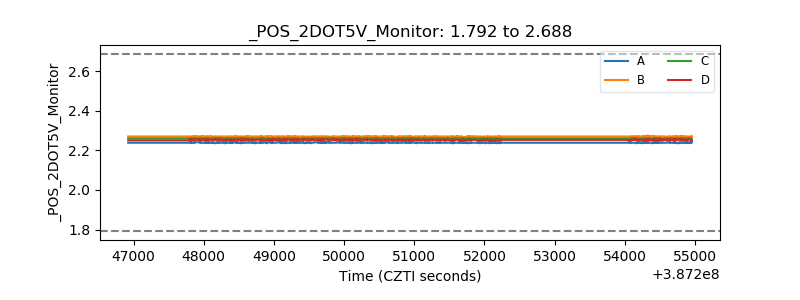 |
| +5 Volts monitor | 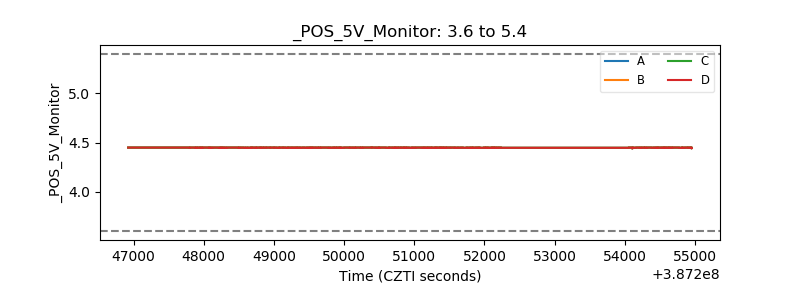 |
| _ROLL_ROT | 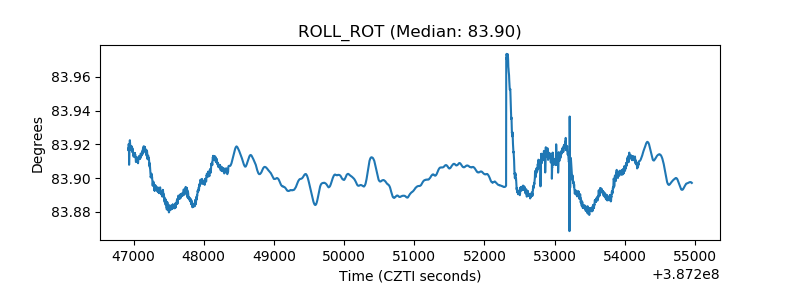 |
| _Roll_DEC | 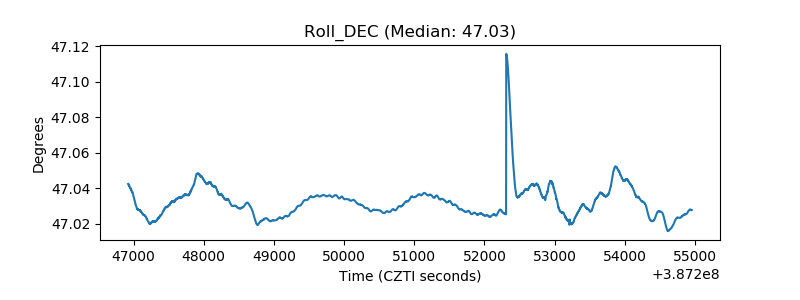 |
| _Roll_RA | 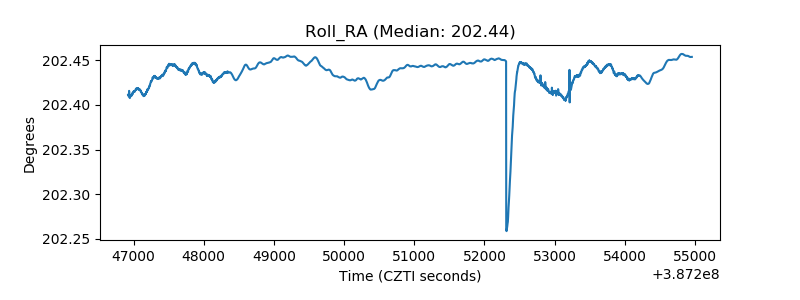 |
| Veto Counter | 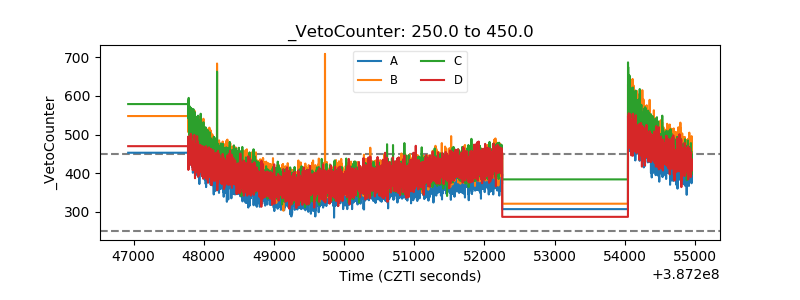 |