| Param | Original file | Final file |
|---|---|---|
| Filename | modeM0/AS1T05_023T01_9000005058_35315cztM0_level2.evt | modeM0/AS1T05_023T01_9000005058_35315cztM0_level2_quad_clean.evt |
| Size (bytes) | 613,984,320 | 75,355,200 |
| Size | 585.5 MB | 71.9 MB |
| Events in quadrant A | 2,721,978 | 491,576 |
| Events in quadrant B | 7,315,897 | 432,458 |
| Events in quadrant C | 2,979,218 | 495,262 |
| Events in quadrant D | 5,189,265 | 460,875 |
| Mode M0 | |||
|---|---|---|---|
| Quadrant | BADHDUFLAG | Total packets | Discarded packets |
| A | 0 | 11905 | 3 |
| B | 0 | 25690 | 2 |
| C | 0 | 12439 | 2 |
| D | 0 | 19355 | 2 |
| Mode M9 | |||
|---|---|---|---|
| Quadrant | BADHDUFLAG | Total packets | Discarded packets |
| A | 0 | 32 | 0 |
| B | 0 | 32 | 0 |
| C | 0 | 32 | 0 |
| D | 0 | 32 | 0 |
| Mode SS | |||
|---|---|---|---|
| Quadrant | BADHDUFLAG | Total packets | Discarded packets |
| A | 0 | 118 | 0 |
| B | 0 | 118 | 0 |
| C | 0 | 118 | 0 |
| D | 0 | 118 | 0 |
| Quadrant | Total seconds | Saturated seconds | Saturation percentage |
|---|---|---|---|
| A | 5740 | 20 | 0.348432% |
| B | 5740 | 1600 | 27.874564% |
| C | 5740 | 54 | 0.940767% |
| D | 5740 | 330 | 5.749129% |
Noise dominated data is calculated using 1-second bins in cleaned event files. If a bin has >2000 counts, and if more than 50% of those come from <1% of pixels, then it is considered to be noise-dominated and hence unusable.
| Quadrant | # 1 sec bins | Bins with >0 counts | Bins with >2000 counts | High rate bins dominated by noise | Noise dominated (total time) | Noise dominated (detector-on time) | Marked lightcurve |
|---|---|---|---|---|---|---|---|
| A | 8935 | 5742 | 15 | 15 | 0.17% | 0.26% | 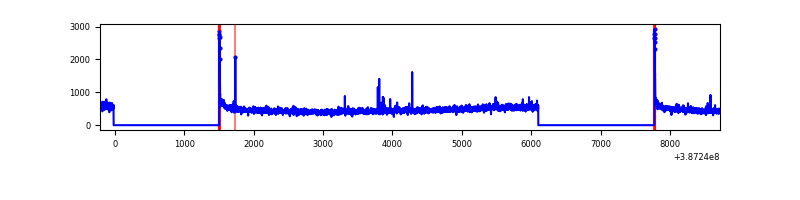 |
| B | 8935 | 5742 | 1221 | 1221 | 13.67% | 21.26% | 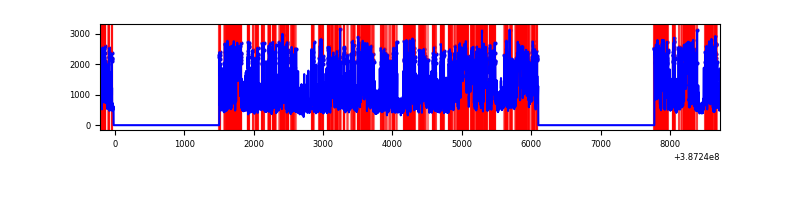 |
| C | 8935 | 5742 | 43 | 43 | 0.48% | 0.75% | 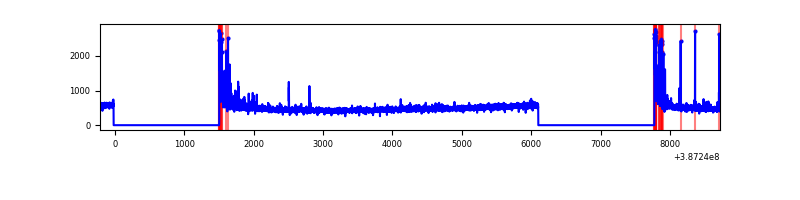 |
| D | 8935 | 5742 | 351 | 351 | 3.93% | 6.11% | 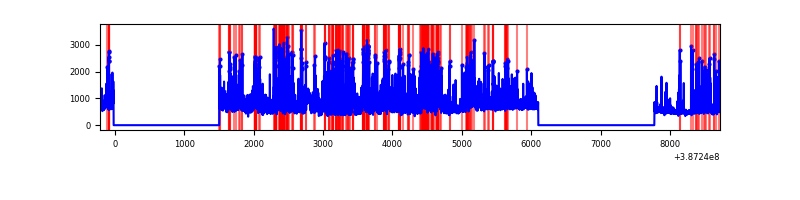 |
Top three noisy pixels from each quadrant. If the there are fewer than three noisy pixels in the level2.evt file, extra rows are filled as -1
| Pixel properties | Quadrant properties | ||||||
|---|---|---|---|---|---|---|---|
| Quadrant | DetID | PixID | Counts | Sigma | Mean | Median | Sigma |
| A | 10 | 83 | 94951 | 716.13 | 651 | 638 | 131.7 |
| A | 15 | 169 | 42572 | 318.41 | 651 | 638 | 131.7 |
| A | 8 | 192 | 34854 | 259.81 | 651 | 638 | 131.7 |
| B | 5 | 236 | 3405043 | 30302.66 | 577 | 561 | 112.3 |
| B | 5 | 172 | 1571127 | 13979.32 | 577 | 561 | 112.3 |
| B | 4 | 232 | 41196 | 361.68 | 577 | 561 | 112.3 |
| C | 0 | 10 | 252557 | 1710.43 | 635 | 638 | 147.3 |
| C | 15 | 214 | 236571 | 1601.9 | 635 | 638 | 147.3 |
| C | 13 | 61 | 4448 | 25.87 | 635 | 638 | 147.3 |
| D | 2 | 249 | 1049012 | 6851.0 | 621 | 603 | 153.0 |
| D | 7 | 80 | 986771 | 6444.27 | 621 | 603 | 153.0 |
| D | 8 | 195 | 407856 | 2661.26 | 621 | 603 | 153.0 |
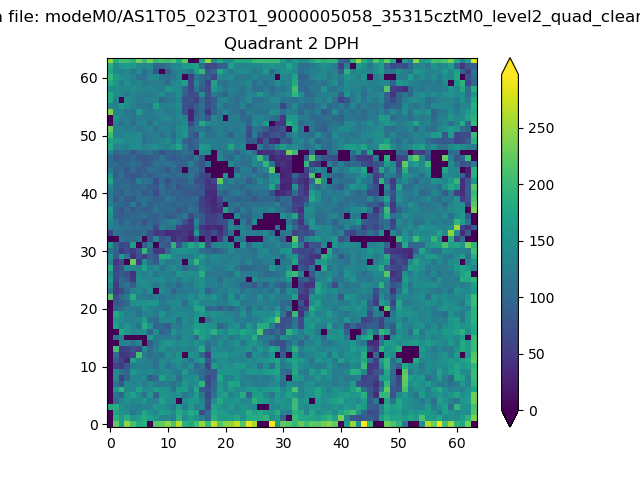
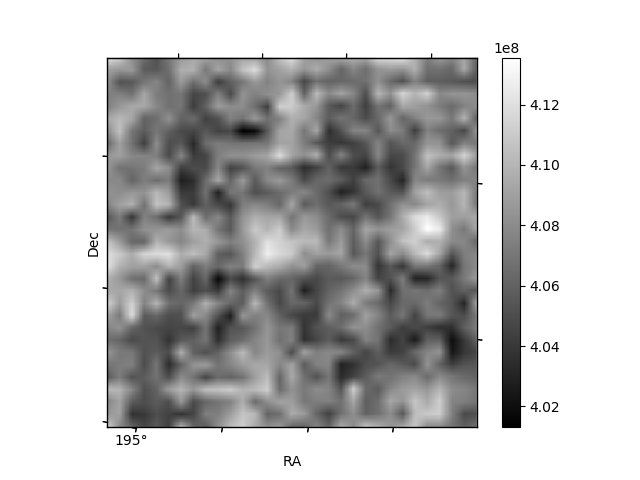
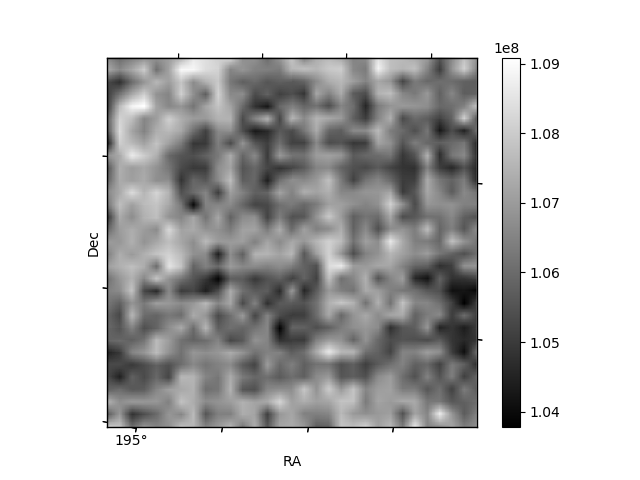
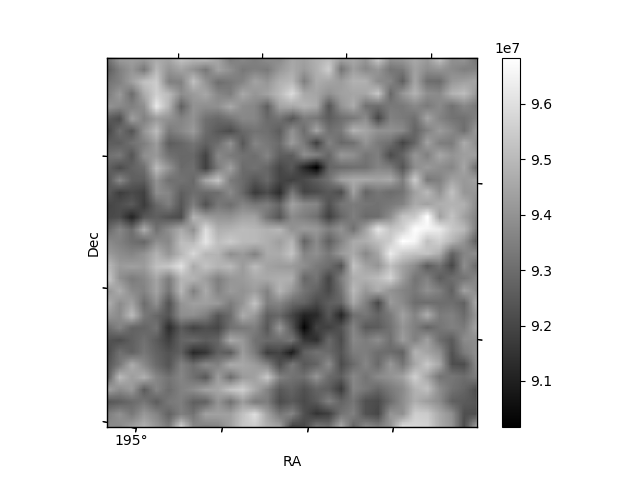
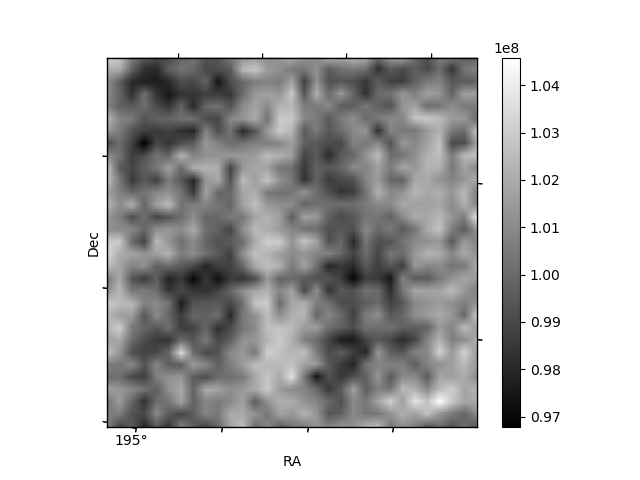
Histogram calculated using DETX and DETY for each event in the final _common_clean file
| Quadrant A | 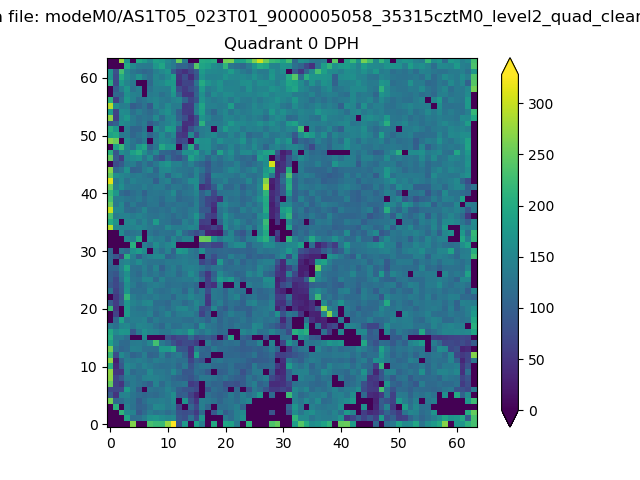 |
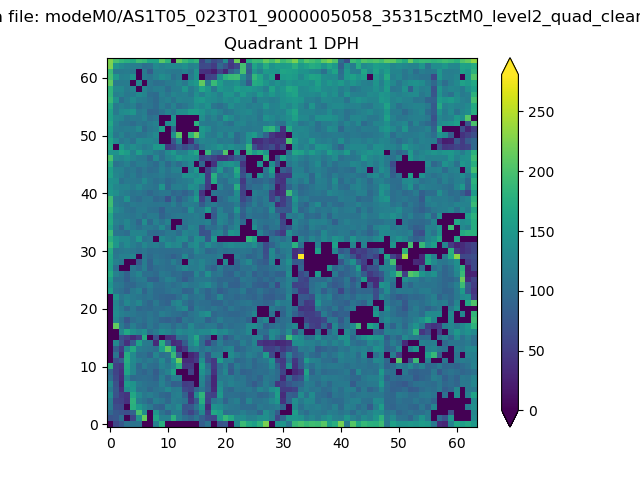 |
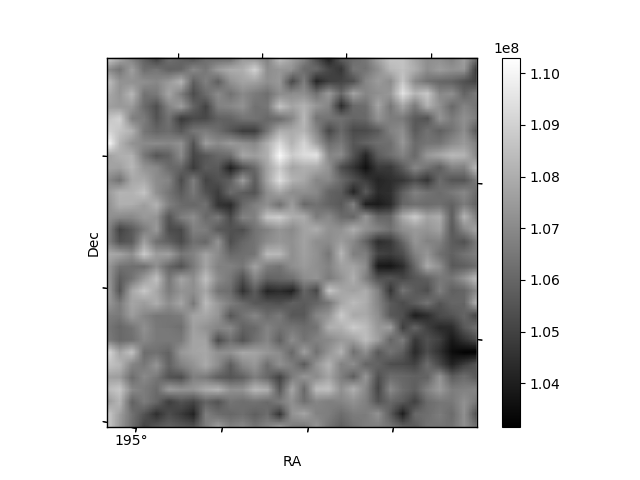
Quadrant B |
|---|---|---|---|
| Quadrant D | 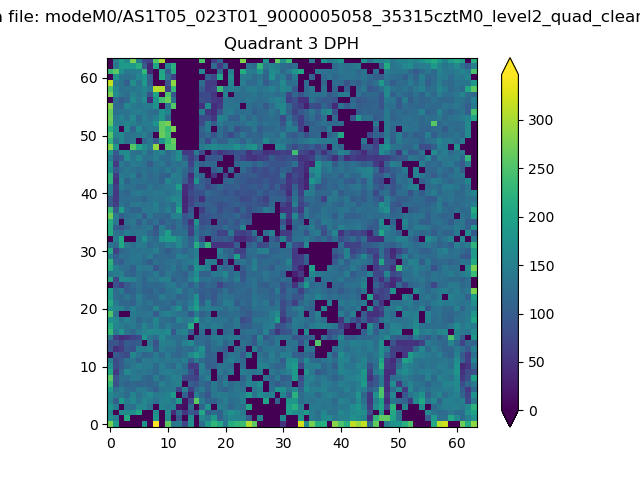 |
 |
Quadrant C |
| Plot type | Count rate plots | Images |
|---|---|---|
| Comparison with Poisson distribution Blue bars denote a histogram of data divided into 1 sec bins. Red curve is a Poisson curve with rate = median count rate of data. |
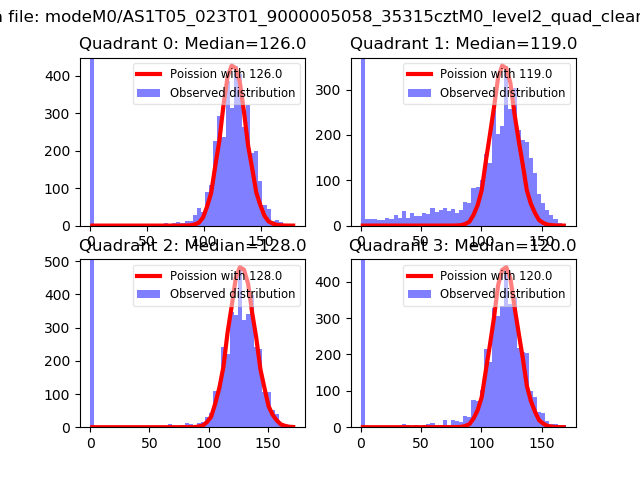 |
 |
| Quadrant-wise count rates Data is divided into 100 sec bins |
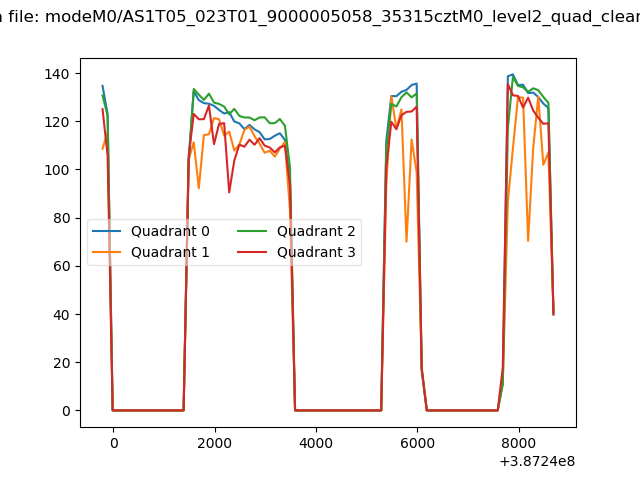 |
|
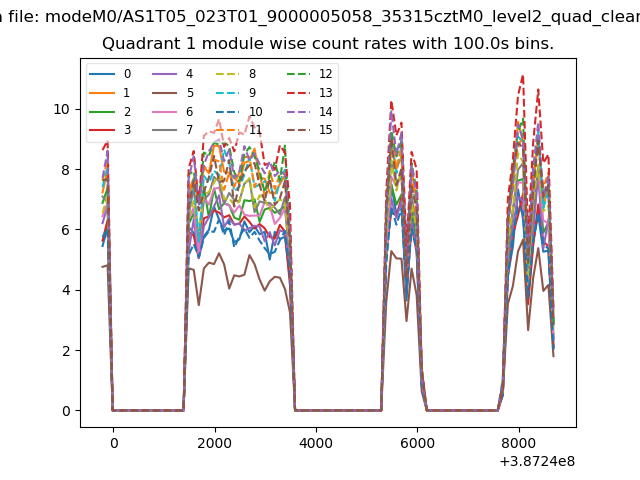
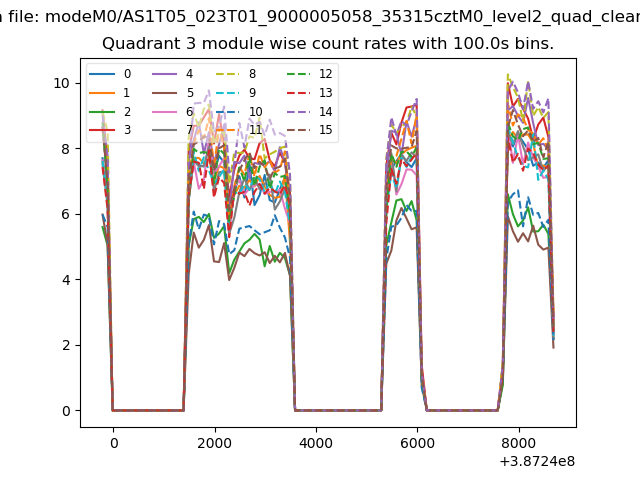
| Module-wise count rates for Quadrant A Data is divided into 100 sec bins |
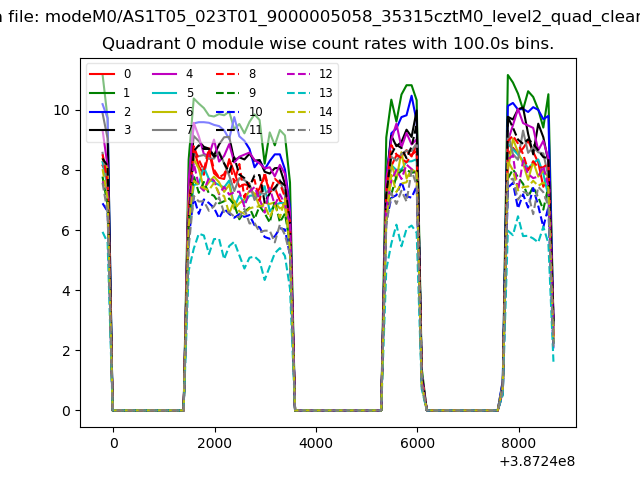 |
 |
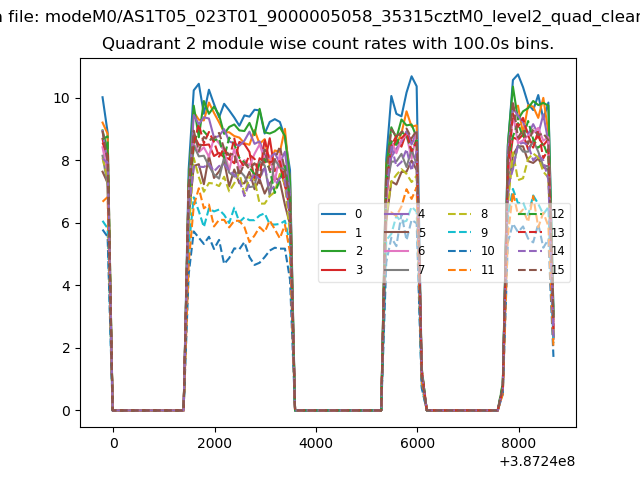
| Module-wise count rates for Quadrant B Data is divided into 100 sec bins |
 |
 |
| Module-wise count rates for Quadrant C Data is divided into 100 sec bins |
 |
 |
| Module-wise count rates for Quadrant D Data is divided into 100 sec bins |
 |
 |
| Parameter | Plot |
|---|---|
| CZT HV Monitor | 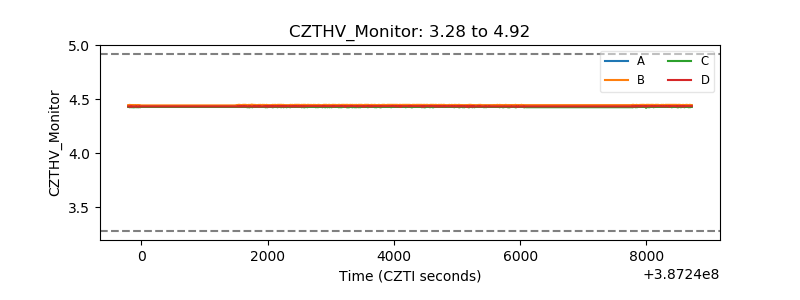 |
| D_VDD | 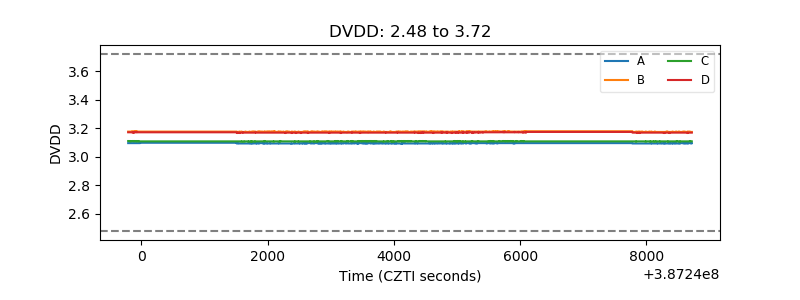 |
| Temperature 1 | 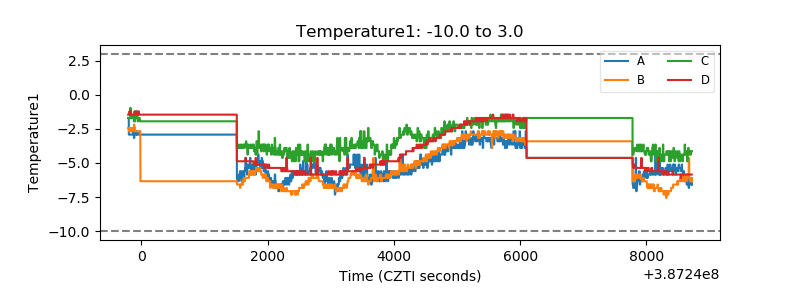 |
| Veto HV Monitor | 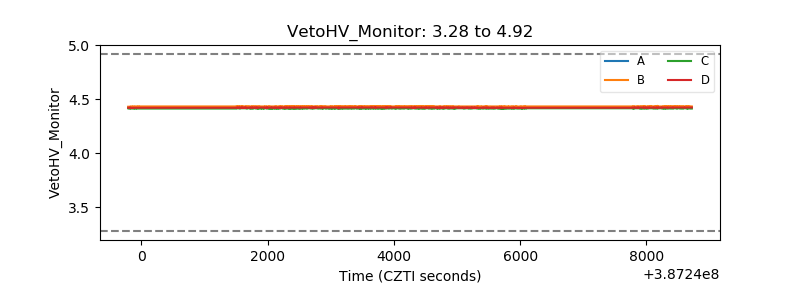 |
| Veto LLD | 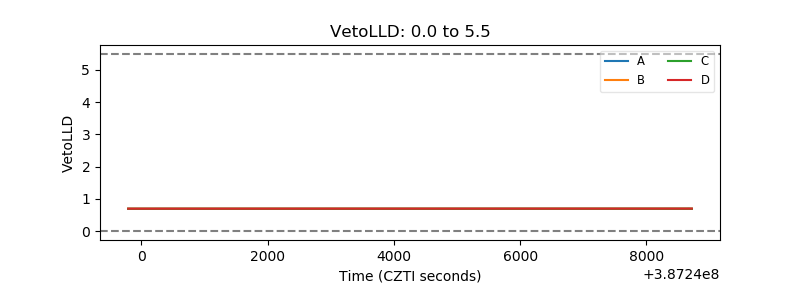 |
| Alpha Counter | 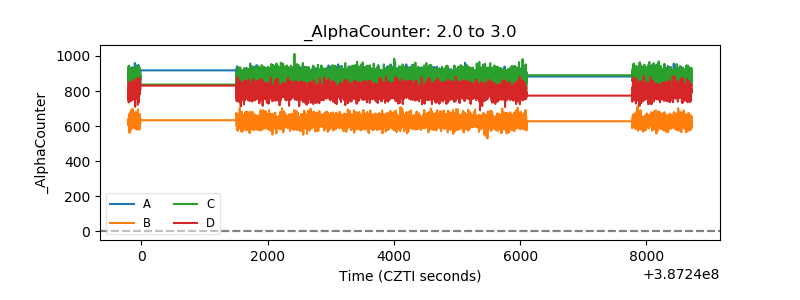 |
| _CPM_Rate | 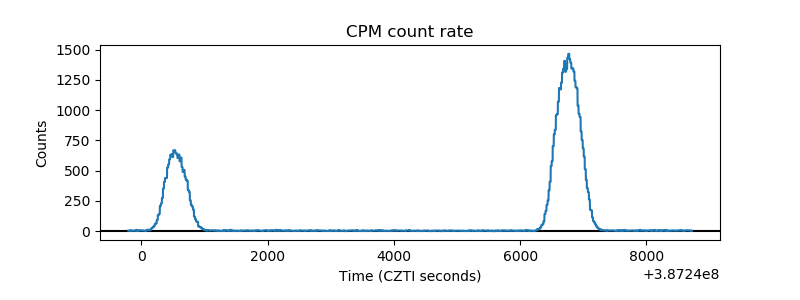 |
| CZT Counter | 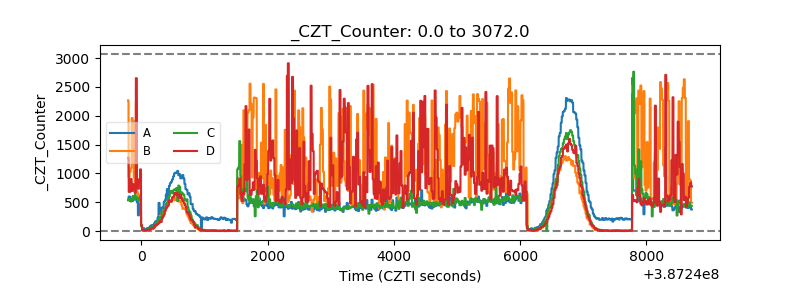 |
| +2.5 Volts monitor | 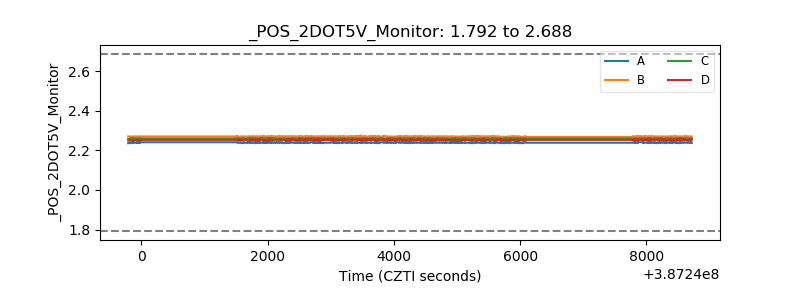 |
| +5 Volts monitor | 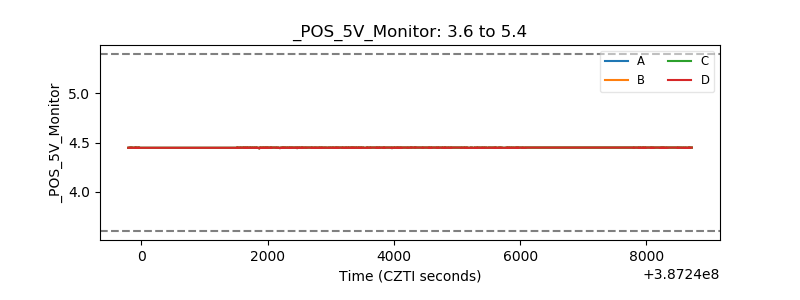 |
| _ROLL_ROT |  |
| _Roll_DEC | 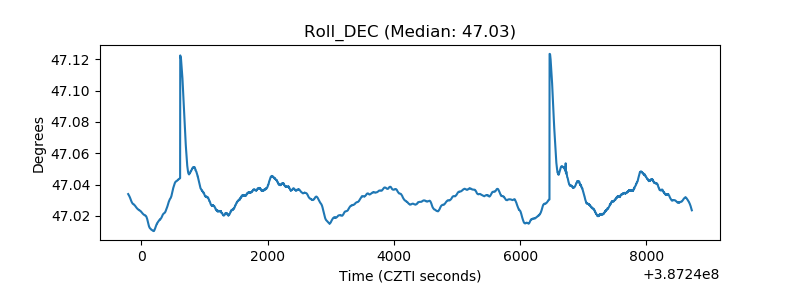 |
| _Roll_RA | 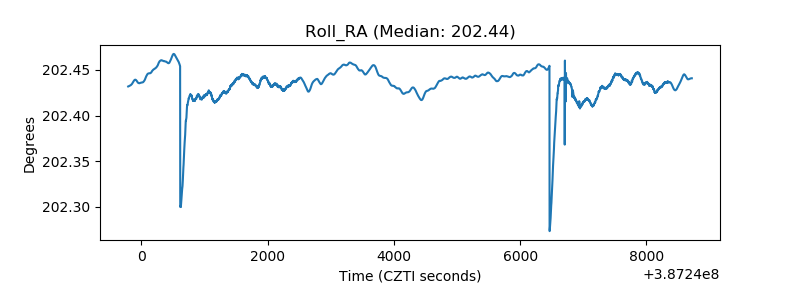 |
| Veto Counter | 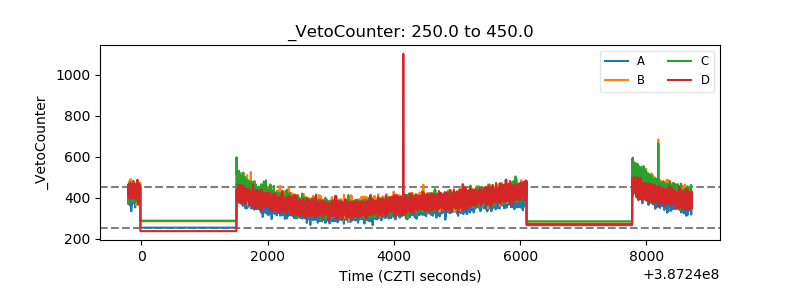 |