| Param | Original file | Final file |
|---|---|---|
| Filename | modeM0/AS1T05_023T01_9000005058_35314cztM0_level2.evt | modeM0/AS1T05_023T01_9000005058_35314cztM0_level2_quad_clean.evt |
| Size (bytes) | 1,636,640,640 | 192,170,880 |
| Size | 1.5 GB | 183.3 MB |
| Events in quadrant A | 8,010,058 | 1,239,682 |
| Events in quadrant B | 19,063,473 | 1,086,408 |
| Events in quadrant C | 9,228,913 | 1,246,489 |
| Events in quadrant D | 12,209,626 | 1,165,492 |
| Mode M0 | |||
|---|---|---|---|
| Quadrant | BADHDUFLAG | Total packets | Discarded packets |
| A | 0 | 34319 | 5 |
| B | 0 | 67512 | 4 |
| C | 0 | 37545 | 4 |
| D | 0 | 46874 | 4 |
| Mode M9 | |||
|---|---|---|---|
| Quadrant | BADHDUFLAG | Total packets | Discarded packets |
| A | 0 | 55 | 0 |
| B | 0 | 55 | 0 |
| C | 0 | 55 | 0 |
| D | 0 | 55 | 0 |
| Mode SS | |||
|---|---|---|---|
| Quadrant | BADHDUFLAG | Total packets | Discarded packets |
| A | 0 | 322 | 0 |
| B | 0 | 322 | 0 |
| C | 0 | 322 | 0 |
| D | 0 | 322 | 0 |
| Quadrant | Total seconds | Saturated seconds | Saturation percentage |
|---|---|---|---|
| A | 15661 | 87 | 0.555520% |
| B | 15661 | 4091 | 26.122214% |
| C | 15661 | 208 | 1.328140% |
| D | 15661 | 866 | 5.529660% |
Noise dominated data is calculated using 1-second bins in cleaned event files. If a bin has >2000 counts, and if more than 50% of those come from <1% of pixels, then it is considered to be noise-dominated and hence unusable.
| Quadrant | # 1 sec bins | Bins with >0 counts | Bins with >2000 counts | High rate bins dominated by noise | Noise dominated (total time) | Noise dominated (detector-on time) | Marked lightcurve |
|---|---|---|---|---|---|---|---|
| A | 21184 | 15665 | 43 | 43 | 0.20% | 0.27% | 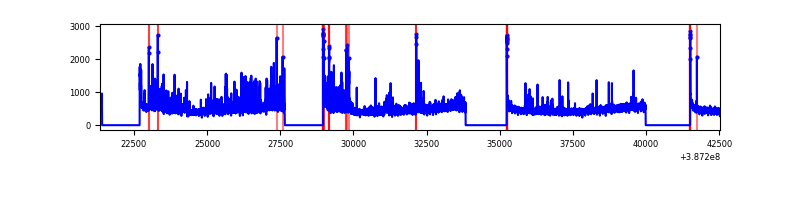 |
| B | 21184 | 15665 | 3091 | 3091 | 14.59% | 19.73% | 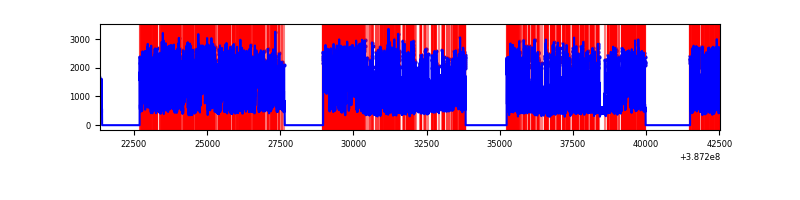 |
| C | 21184 | 15665 | 172 | 172 | 0.81% | 1.10% | 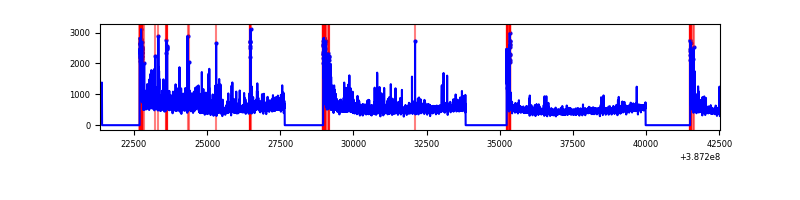 |
| D | 21184 | 15665 | 826 | 826 | 3.90% | 5.27% | 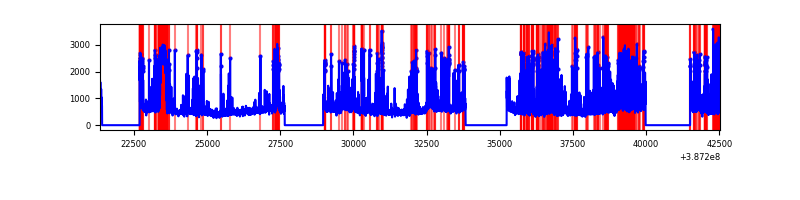 |
Top three noisy pixels from each quadrant. If the there are fewer than three noisy pixels in the level2.evt file, extra rows are filled as -1
| Pixel properties | Quadrant properties | ||||||
|---|---|---|---|---|---|---|---|
| Quadrant | DetID | PixID | Counts | Sigma | Mean | Median | Sigma |
| A | 15 | 169 | 799869 | 2258.36 | 1764 | 1730 | 353.4 |
| A | 10 | 83 | 220466 | 618.92 | 1764 | 1730 | 353.4 |
| A | 9 | 143 | 59259 | 162.78 | 1764 | 1730 | 353.4 |
| B | 5 | 236 | 8469313 | 27927.89 | 1580 | 1530 | 303.2 |
| B | 5 | 172 | 4230168 | 13946.62 | 1580 | 1530 | 303.2 |
| B | 4 | 232 | 77935 | 251.99 | 1580 | 1530 | 303.2 |
| C | 0 | 10 | 851193 | 2150.76 | 1720 | 1735 | 395.0 |
| C | 15 | 214 | 640253 | 1616.68 | 1720 | 1735 | 395.0 |
| C | 4 | 254 | 507711 | 1281.09 | 1720 | 1735 | 395.0 |
| D | 8 | 195 | 1584491 | 3908.21 | 1684 | 1641 | 405.0 |
| D | 2 | 249 | 1073936 | 2647.6 | 1684 | 1641 | 405.0 |
| D | 12 | 235 | 911409 | 2246.3 | 1684 | 1641 | 405.0 |
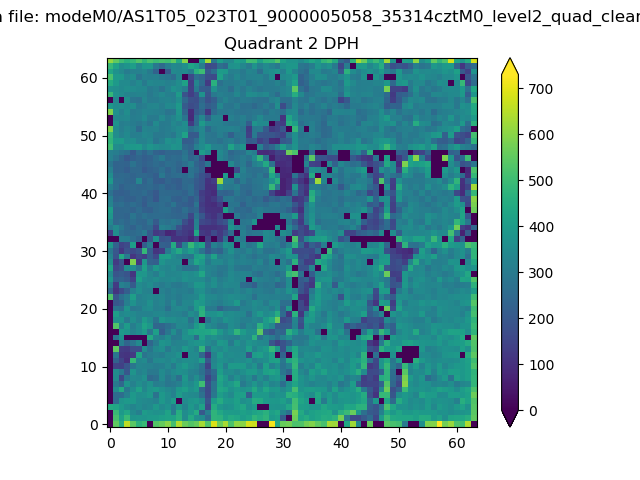
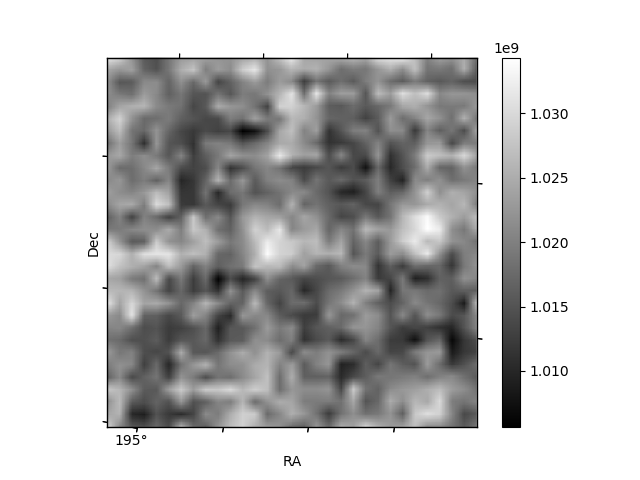
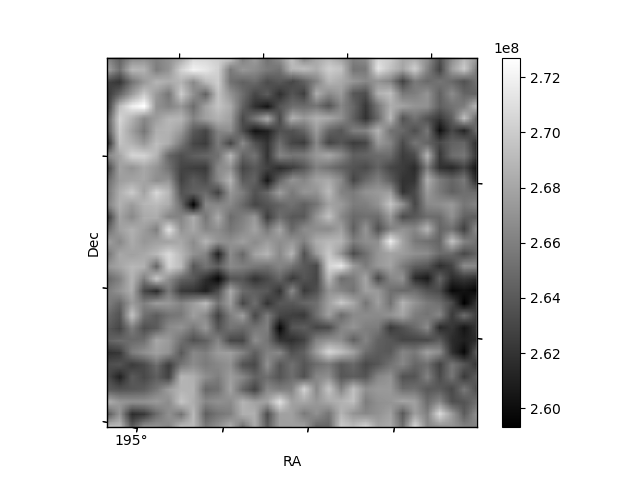
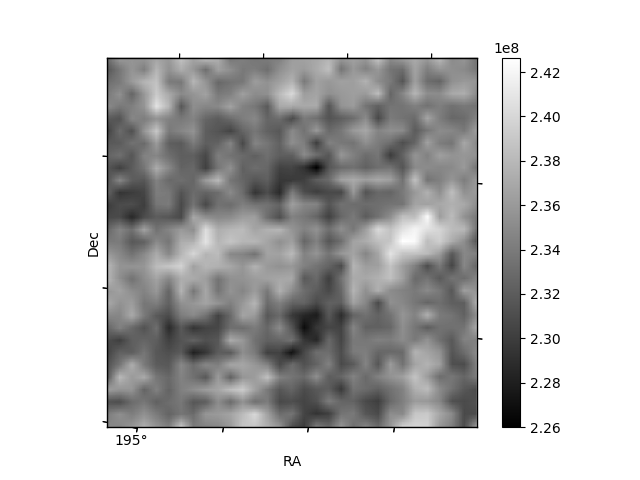
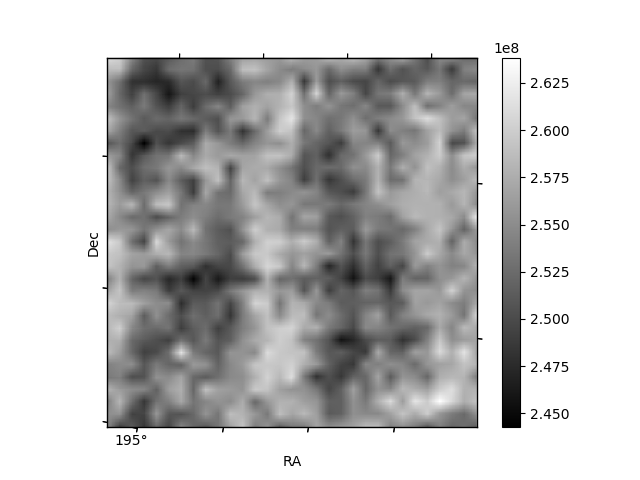
Histogram calculated using DETX and DETY for each event in the final _common_clean file
| Quadrant A | 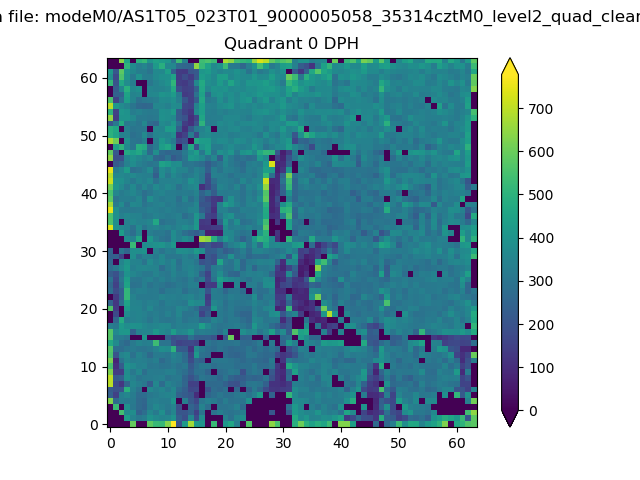 |
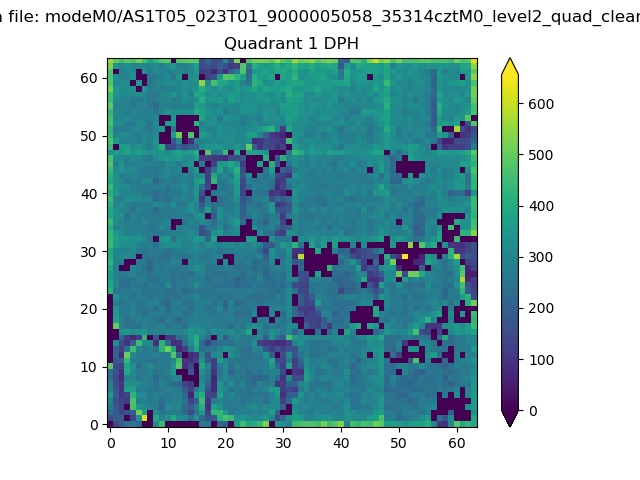 |
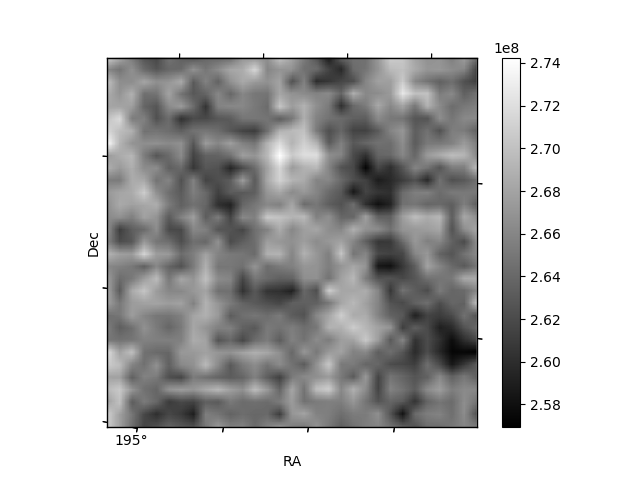
Quadrant B |
|---|---|---|---|
| Quadrant D | 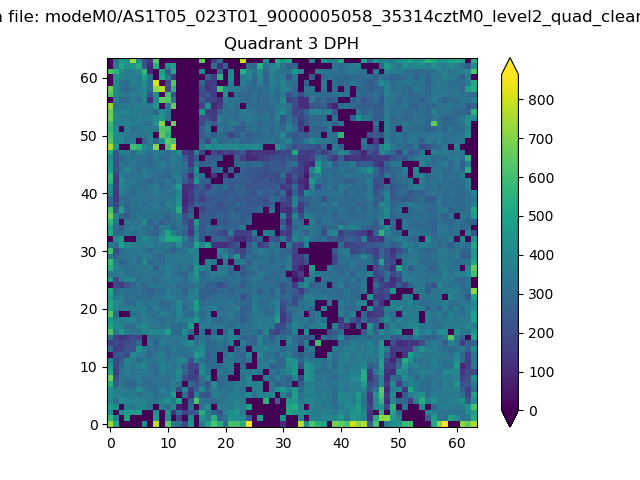 |
 |
Quadrant C |
| Plot type | Count rate plots | Images |
|---|---|---|
| Comparison with Poisson distribution Blue bars denote a histogram of data divided into 1 sec bins. Red curve is a Poisson curve with rate = median count rate of data. |
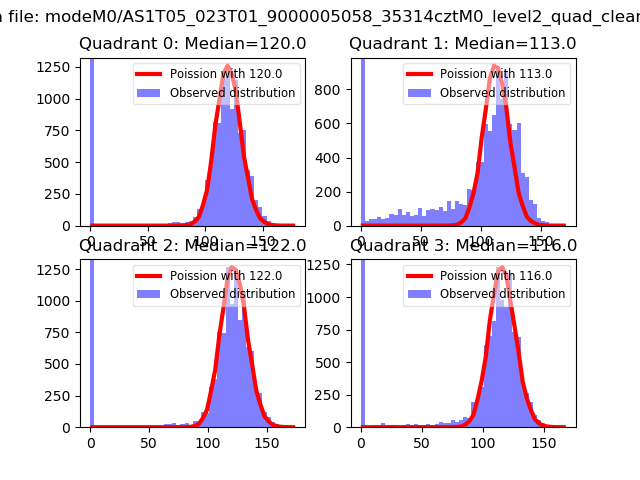 |
 |
| Quadrant-wise count rates Data is divided into 100 sec bins |
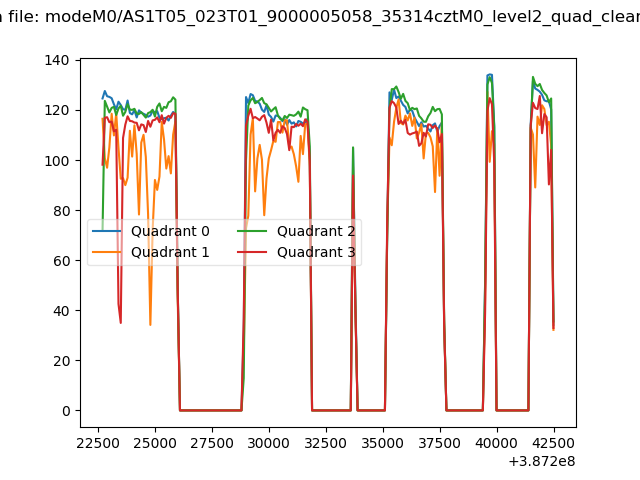 |
|
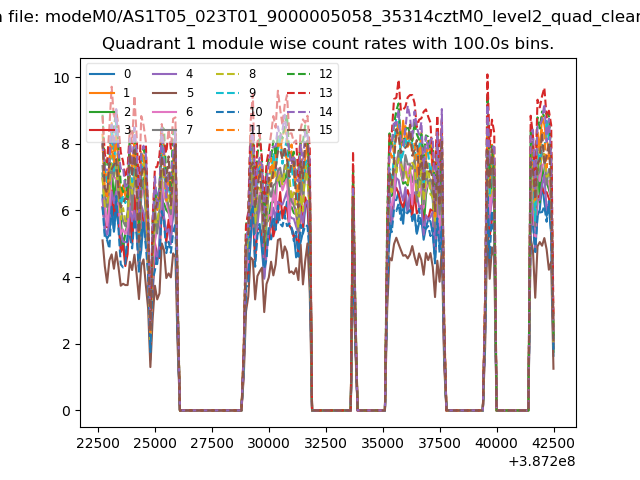
| Module-wise count rates for Quadrant A Data is divided into 100 sec bins |
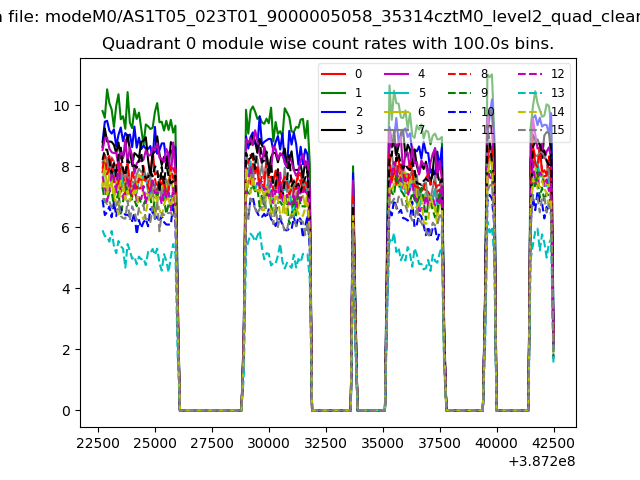 |
 |
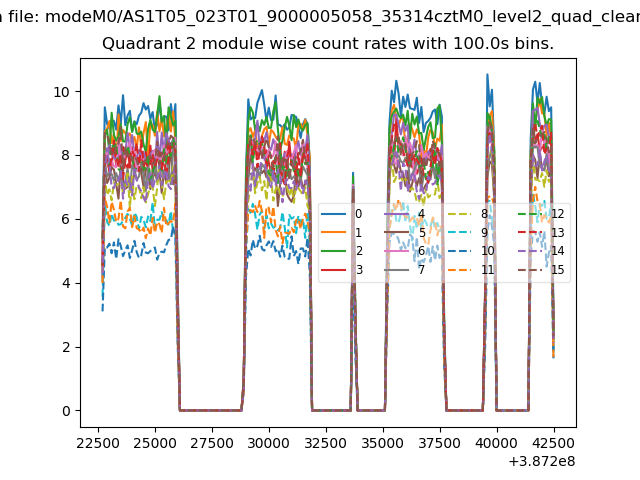
| Module-wise count rates for Quadrant B Data is divided into 100 sec bins |
 |
 |
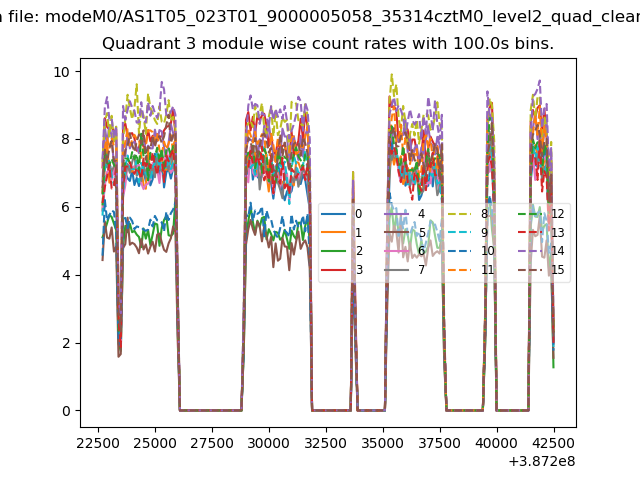
| Module-wise count rates for Quadrant C Data is divided into 100 sec bins |
 |
 |
| Module-wise count rates for Quadrant D Data is divided into 100 sec bins |
 |
 |
| Parameter | Plot |
|---|---|
| CZT HV Monitor | 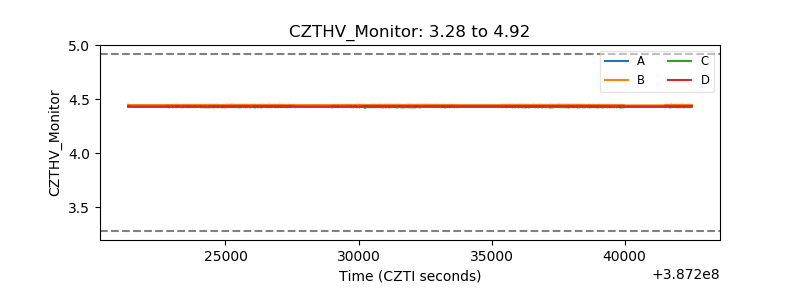 |
| D_VDD | 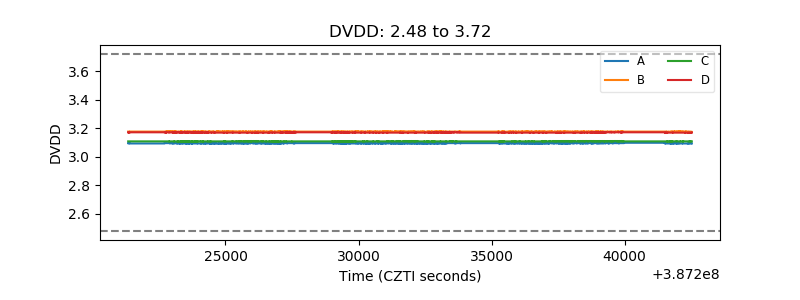 |
| Temperature 1 | 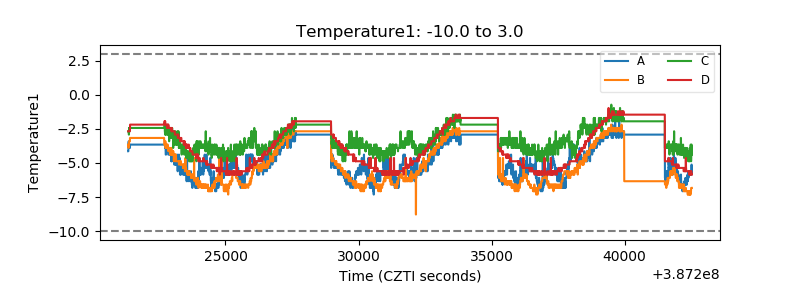 |
| Veto HV Monitor | 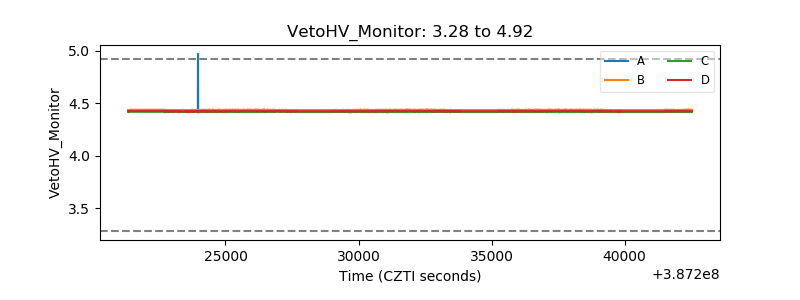 |
| Veto LLD | 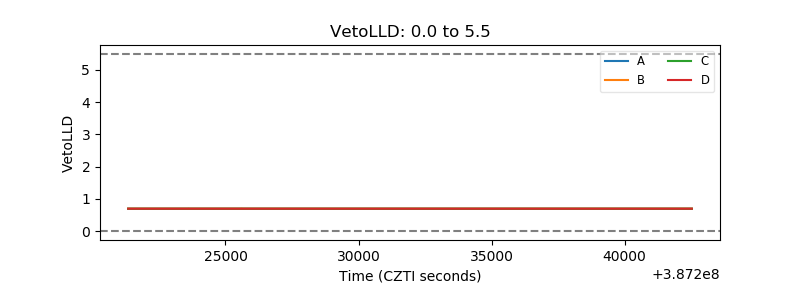 |
| Alpha Counter | 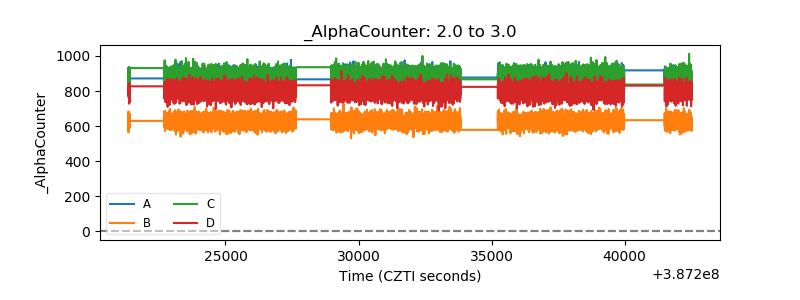 |
| _CPM_Rate | 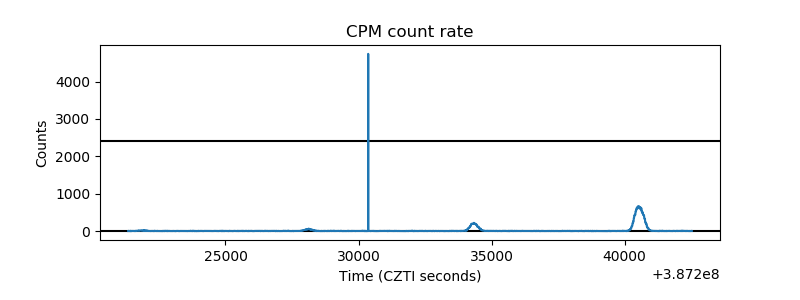 |
| CZT Counter | 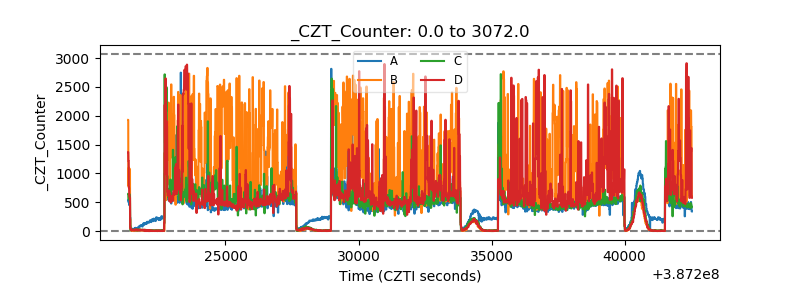 |
| +2.5 Volts monitor | 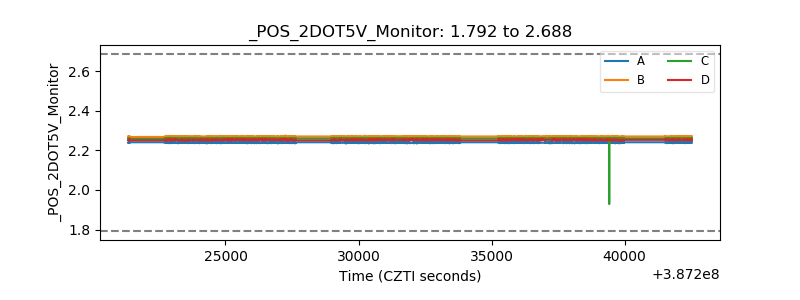 |
| +5 Volts monitor | 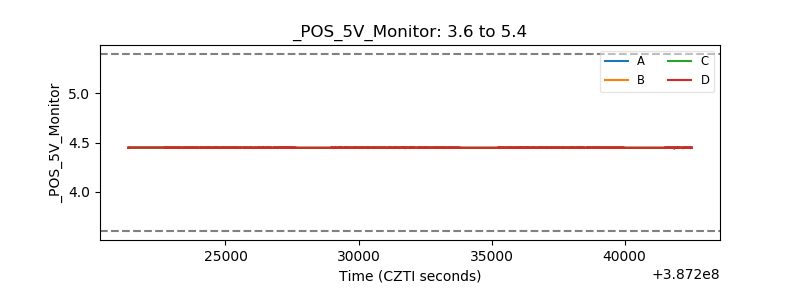 |
| _ROLL_ROT | 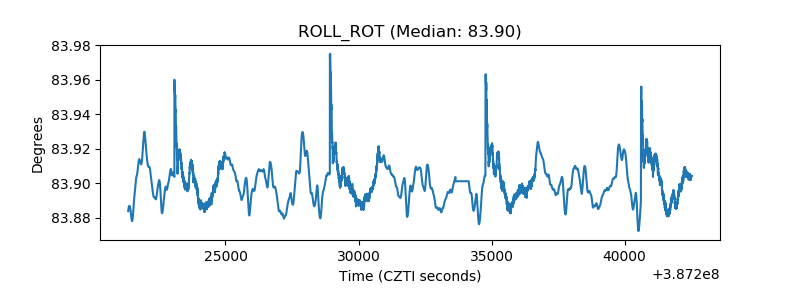 |
| _Roll_DEC | 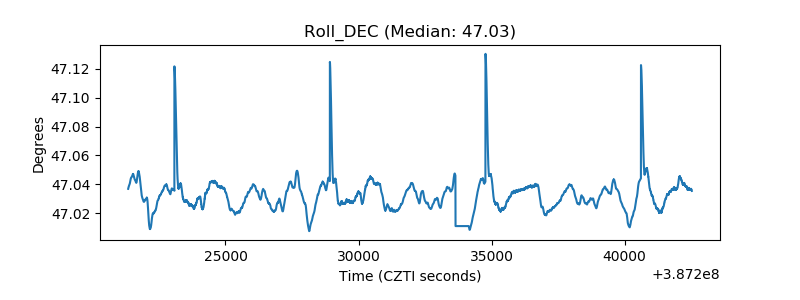 |
| _Roll_RA | 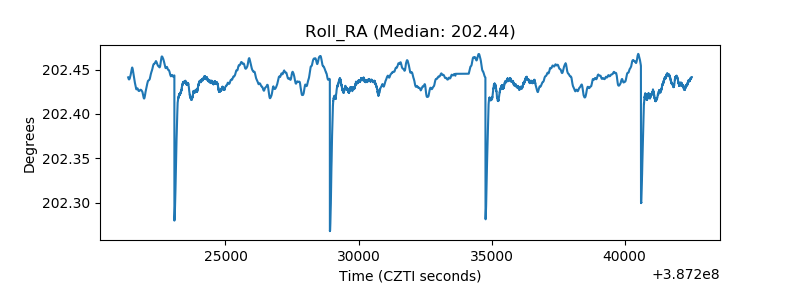 |
| Veto Counter | 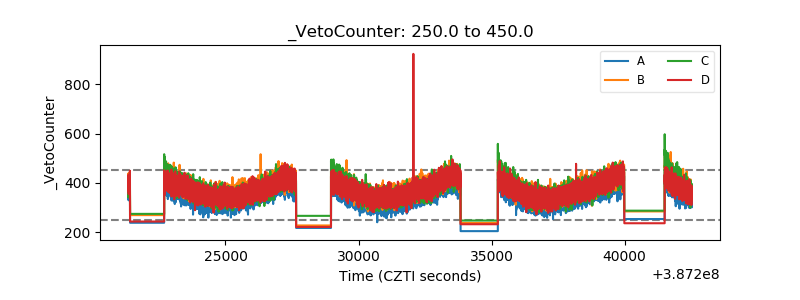 |