| Param | Original file | Final file |
|---|---|---|
| Filename | modeM0/AS1T05_023T01_9000005058_35311cztM0_level2.evt | modeM0/AS1T05_023T01_9000005058_35311cztM0_level2_quad_clean.evt |
| Size (bytes) | 656,078,400 | 85,944,960 |
| Size | 625.7 MB | 82.0 MB |
| Events in quadrant A | 3,362,970 | 581,904 |
| Events in quadrant B | 7,305,183 | 490,666 |
| Events in quadrant C | 4,213,638 | 565,478 |
| Events in quadrant D | 4,572,830 | 535,662 |
| Mode M0 | |||
|---|---|---|---|
| Quadrant | BADHDUFLAG | Total packets | Discarded packets |
| A | 0 | 14037 | 3 |
| B | 0 | 25926 | 2 |
| C | 0 | 16502 | 2 |
| D | 0 | 17648 | 2 |
| Mode M9 | |||
|---|---|---|---|
| Quadrant | BADHDUFLAG | Total packets | Discarded packets |
| A | 0 | 27 | 0 |
| B | 0 | 27 | 0 |
| C | 0 | 27 | 0 |
| D | 0 | 27 | 0 |
| Mode SS | |||
|---|---|---|---|
| Quadrant | BADHDUFLAG | Total packets | Discarded packets |
| A | 0 | 126 | 0 |
| B | 0 | 126 | 0 |
| C | 0 | 126 | 0 |
| D | 0 | 126 | 0 |
| Quadrant | Total seconds | Saturated seconds | Saturation percentage |
|---|---|---|---|
| A | 6133 | 24 | 0.391326% |
| B | 6133 | 1700 | 27.718898% |
| C | 6133 | 219 | 3.570846% |
| D | 6133 | 323 | 5.266591% |
Noise dominated data is calculated using 1-second bins in cleaned event files. If a bin has >2000 counts, and if more than 50% of those come from <1% of pixels, then it is considered to be noise-dominated and hence unusable.
| Quadrant | # 1 sec bins | Bins with >0 counts | Bins with >2000 counts | High rate bins dominated by noise | Noise dominated (total time) | Noise dominated (detector-on time) | Marked lightcurve |
|---|---|---|---|---|---|---|---|
| A | 8760 | 6135 | 6 | 6 | 0.07% | 0.10% | 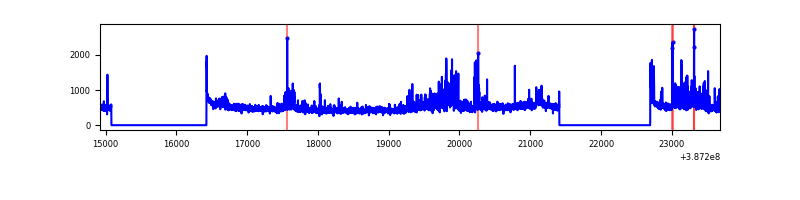 |
| B | 8760 | 6135 | 1310 | 1310 | 14.95% | 21.35% | 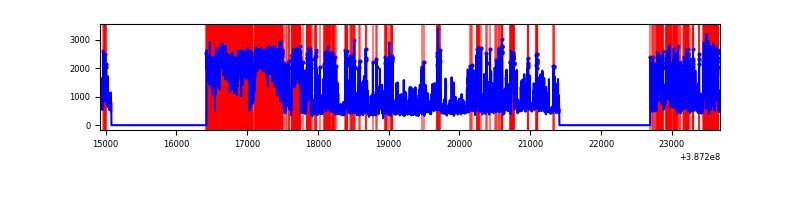 |
| C | 8760 | 6135 | 204 | 204 | 2.33% | 3.33% | 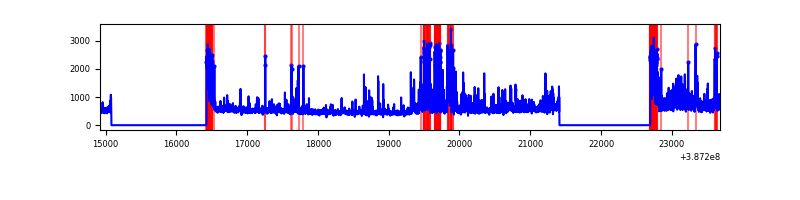 |
| D | 8760 | 6135 | 311 | 311 | 3.55% | 5.07% | 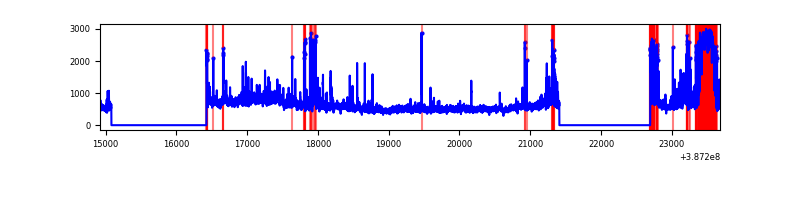 |
Top three noisy pixels from each quadrant. If the there are fewer than three noisy pixels in the level2.evt file, extra rows are filled as -1
| Pixel properties | Quadrant properties | ||||||
|---|---|---|---|---|---|---|---|
| Quadrant | DetID | PixID | Counts | Sigma | Mean | Median | Sigma |
| A | 15 | 169 | 499813 | 3548.67 | 702 | 688 | 140.7 |
| A | 10 | 83 | 104057 | 734.93 | 702 | 688 | 140.7 |
| A | 13 | 6 | 18947 | 129.82 | 702 | 688 | 140.7 |
| B | 5 | 236 | 2671482 | 22531.28 | 614 | 598 | 118.5 |
| B | 5 | 172 | 2138916 | 18038.61 | 614 | 598 | 118.5 |
| B | 5 | 200 | 63581 | 531.32 | 614 | 598 | 118.5 |
| C | 4 | 254 | 620056 | 3952.56 | 678 | 683 | 156.7 |
| C | 0 | 10 | 397539 | 2532.56 | 678 | 683 | 156.7 |
| C | 15 | 214 | 252500 | 1606.98 | 678 | 683 | 156.7 |
| D | 8 | 195 | 743529 | 4554.94 | 670 | 651 | 163.1 |
| D | 13 | 249 | 627585 | 3844.03 | 670 | 651 | 163.1 |
| D | 12 | 233 | 210204 | 1284.87 | 670 | 651 | 163.1 |
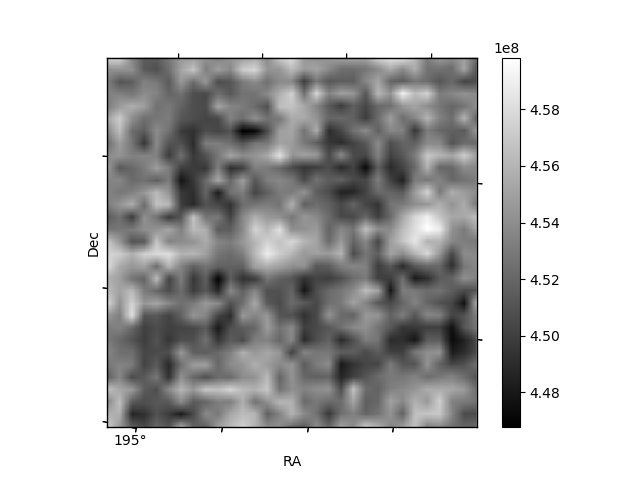
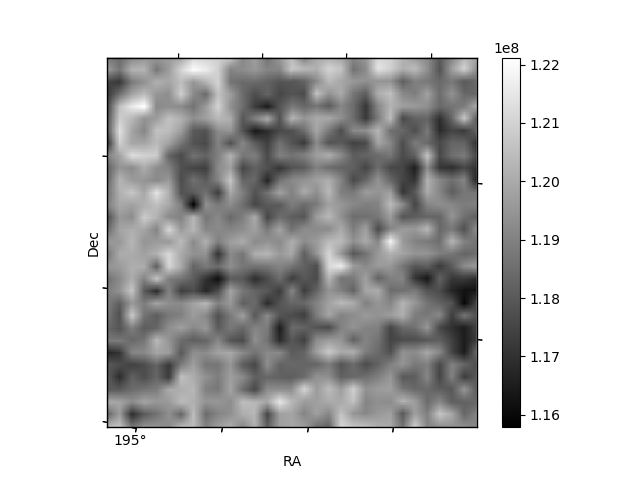
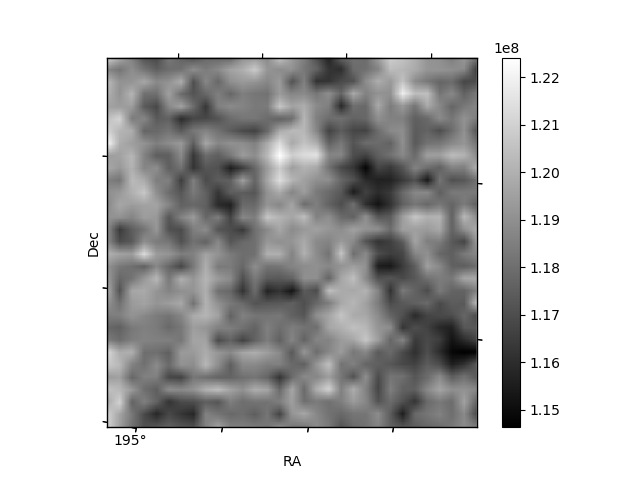
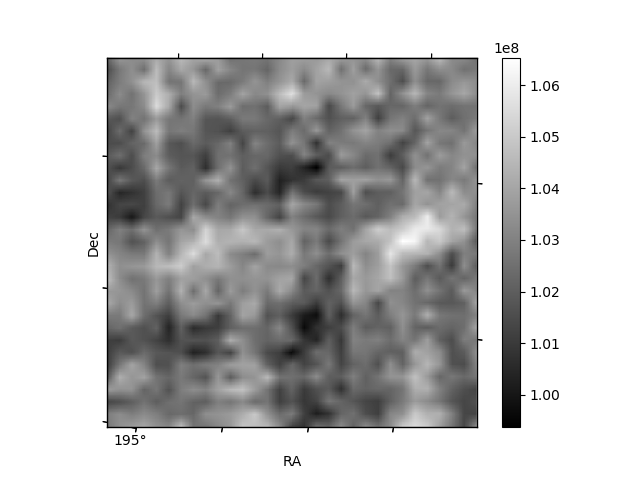
Histogram calculated using DETX and DETY for each event in the final _common_clean file
| Quadrant A | 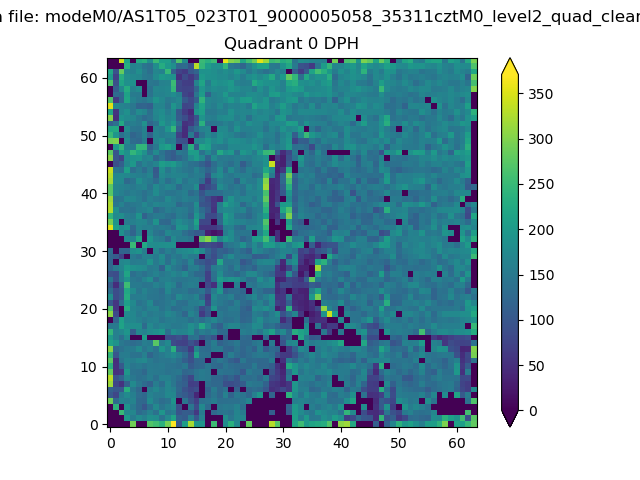 |
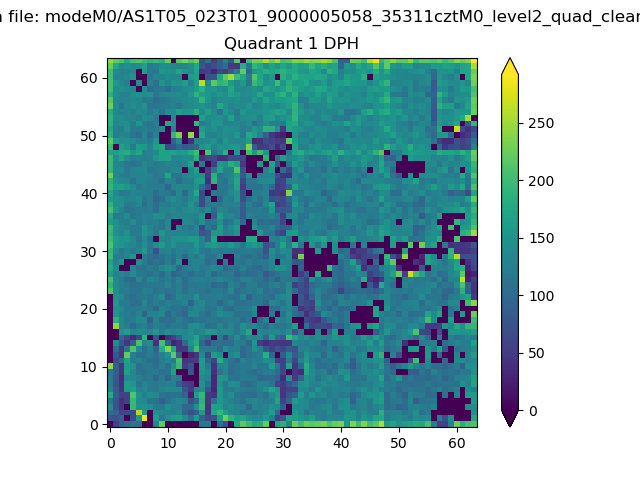 |
Quadrant B |
|---|---|---|---|
| Quadrant D | 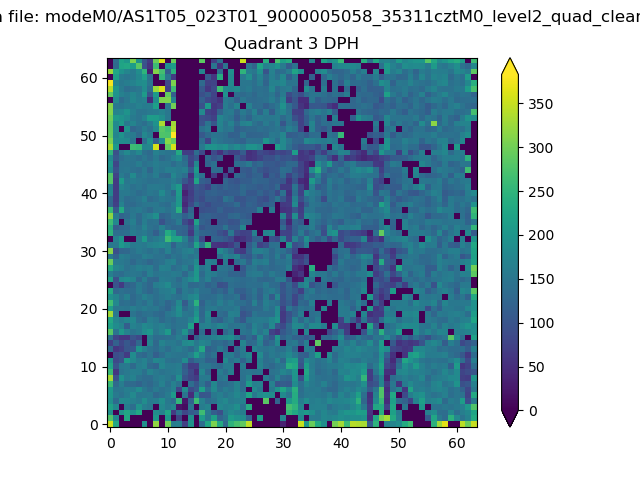 |
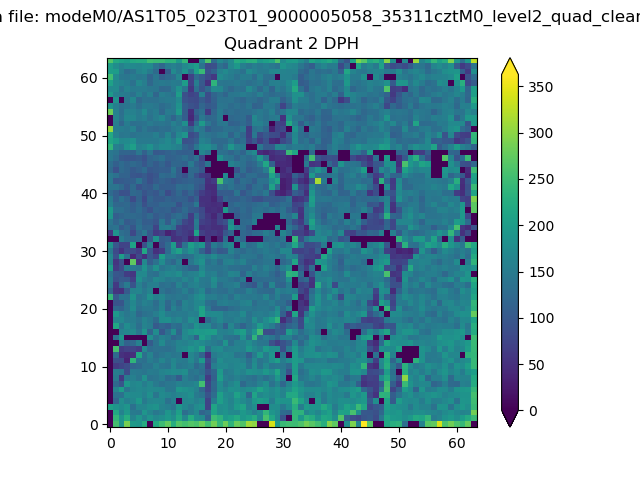 |
Quadrant C |
| Plot type | Count rate plots | Images |
|---|---|---|
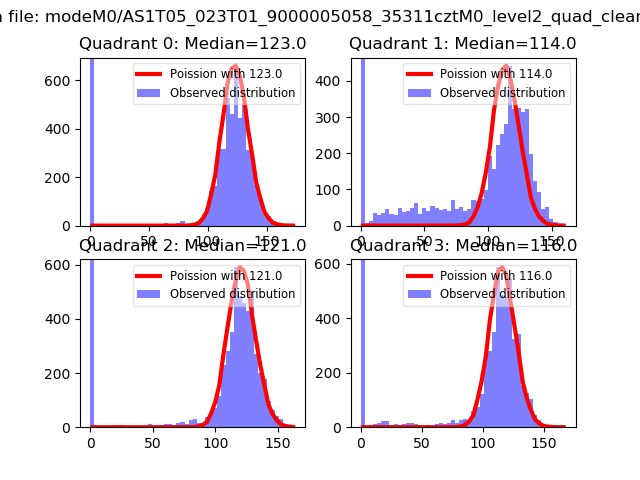
| Comparison with Poisson distribution Blue bars denote a histogram of data divided into 1 sec bins. Red curve is a Poisson curve with rate = median count rate of data. |
 |
 |
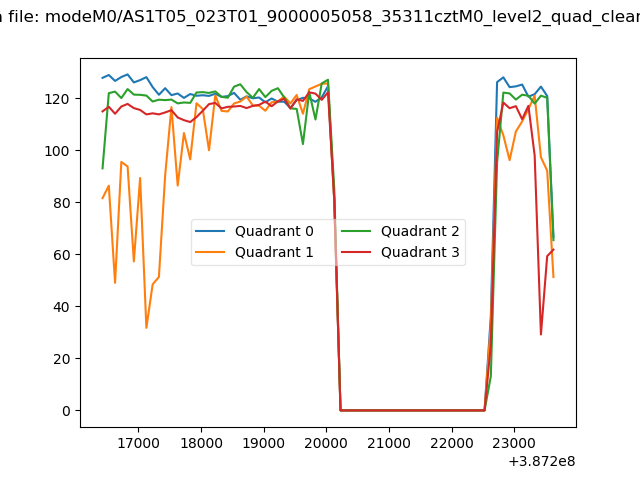
| Quadrant-wise count rates Data is divided into 100 sec bins |
 |
|
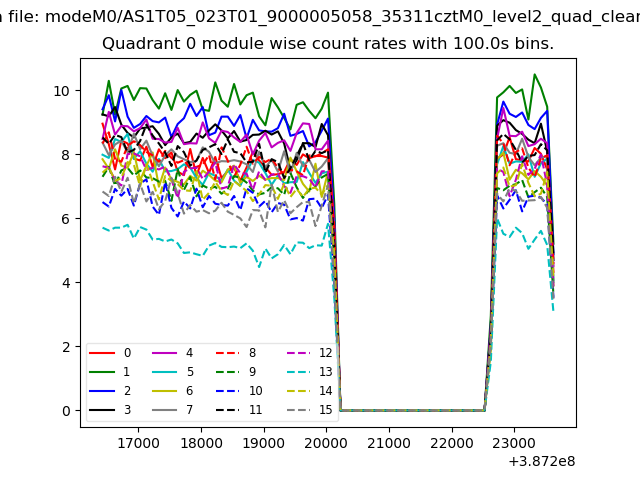
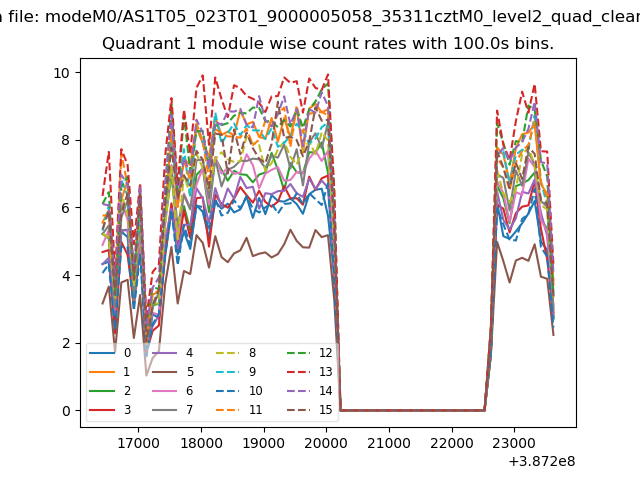
| Module-wise count rates for Quadrant A Data is divided into 100 sec bins |
 |
 |
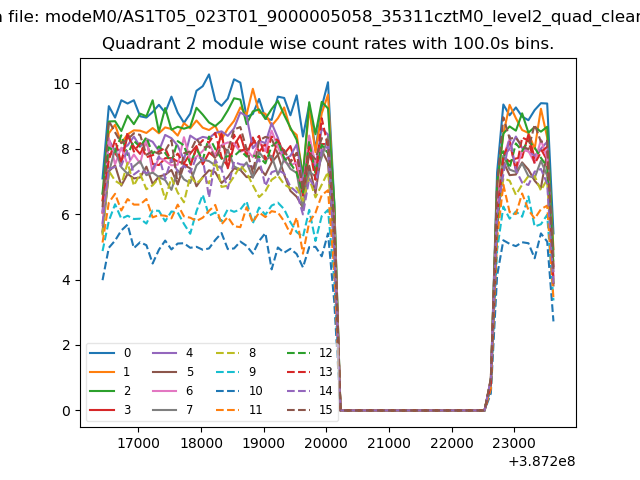
| Module-wise count rates for Quadrant B Data is divided into 100 sec bins |
 |
 |
| Module-wise count rates for Quadrant C Data is divided into 100 sec bins |
 |
 |
| Module-wise count rates for Quadrant D Data is divided into 100 sec bins |
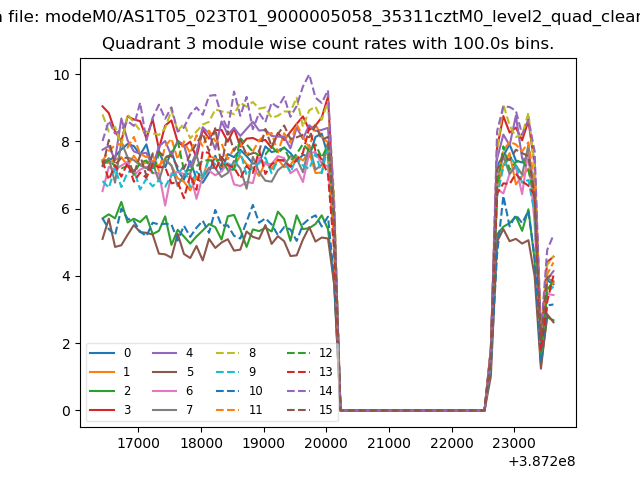 |
 |
| Parameter | Plot |
|---|---|
| CZT HV Monitor | 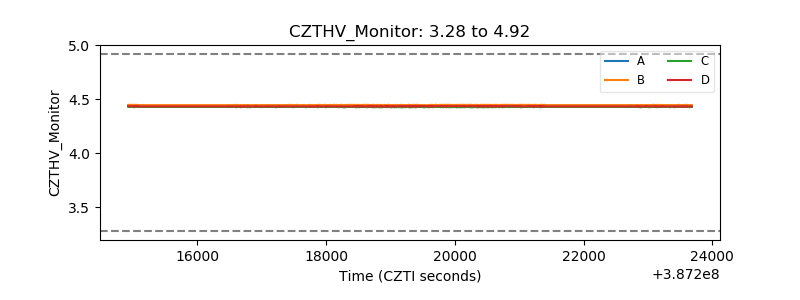 |
| D_VDD | 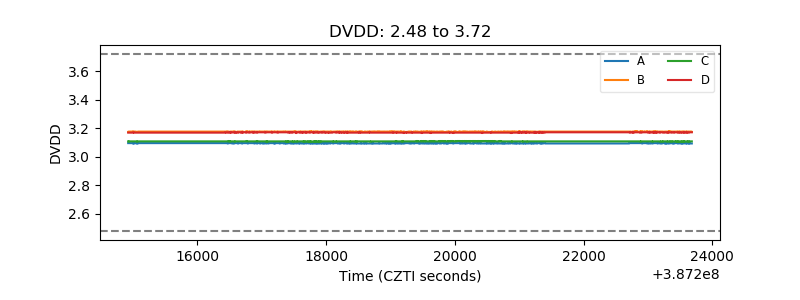 |
| Temperature 1 | 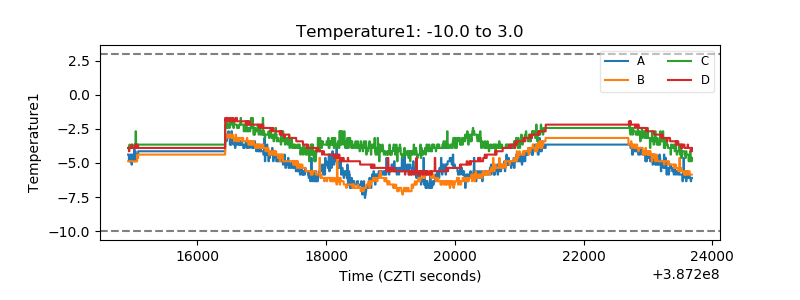 |
| Veto HV Monitor | 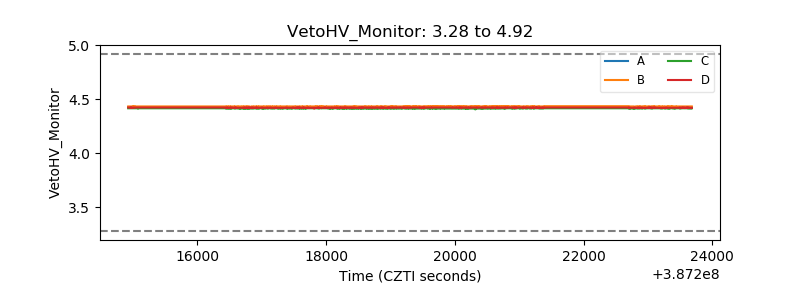 |
| Veto LLD | 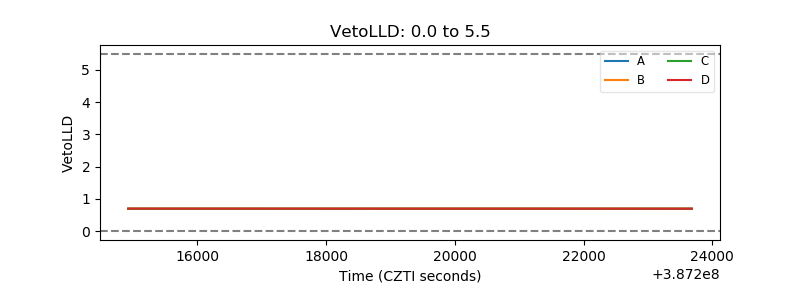 |
| Alpha Counter | 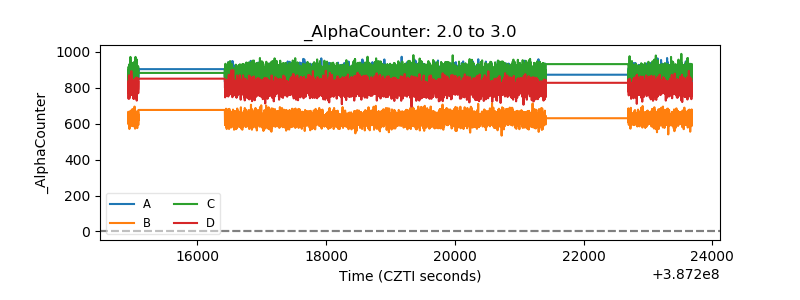 |
| _CPM_Rate | 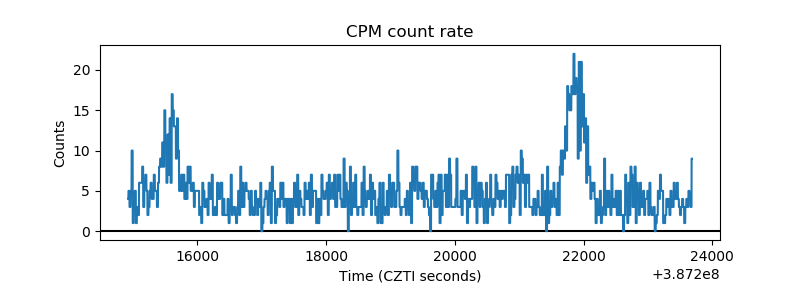 |
| CZT Counter | 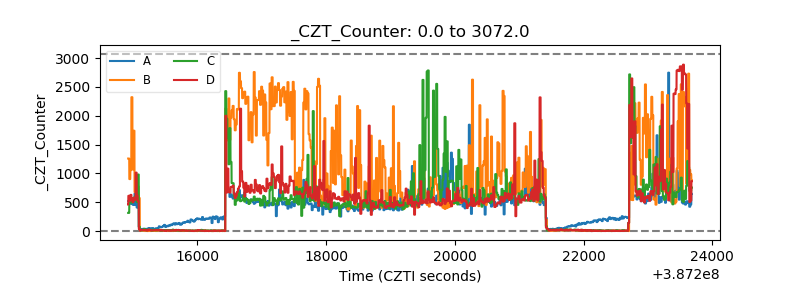 |
| +2.5 Volts monitor | 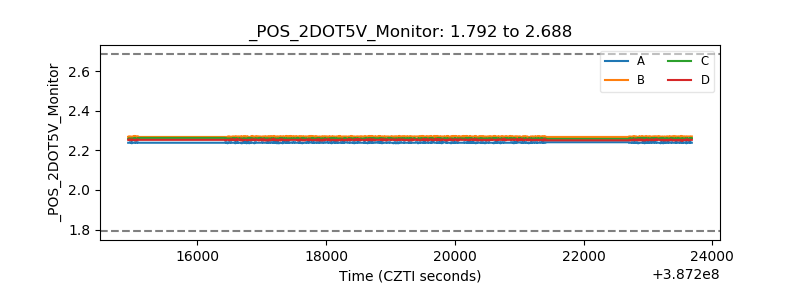 |
| +5 Volts monitor | 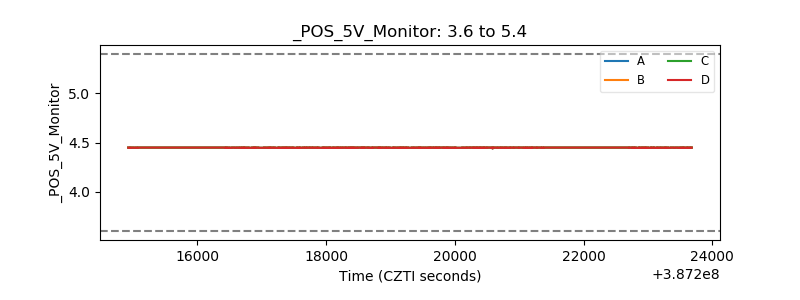 |
| _ROLL_ROT | 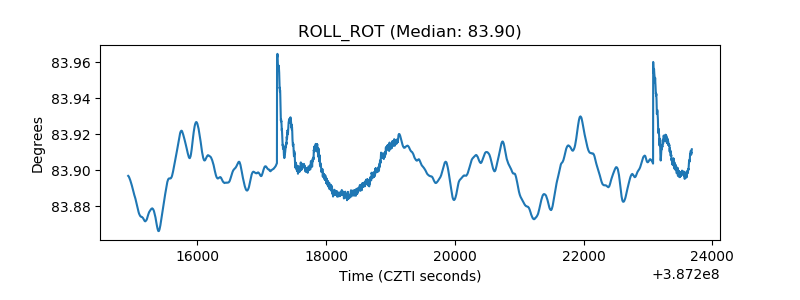 |
| _Roll_DEC | 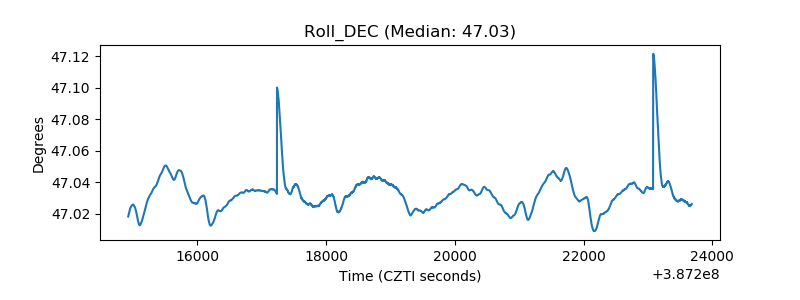 |
| _Roll_RA | 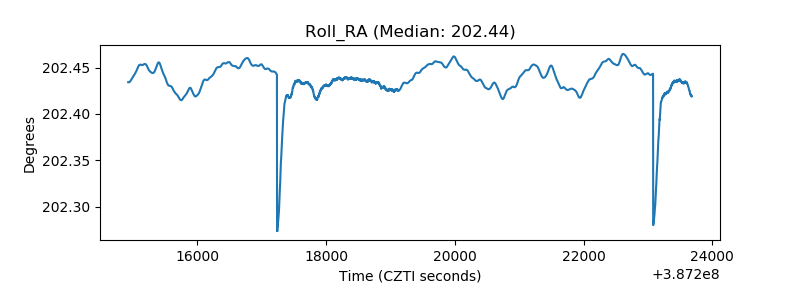 |
| Veto Counter | 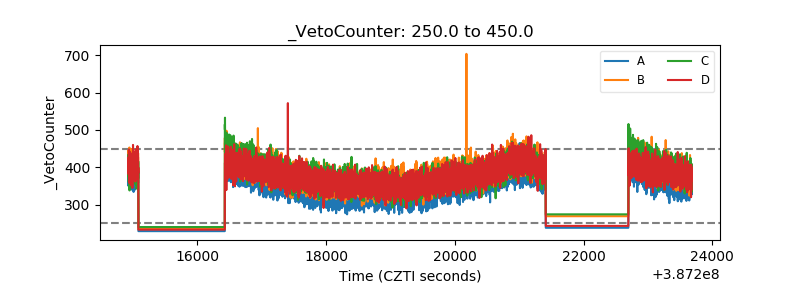 |