| Param | Original file | Final file |
|---|---|---|
| Filename | modeM0/AS1T05_023T01_9000005058_35310cztM0_level2.evt | modeM0/AS1T05_023T01_9000005058_35310cztM0_level2_quad_clean.evt |
| Size (bytes) | 681,635,520 | 87,880,320 |
| Size | 650.1 MB | 83.8 MB |
| Events in quadrant A | 3,556,709 | 616,838 |
| Events in quadrant B | 8,553,851 | 499,226 |
| Events in quadrant C | 3,386,756 | 611,436 |
| Events in quadrant D | 4,747,386 | 520,495 |
| Mode M0 | |||
|---|---|---|---|
| Quadrant | BADHDUFLAG | Total packets | Discarded packets |
| A | 0 | 14465 | 3 |
| B | 0 | 29480 | 2 |
| C | 0 | 13597 | 2 |
| D | 0 | 18121 | 2 |
| Mode M9 | |||
|---|---|---|---|
| Quadrant | BADHDUFLAG | Total packets | Discarded packets |
| A | 0 | 29 | 0 |
| B | 0 | 29 | 0 |
| C | 0 | 29 | 0 |
| D | 0 | 29 | 0 |
| Mode SS | |||
|---|---|---|---|
| Quadrant | BADHDUFLAG | Total packets | Discarded packets |
| A | 0 | 118 | 0 |
| B | 0 | 118 | 0 |
| C | 0 | 118 | 0 |
| D | 0 | 118 | 0 |
| Quadrant | Total seconds | Saturated seconds | Saturation percentage |
|---|---|---|---|
| A | 5903 | 16 | 0.271049% |
| B | 5903 | 2260 | 38.285617% |
| C | 5903 | 114 | 1.931221% |
| D | 5903 | 662 | 11.214637% |
Noise dominated data is calculated using 1-second bins in cleaned event files. If a bin has >2000 counts, and if more than 50% of those come from <1% of pixels, then it is considered to be noise-dominated and hence unusable.
| Quadrant | # 1 sec bins | Bins with >0 counts | Bins with >2000 counts | High rate bins dominated by noise | Noise dominated (total time) | Noise dominated (detector-on time) | Marked lightcurve |
|---|---|---|---|---|---|---|---|
| A | 7246 | 5904 | 1 | 1 | 0.01% | 0.02% | 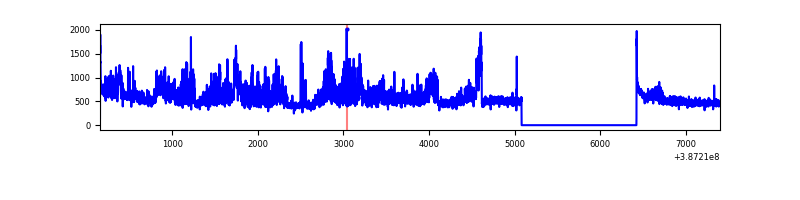 |
| B | 7245 | 5903 | 1748 | 1748 | 24.13% | 29.61% | 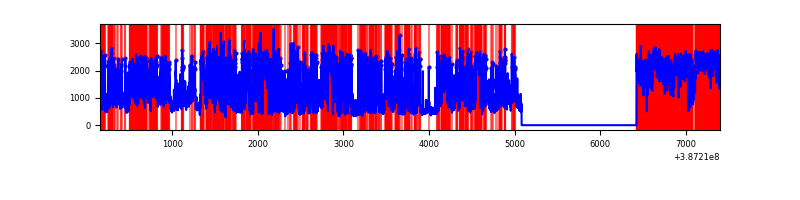 |
| C | 7246 | 5904 | 100 | 100 | 1.38% | 1.69% | 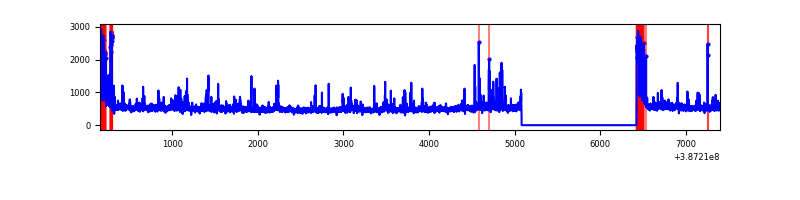 |
| D | 7246 | 5904 | 254 | 254 | 3.51% | 4.30% | 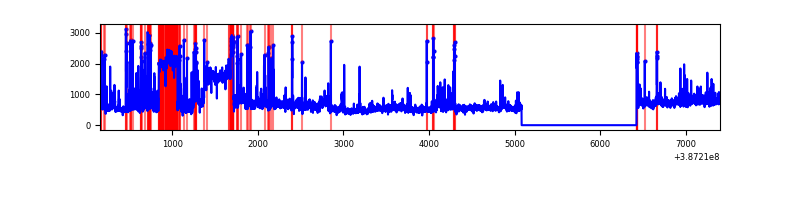 |
Top three noisy pixels from each quadrant. If the there are fewer than three noisy pixels in the level2.evt file, extra rows are filled as -1
| Pixel properties | Quadrant properties | ||||||
|---|---|---|---|---|---|---|---|
| Quadrant | DetID | PixID | Counts | Sigma | Mean | Median | Sigma |
| A | 15 | 169 | 785854 | 5744.09 | 676 | 662 | 136.7 |
| A | 10 | 83 | 103057 | 749.07 | 676 | 662 | 136.7 |
| A | 9 | 143 | 27254 | 194.53 | 676 | 662 | 136.7 |
| B | 5 | 236 | 4266091 | 39046.77 | 566 | 552 | 109.2 |
| B | 5 | 172 | 1987824 | 18191.5 | 566 | 552 | 109.2 |
| B | 5 | 200 | 67085 | 609.04 | 566 | 552 | 109.2 |
| C | 0 | 10 | 345955 | 2262.2 | 657 | 661 | 152.6 |
| C | 15 | 214 | 244414 | 1596.96 | 657 | 661 | 152.6 |
| C | 3 | 233 | 187288 | 1222.69 | 657 | 661 | 152.6 |
| D | 10 | 203 | 1011846 | 6978.31 | 599 | 583 | 144.9 |
| D | 8 | 195 | 753857 | 5198.03 | 599 | 583 | 144.9 |
| D | 12 | 235 | 266447 | 1834.62 | 599 | 583 | 144.9 |
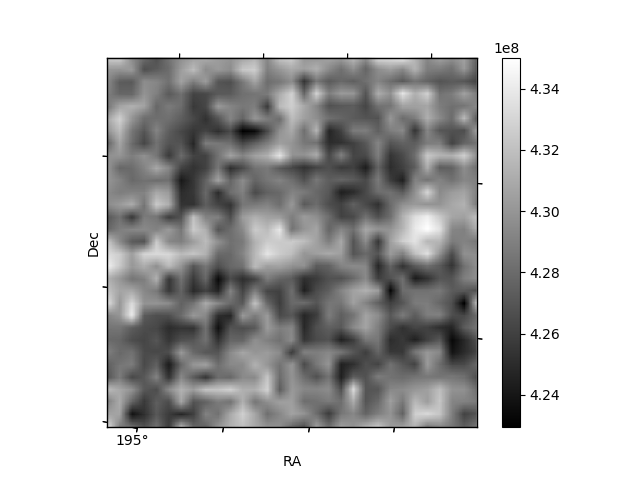
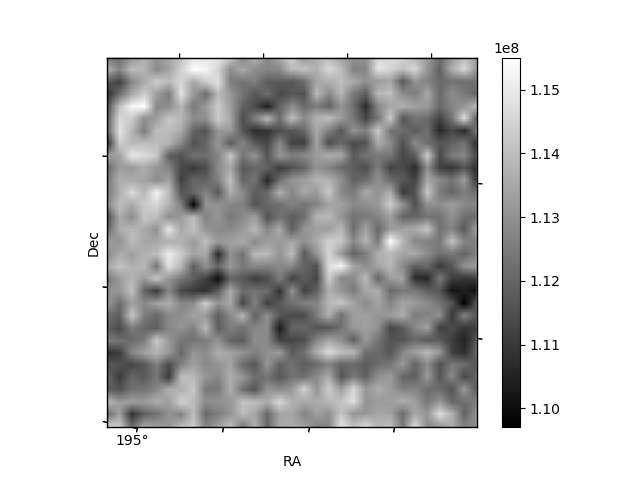
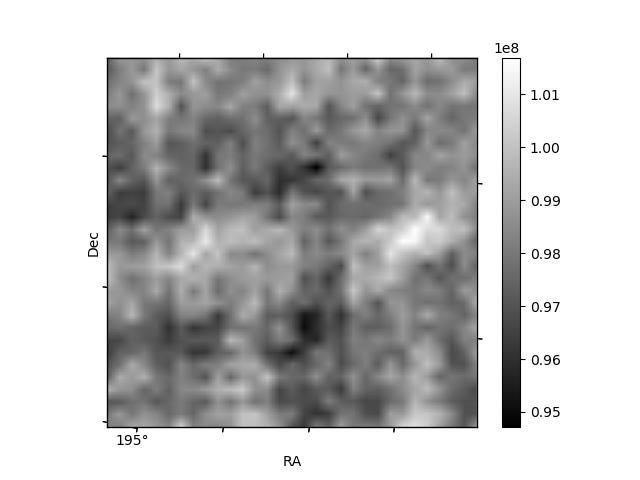
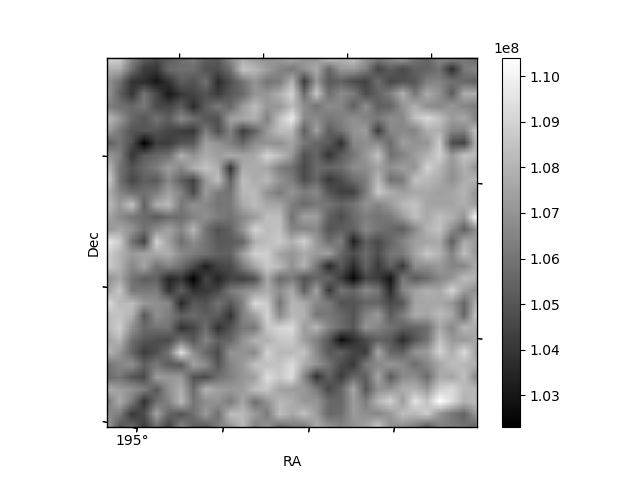
Histogram calculated using DETX and DETY for each event in the final _common_clean file
| Quadrant A | 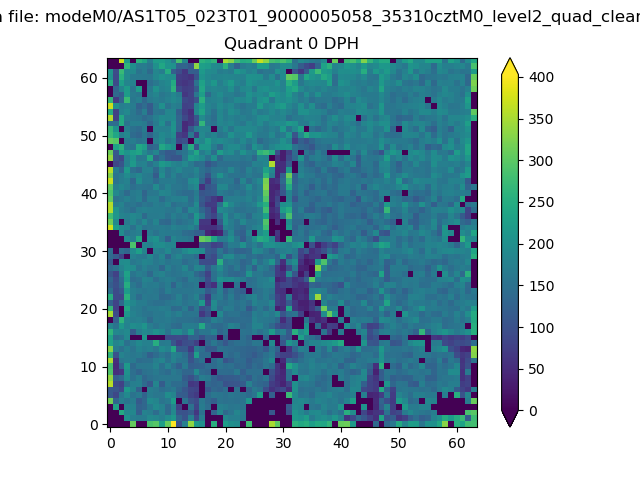 |
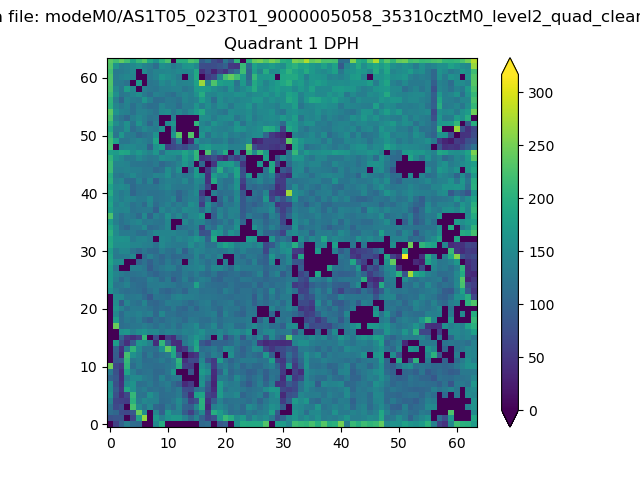 |
Quadrant B |
|---|---|---|---|
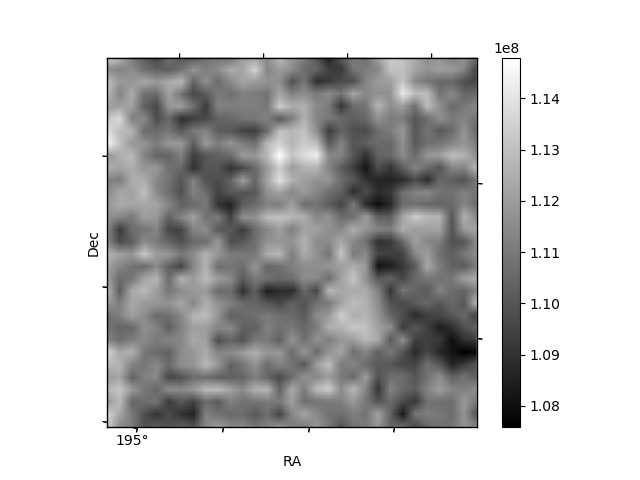
| Quadrant D | 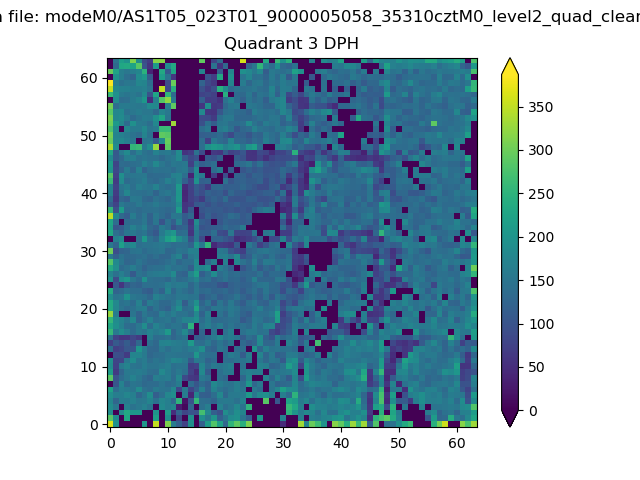 |
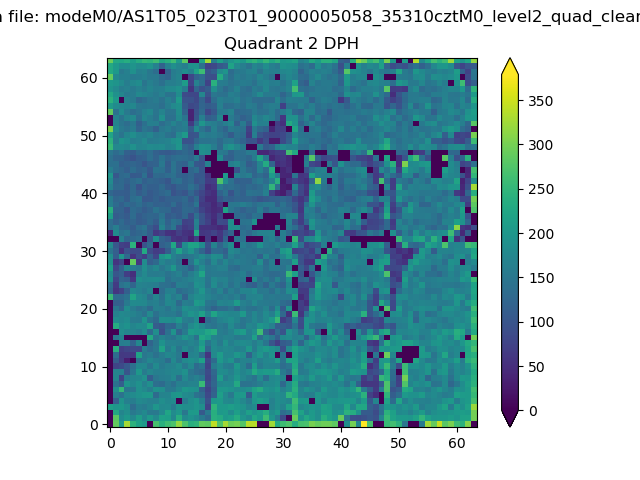 |
Quadrant C |
| Plot type | Count rate plots | Images |
|---|---|---|
| Comparison with Poisson distribution Blue bars denote a histogram of data divided into 1 sec bins. Red curve is a Poisson curve with rate = median count rate of data. |
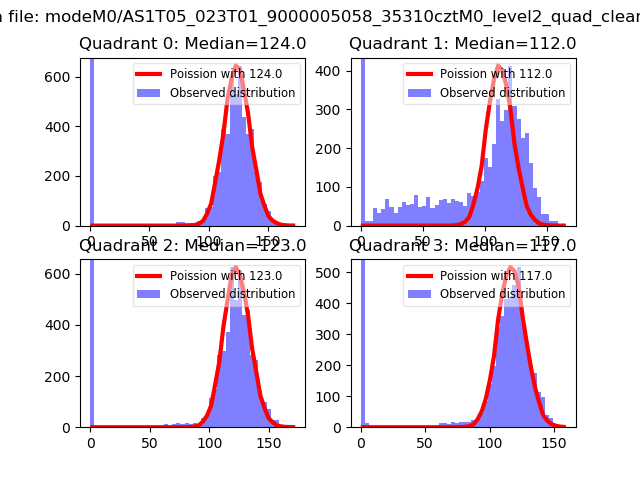 |
 |
| Quadrant-wise count rates Data is divided into 100 sec bins |
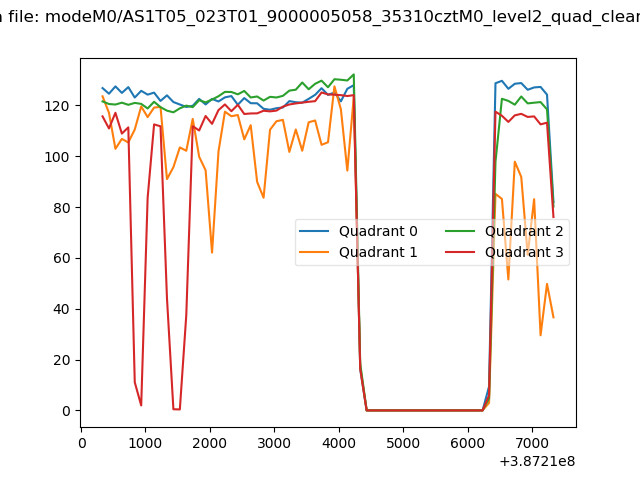 |
|
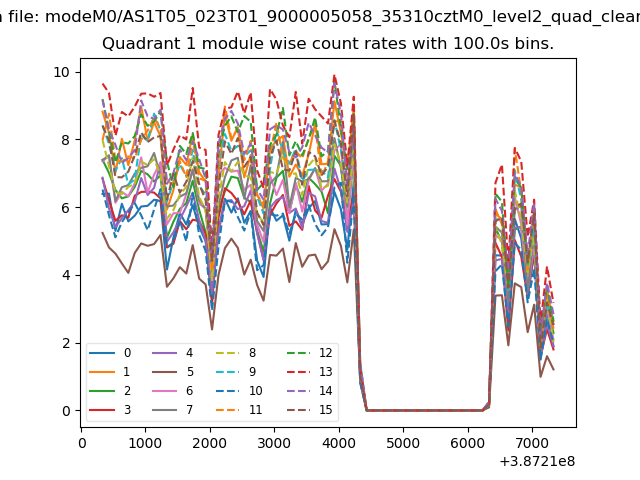
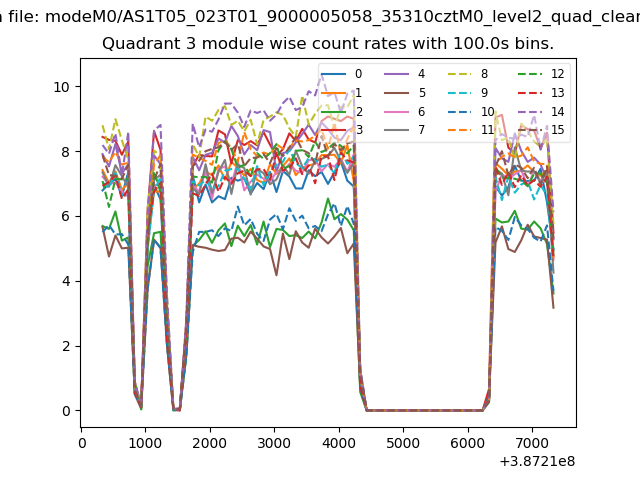
| Module-wise count rates for Quadrant A Data is divided into 100 sec bins |
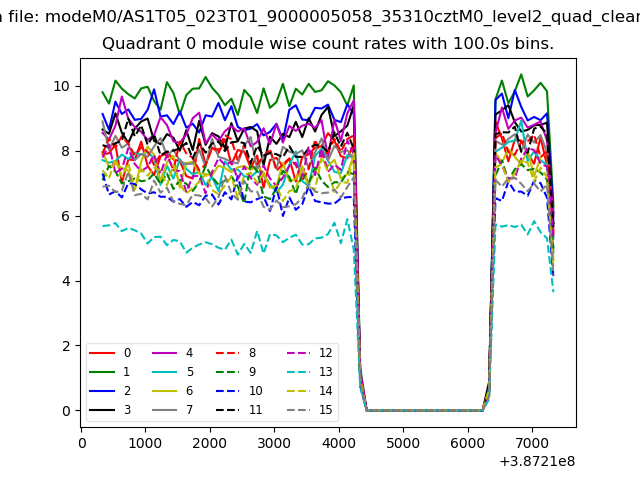 |
 |
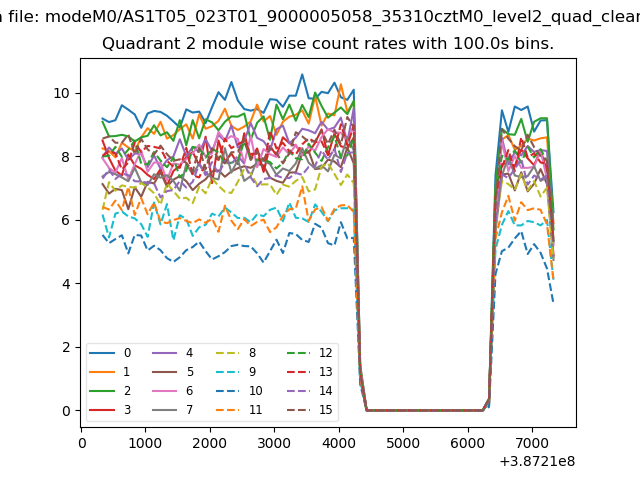
| Module-wise count rates for Quadrant B Data is divided into 100 sec bins |
 |
 |
| Module-wise count rates for Quadrant C Data is divided into 100 sec bins |
 |
 |
| Module-wise count rates for Quadrant D Data is divided into 100 sec bins |
 |
 |
| Parameter | Plot |
|---|---|
| CZT HV Monitor | 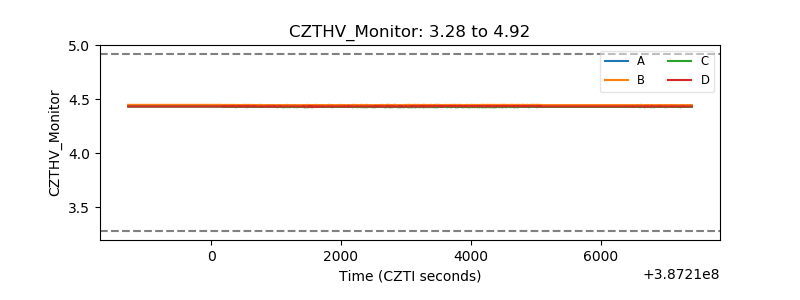 |
| D_VDD | 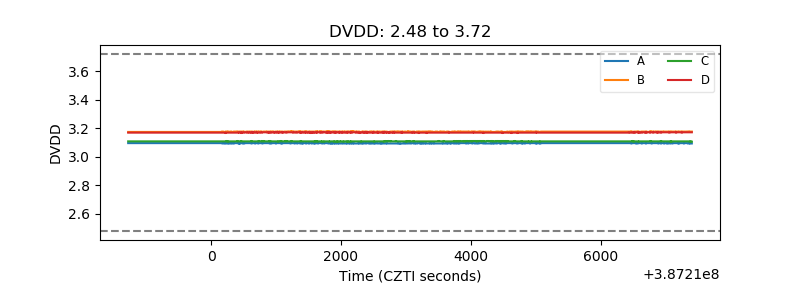 |
| Temperature 1 | 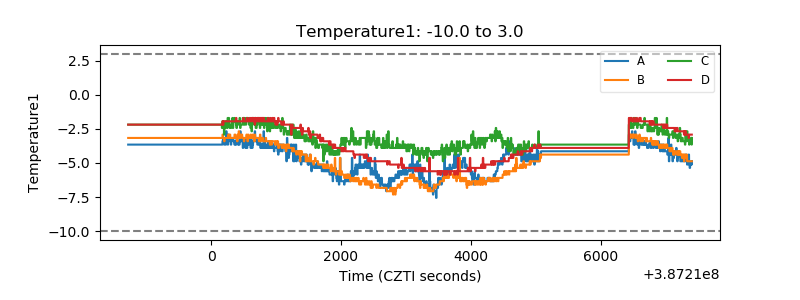 |
| Veto HV Monitor | 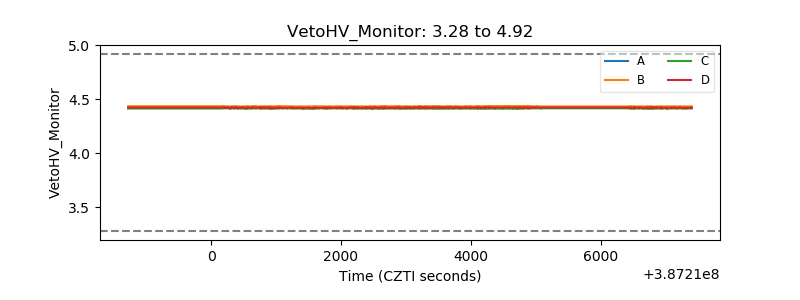 |
| Veto LLD | 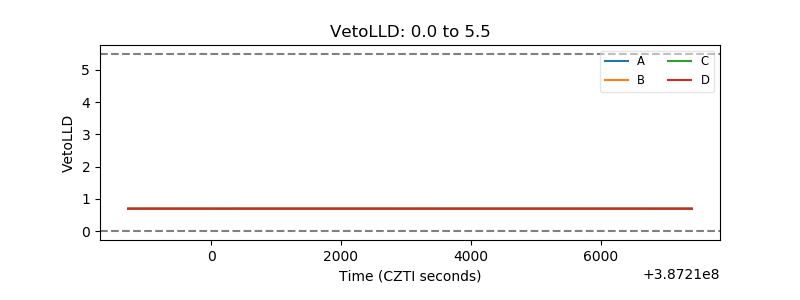 |
| Alpha Counter | 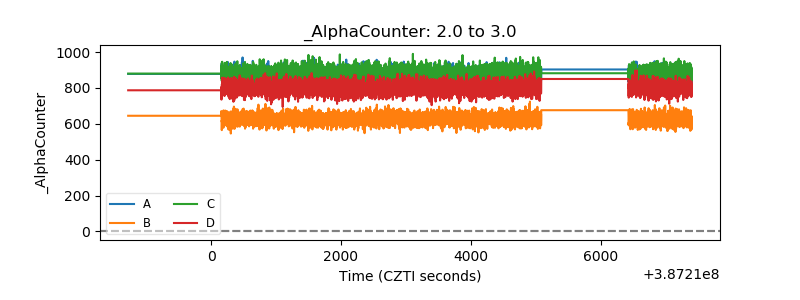 |
| _CPM_Rate | 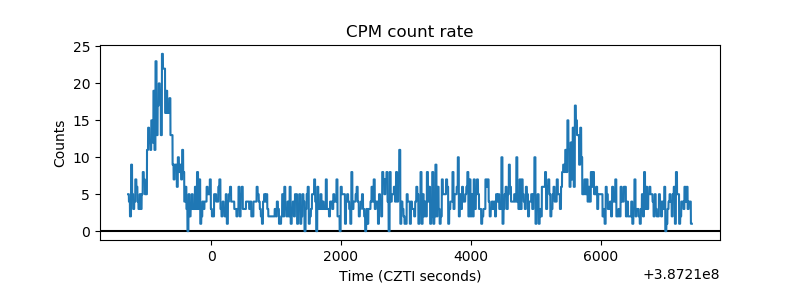 |
| CZT Counter | 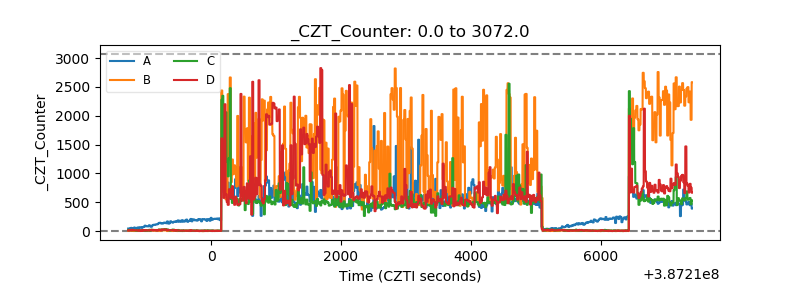 |
| +2.5 Volts monitor | 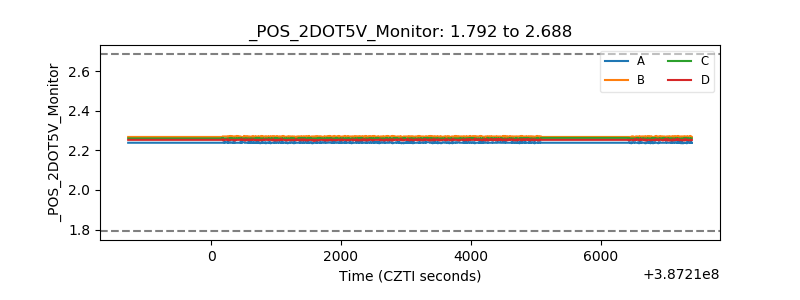 |
| +5 Volts monitor | 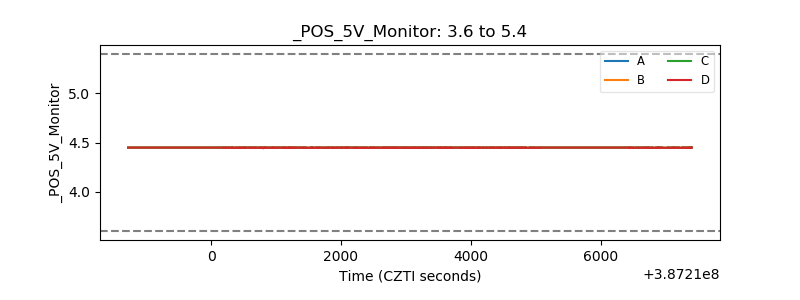 |
| _ROLL_ROT | 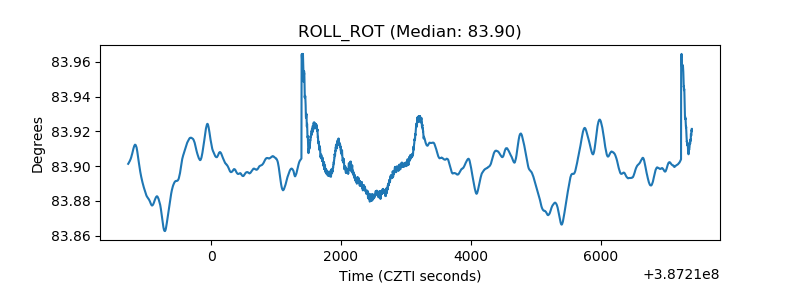 |
| _Roll_DEC | 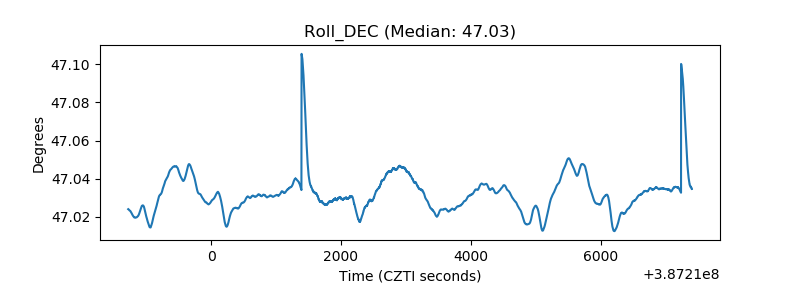 |
| _Roll_RA | 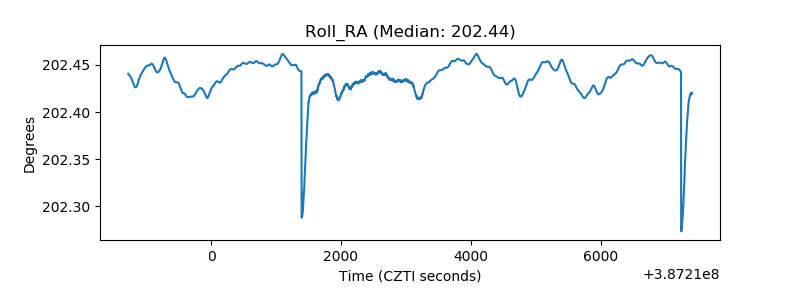 |
| Veto Counter | 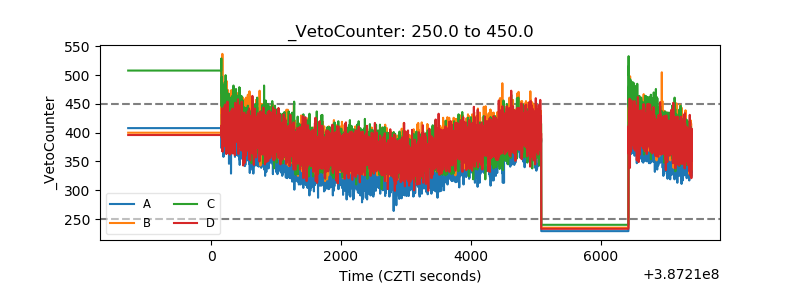 |