| Param | Original file | Final file |
|---|---|---|
| Filename | modeM0/AS1T05_023T01_9000005058_35308cztM0_level2.evt | modeM0/AS1T05_023T01_9000005058_35308cztM0_level2_quad_clean.evt |
| Size (bytes) | 779,526,720 | 63,872,640 |
| Size | 743.4 MB | 60.9 MB |
| Events in quadrant A | 3,795,455 | 469,538 |
| Events in quadrant B | 7,121,611 | 413,322 |
| Events in quadrant C | 2,876,990 | 470,237 |
| Events in quadrant D | 9,460,903 | 212,000 |
| Mode M0 | |||
|---|---|---|---|
| Quadrant | BADHDUFLAG | Total packets | Discarded packets |
| A | 0 | 14764 | 3 |
| B | 0 | 24791 | 2 |
| C | 0 | 11487 | 2 |
| D | 0 | 31690 | 2 |
| Mode M9 | |||
|---|---|---|---|
| Quadrant | BADHDUFLAG | Total packets | Discarded packets |
| A | 0 | 32 | 0 |
| B | 0 | 32 | 0 |
| C | 0 | 32 | 0 |
| D | 0 | 33 | 0 |
| Mode SS | |||
|---|---|---|---|
| Quadrant | BADHDUFLAG | Total packets | Discarded packets |
| A | 0 | 108 | 0 |
| B | 0 | 108 | 0 |
| C | 0 | 108 | 0 |
| D | 0 | 108 | 0 |
| Quadrant | Total seconds | Saturated seconds | Saturation percentage |
|---|---|---|---|
| A | 5234 | 92 | 1.757738% |
| B | 5234 | 1724 | 32.938479% |
| C | 5234 | 93 | 1.776844% |
| D | 5234 | 2868 | 54.795567% |
Noise dominated data is calculated using 1-second bins in cleaned event files. If a bin has >2000 counts, and if more than 50% of those come from <1% of pixels, then it is considered to be noise-dominated and hence unusable.
| Quadrant | # 1 sec bins | Bins with >0 counts | Bins with >2000 counts | High rate bins dominated by noise | Noise dominated (total time) | Noise dominated (detector-on time) | Marked lightcurve |
|---|---|---|---|---|---|---|---|
| A | 7177 | 5235 | 75 | 75 | 1.05% | 1.43% |  |
| B | 7176 | 5233 | 1344 | 1344 | 18.73% | 25.68% | 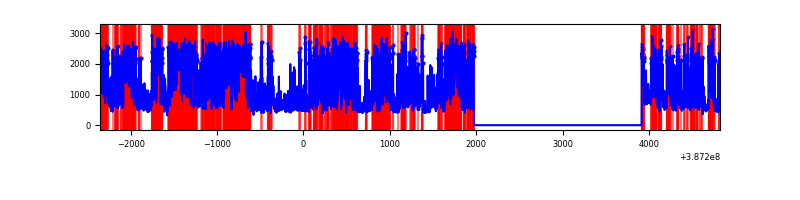 |
| C | 7177 | 5235 | 58 | 58 | 0.81% | 1.11% |  |
| D | 7176 | 5234 | 2866 | 2866 | 39.94% | 54.76% | 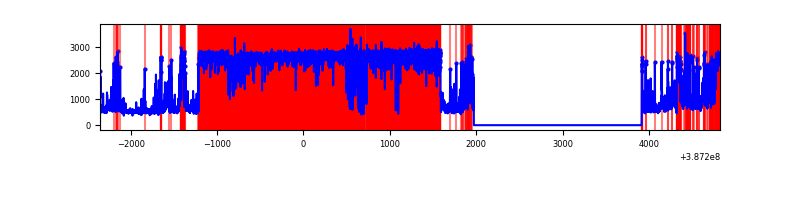 |
Top three noisy pixels from each quadrant. If the there are fewer than three noisy pixels in the level2.evt file, extra rows are filled as -1
| Pixel properties | Quadrant properties | ||||||
|---|---|---|---|---|---|---|---|
| Quadrant | DetID | PixID | Counts | Sigma | Mean | Median | Sigma |
| A | 15 | 169 | 1233328 | 10004.38 | 615 | 605 | 123.2 |
| A | 10 | 83 | 95787 | 772.47 | 615 | 605 | 123.2 |
| A | 7 | 3 | 45142 | 361.45 | 615 | 605 | 123.2 |
| B | 5 | 236 | 3466245 | 33553.68 | 535 | 519 | 103.3 |
| B | 5 | 172 | 1516297 | 14675.12 | 535 | 519 | 103.3 |
| B | 4 | 232 | 28101 | 267.04 | 535 | 519 | 103.3 |
| C | 0 | 10 | 279663 | 2026.72 | 595 | 598 | 137.7 |
| C | 15 | 214 | 219046 | 1586.49 | 595 | 598 | 137.7 |
| C | 3 | 233 | 56088 | 403.0 | 595 | 598 | 137.7 |
| D | 10 | 203 | 5862146 | 57804.0 | 404 | 392 | 101.4 |
| D | 7 | 80 | 986849 | 9727.66 | 404 | 392 | 101.4 |
| D | 8 | 195 | 317415 | 3126.23 | 404 | 392 | 101.4 |
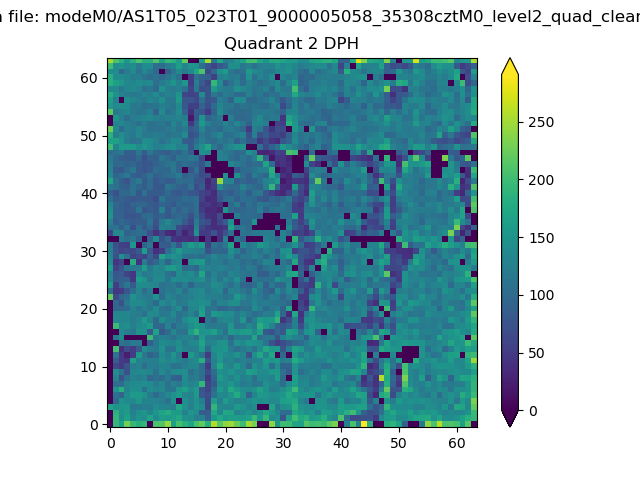
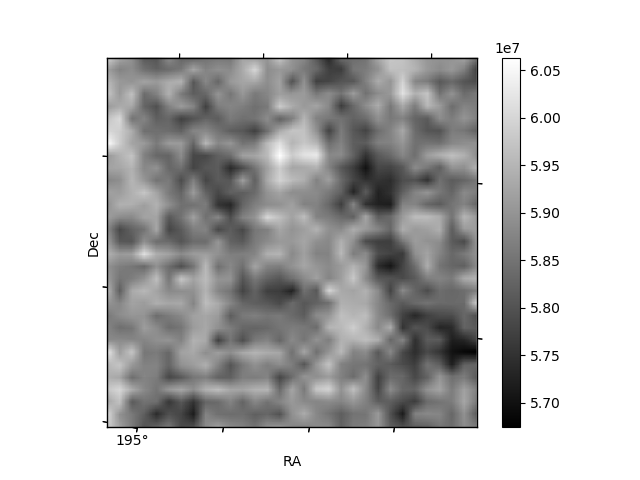
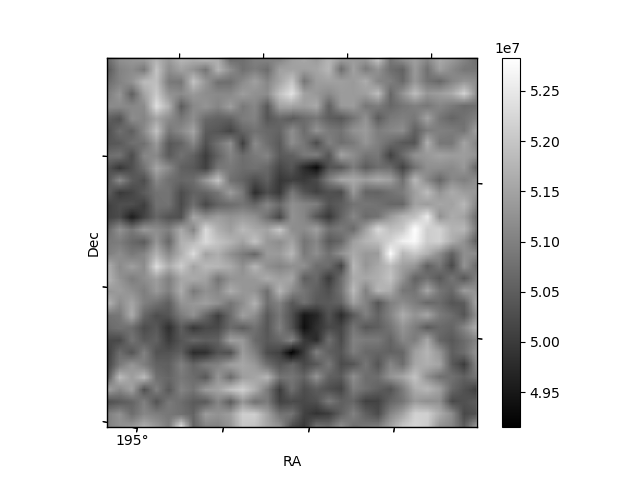
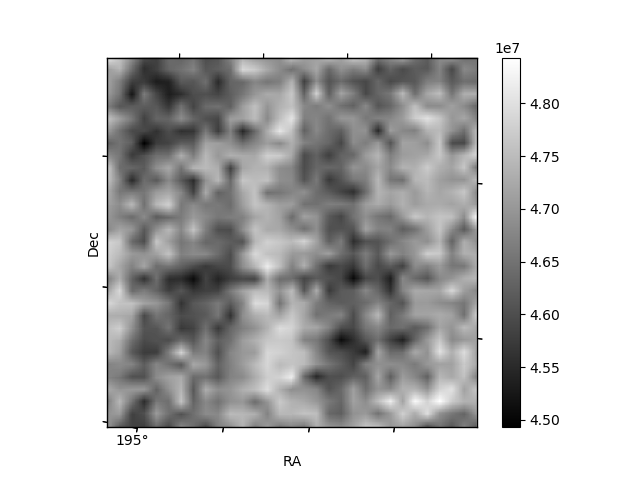
Histogram calculated using DETX and DETY for each event in the final _common_clean file
| Quadrant A | 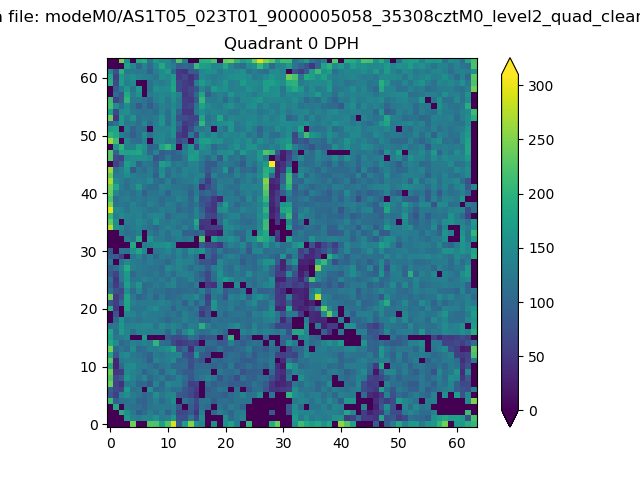 |
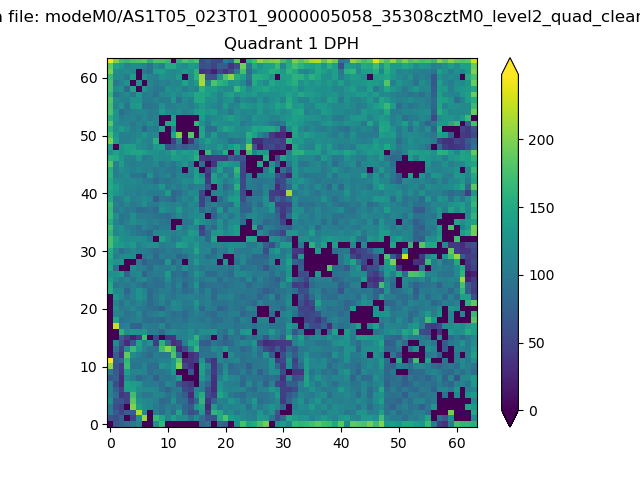 |
Quadrant B |
|---|---|---|---|
| Quadrant D | 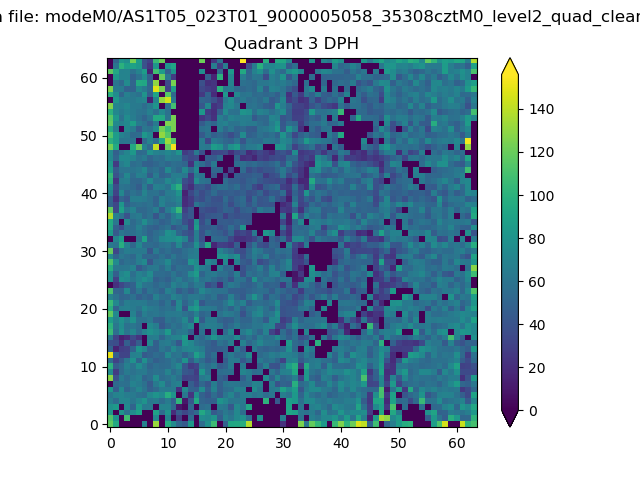 |
 |
Quadrant C |
| Plot type | Count rate plots | Images |
|---|---|---|
| Comparison with Poisson distribution Blue bars denote a histogram of data divided into 1 sec bins. Red curve is a Poisson curve with rate = median count rate of data. |
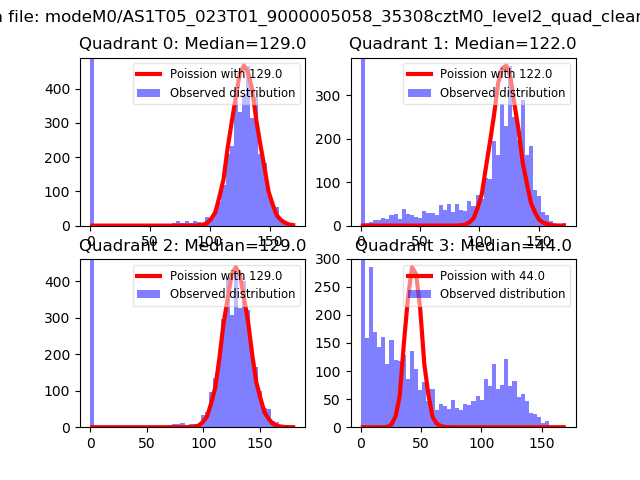 |
 |
| Quadrant-wise count rates Data is divided into 100 sec bins |
 |
|
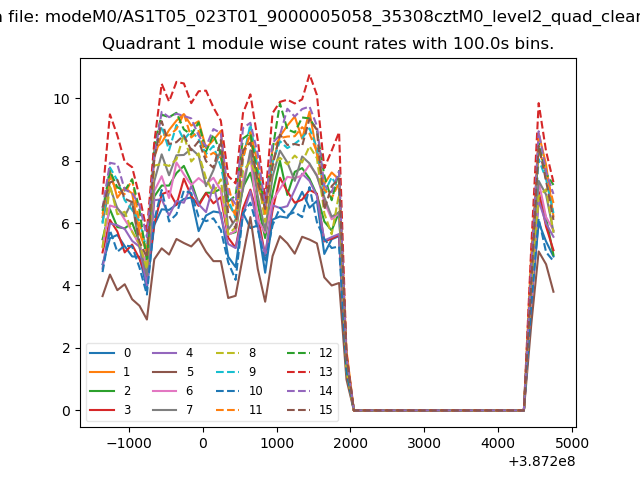
| Module-wise count rates for Quadrant A Data is divided into 100 sec bins |
 |
 |
| Module-wise count rates for Quadrant B Data is divided into 100 sec bins |
 |
 |
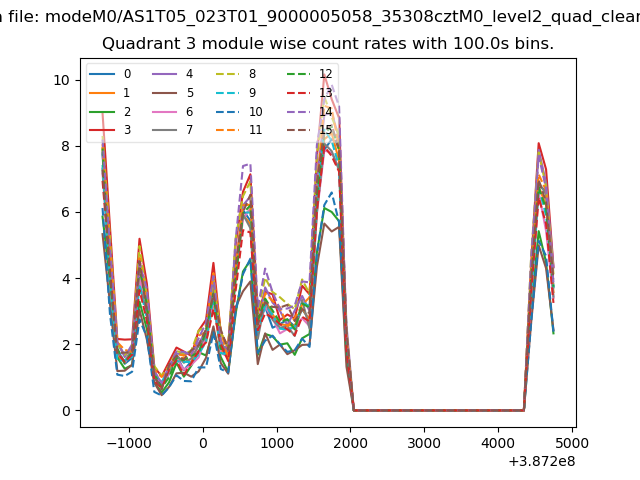
| Module-wise count rates for Quadrant C Data is divided into 100 sec bins |
 |
 |
| Module-wise count rates for Quadrant D Data is divided into 100 sec bins |
 |
 |
| Parameter | Plot |
|---|---|
| CZT HV Monitor | 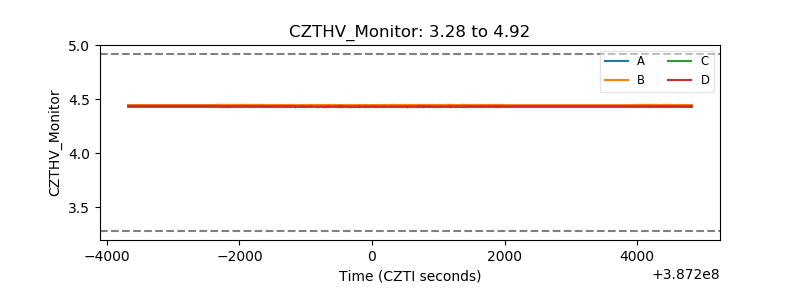 |
| D_VDD | 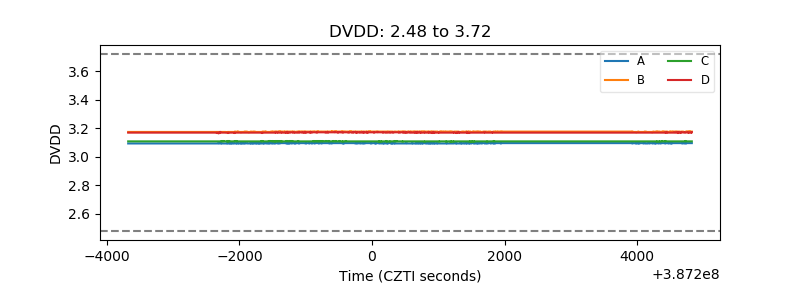 |
| Temperature 1 | 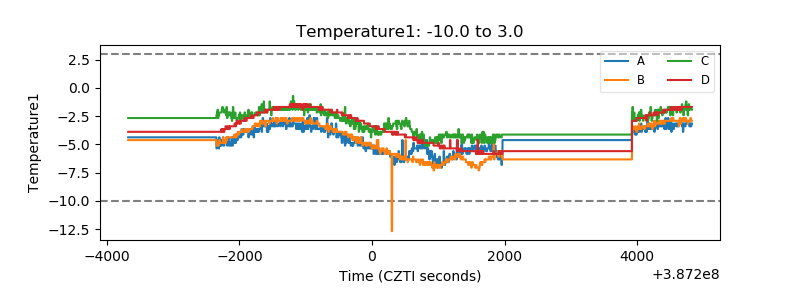 |
| Veto HV Monitor | 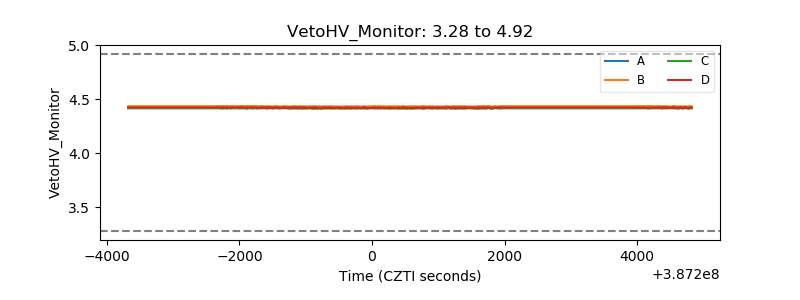 |
| Veto LLD | 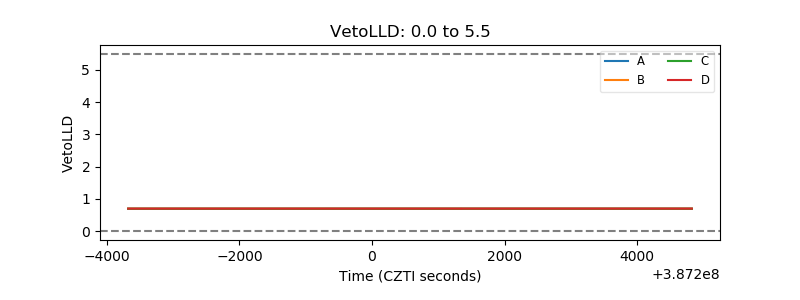 |
| Alpha Counter | 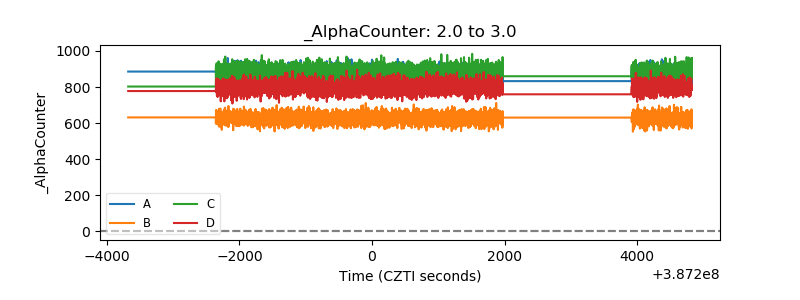 |
| _CPM_Rate | 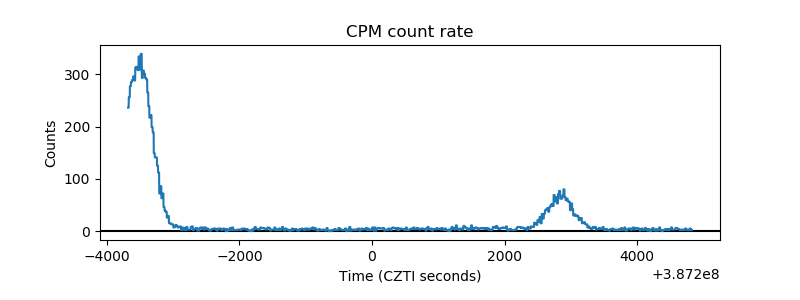 |
| CZT Counter | 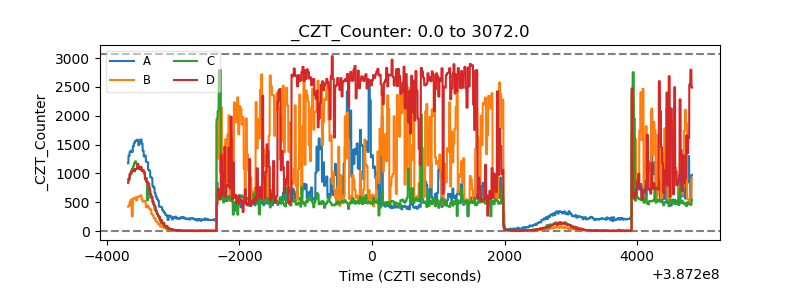 |
| +2.5 Volts monitor | 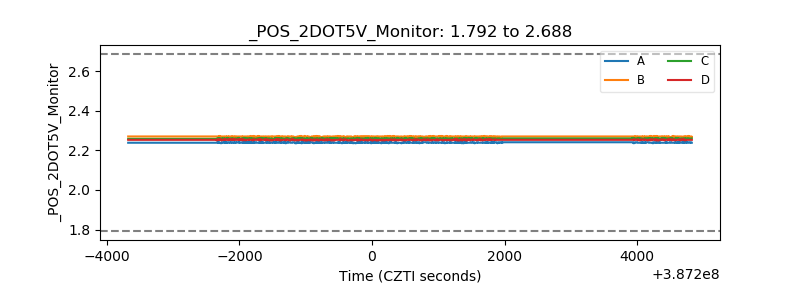 |
| +5 Volts monitor | 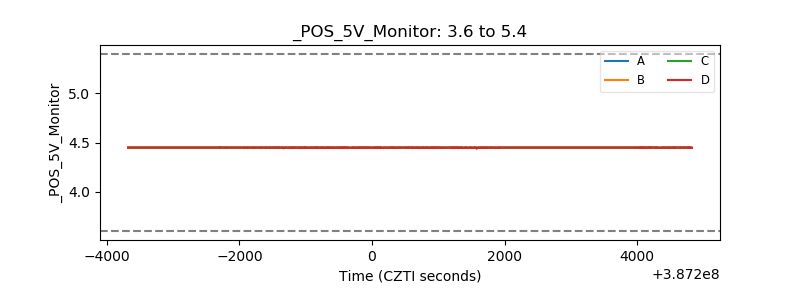 |
| _ROLL_ROT | 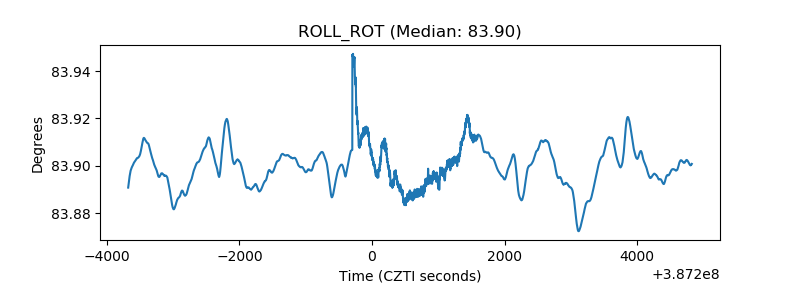 |
| _Roll_DEC | 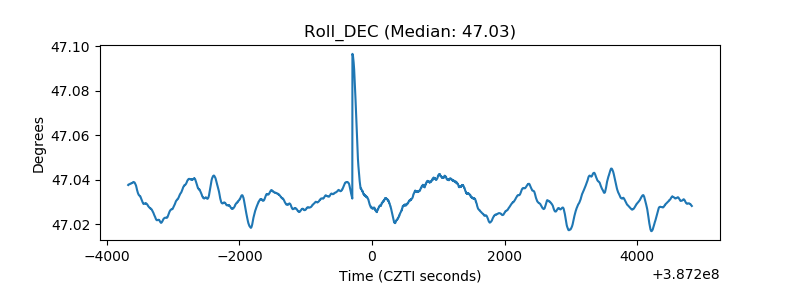 |
| _Roll_RA | 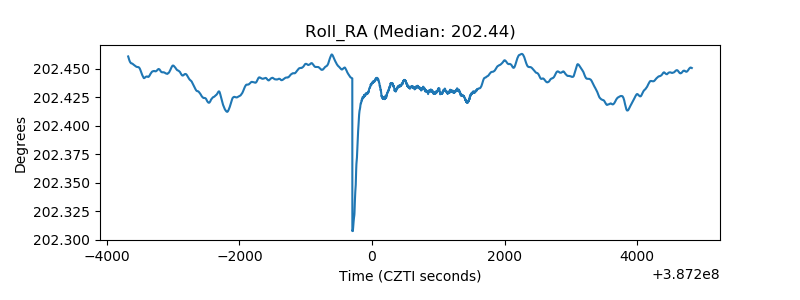 |
| Veto Counter | 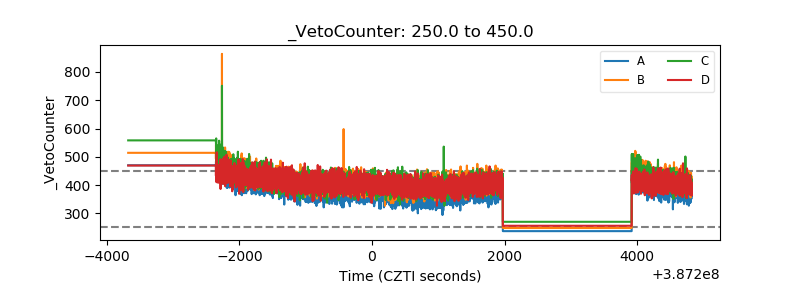 |