| Param | Original file | Final file |
|---|---|---|
| Filename | modeM0/AS1T05_023T01_9000005058_35305cztM0_level2.evt | modeM0/AS1T05_023T01_9000005058_35305cztM0_level2_quad_clean.evt |
| Size (bytes) | 594,385,920 | 52,554,240 |
| Size | 566.9 MB | 50.1 MB |
| Events in quadrant A | 3,151,562 | 338,329 |
| Events in quadrant B | 7,471,406 | 274,052 |
| Events in quadrant C | 2,861,949 | 324,932 |
| Events in quadrant D | 4,183,121 | 307,659 |
| Mode M0 | |||
|---|---|---|---|
| Quadrant | BADHDUFLAG | Total packets | Discarded packets |
| A | 0 | 12548 | 3 |
| B | 0 | 25667 | 2 |
| C | 0 | 11234 | 2 |
| D | 0 | 15863 | 2 |
| Mode M9 | |||
|---|---|---|---|
| Quadrant | BADHDUFLAG | Total packets | Discarded packets |
| A | 0 | 21 | 0 |
| B | 0 | 21 | 0 |
| C | 0 | 21 | 0 |
| D | 0 | 22 | 0 |
| Mode SS | |||
|---|---|---|---|
| Quadrant | BADHDUFLAG | Total packets | Discarded packets |
| A | 0 | 100 | 0 |
| B | 0 | 100 | 0 |
| C | 0 | 100 | 0 |
| D | 0 | 100 | 0 |
| Quadrant | Total seconds | Saturated seconds | Saturation percentage |
|---|---|---|---|
| A | 4923 | 18 | 0.365631% |
| B | 4923 | 2116 | 42.981922% |
| C | 4923 | 72 | 1.462523% |
| D | 4923 | 284 | 5.768840% |
Noise dominated data is calculated using 1-second bins in cleaned event files. If a bin has >2000 counts, and if more than 50% of those come from <1% of pixels, then it is considered to be noise-dominated and hence unusable.
| Quadrant | # 1 sec bins | Bins with >0 counts | Bins with >2000 counts | High rate bins dominated by noise | Noise dominated (total time) | Noise dominated (detector-on time) | Marked lightcurve |
|---|---|---|---|---|---|---|---|
| A | 7016 | 4924 | 3 | 3 | 0.04% | 0.06% | 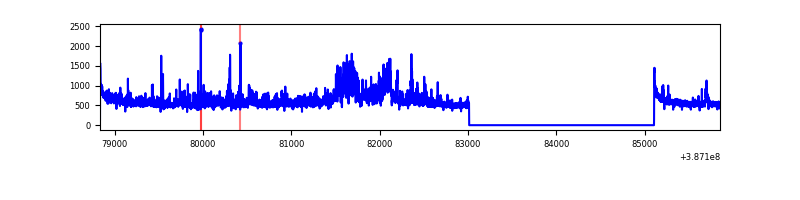 |
| B | 7016 | 4923 | 1594 | 1594 | 22.72% | 32.38% | 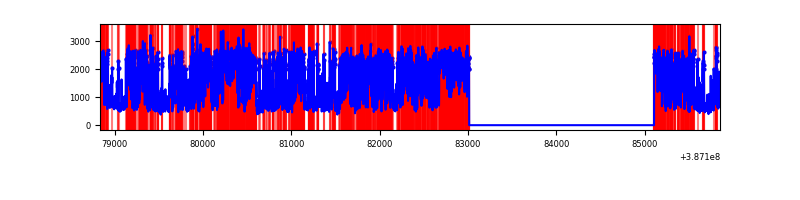 |
| C | 7016 | 4924 | 67 | 67 | 0.95% | 1.36% | 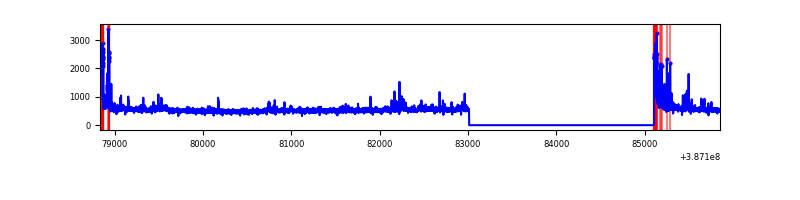 |
| D | 7016 | 4924 | 266 | 266 | 3.79% | 5.40% | 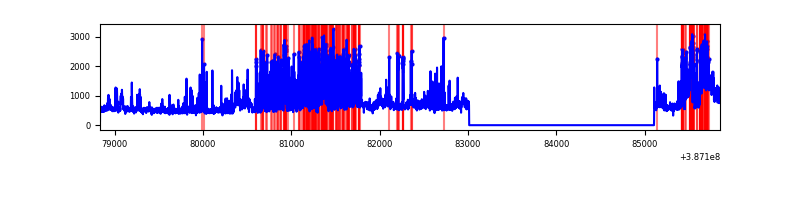 |
Top three noisy pixels from each quadrant. If the there are fewer than three noisy pixels in the level2.evt file, extra rows are filled as -1
| Pixel properties | Quadrant properties | ||||||
|---|---|---|---|---|---|---|---|
| Quadrant | DetID | PixID | Counts | Sigma | Mean | Median | Sigma |
| A | 15 | 169 | 566970 | 4571.19 | 628 | 618 | 123.9 |
| A | 10 | 83 | 94449 | 757.34 | 628 | 618 | 123.9 |
| A | 7 | 3 | 32562 | 257.83 | 628 | 618 | 123.9 |
| B | 5 | 236 | 4056258 | 41599.0 | 517 | 506 | 97.5 |
| B | 5 | 172 | 1350786 | 13849.54 | 517 | 506 | 97.5 |
| B | 0 | 183 | 15766 | 156.52 | 517 | 506 | 97.5 |
| C | 0 | 10 | 279420 | 2055.85 | 594 | 598 | 135.6 |
| C | 15 | 214 | 206822 | 1520.56 | 594 | 598 | 135.6 |
| C | 3 | 233 | 30497 | 220.45 | 594 | 598 | 135.6 |
| D | 13 | 249 | 512573 | 3645.23 | 591 | 575 | 140.5 |
| D | 10 | 203 | 374790 | 2664.27 | 591 | 575 | 140.5 |
| D | 8 | 195 | 370359 | 2632.72 | 591 | 575 | 140.5 |
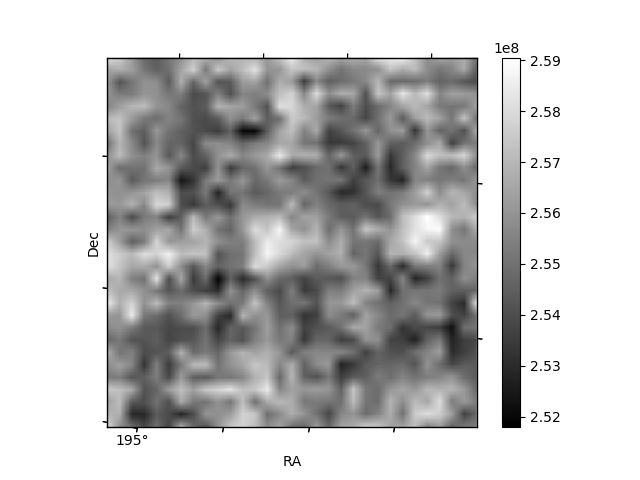
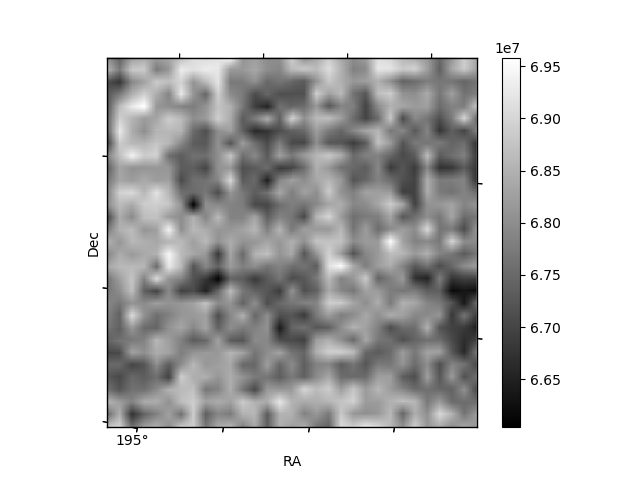
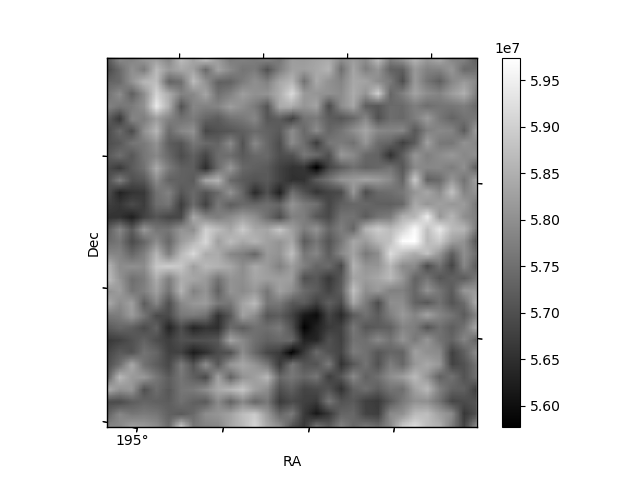
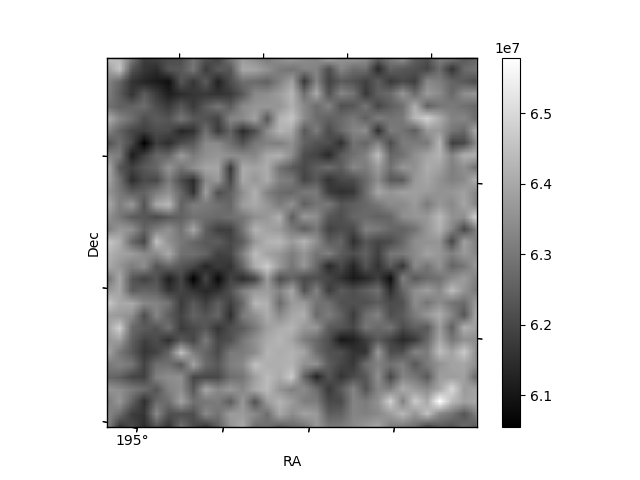
Histogram calculated using DETX and DETY for each event in the final _common_clean file
| Quadrant A | 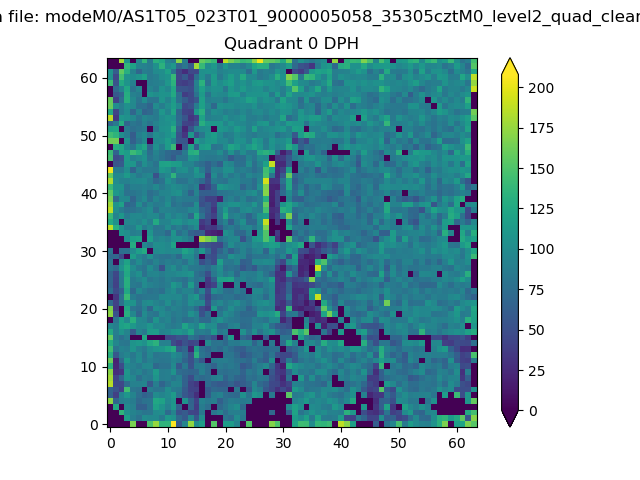 |
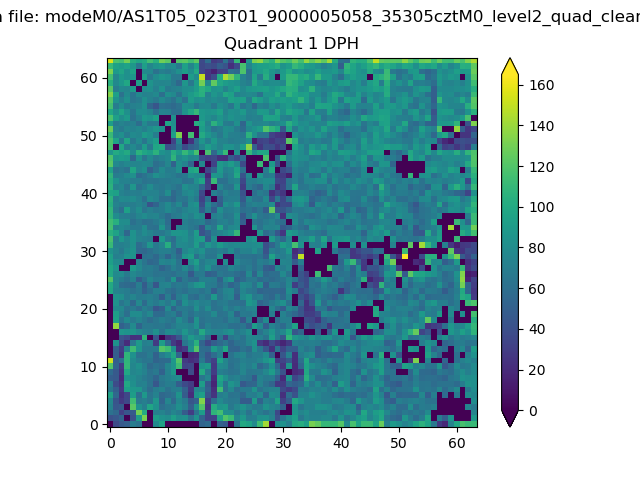 |
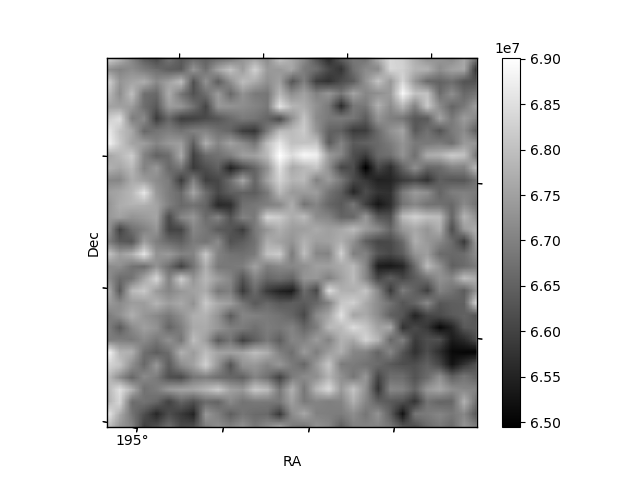
Quadrant B |
|---|---|---|---|
| Quadrant D | 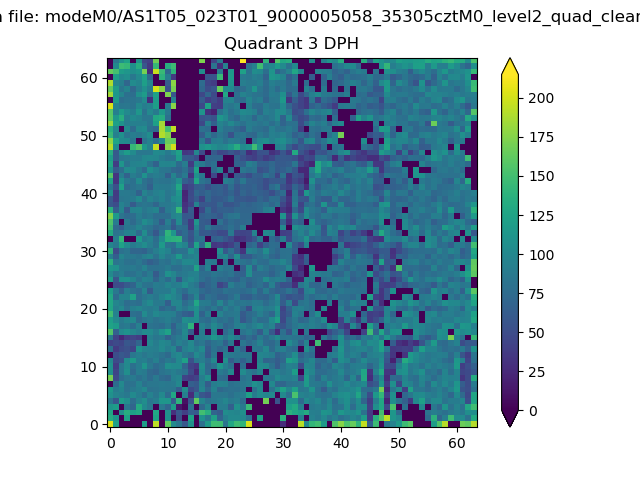 |
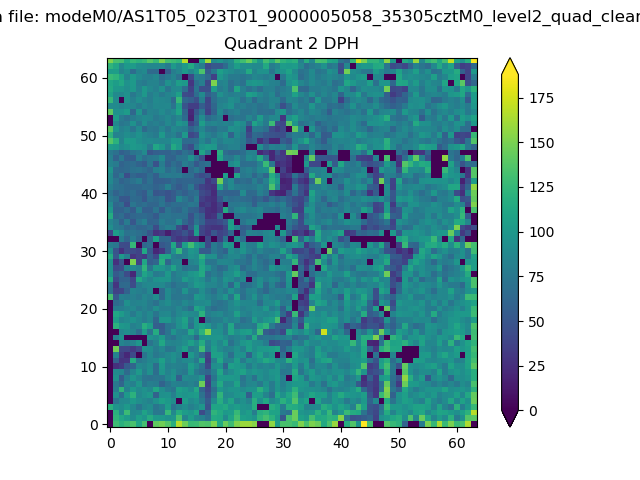 |
Quadrant C |
| Plot type | Count rate plots | Images |
|---|---|---|
| Comparison with Poisson distribution Blue bars denote a histogram of data divided into 1 sec bins. Red curve is a Poisson curve with rate = median count rate of data. |
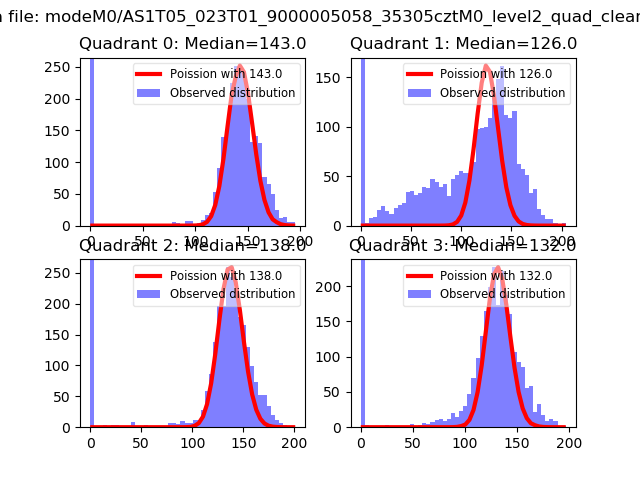 |
 |
| Quadrant-wise count rates Data is divided into 100 sec bins |
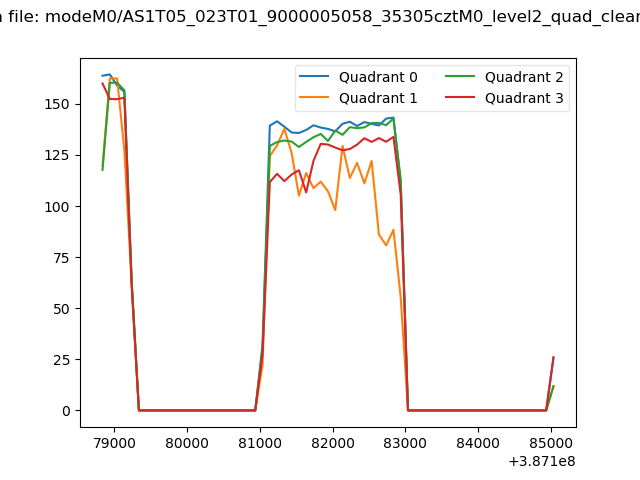 |
|
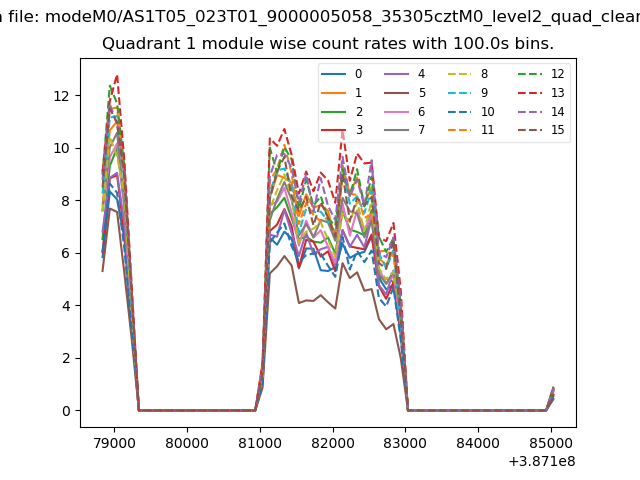
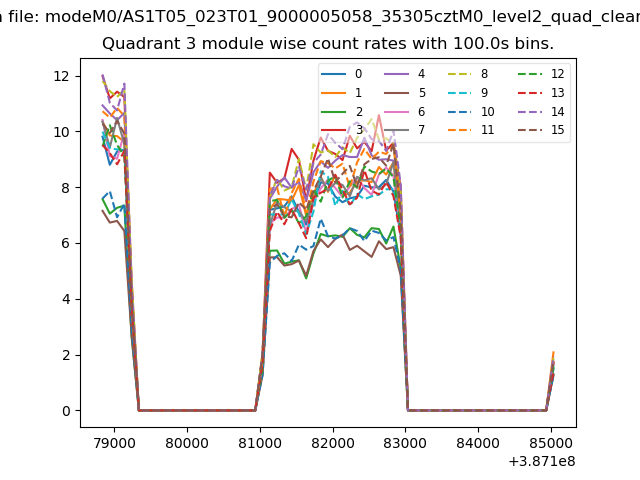
| Module-wise count rates for Quadrant A Data is divided into 100 sec bins |
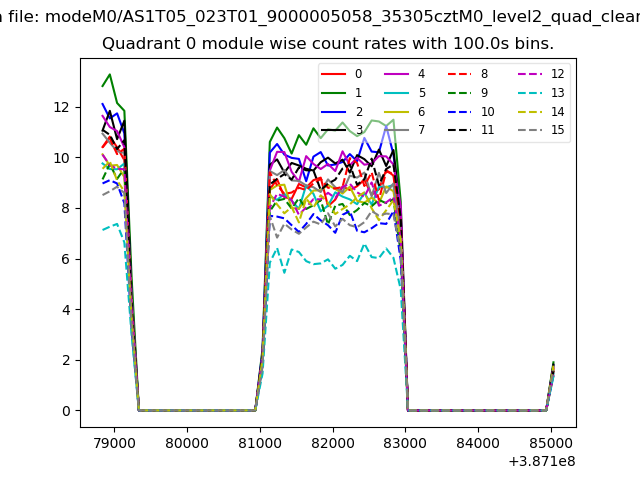 |
 |
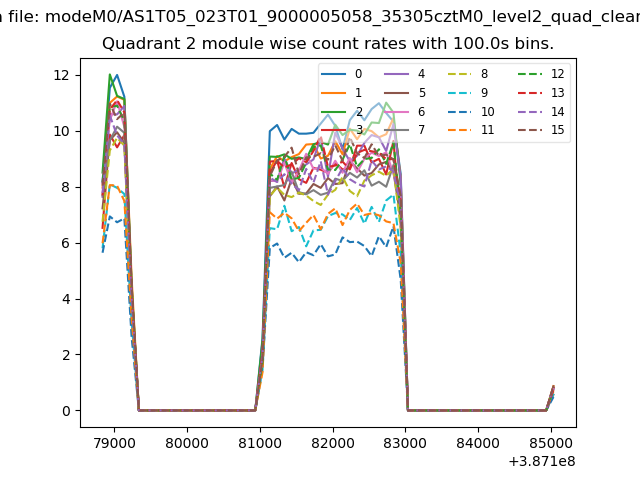
| Module-wise count rates for Quadrant B Data is divided into 100 sec bins |
 |
 |
| Module-wise count rates for Quadrant C Data is divided into 100 sec bins |
 |
 |
| Module-wise count rates for Quadrant D Data is divided into 100 sec bins |
 |
 |
| Parameter | Plot |
|---|---|
| CZT HV Monitor | 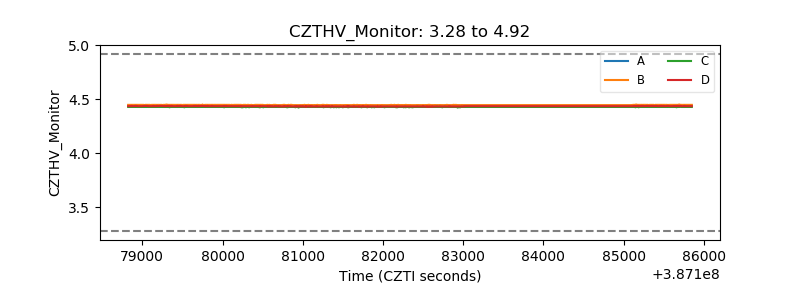 |
| D_VDD | 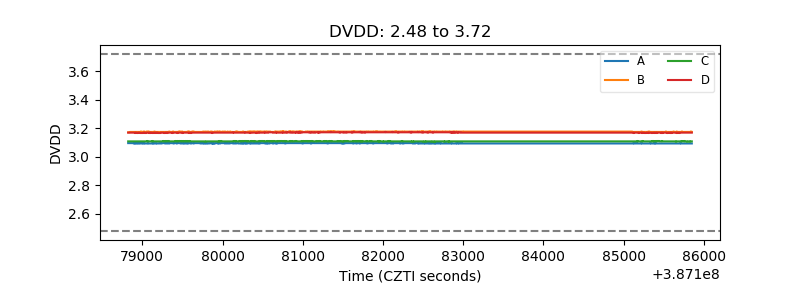 |
| Temperature 1 | 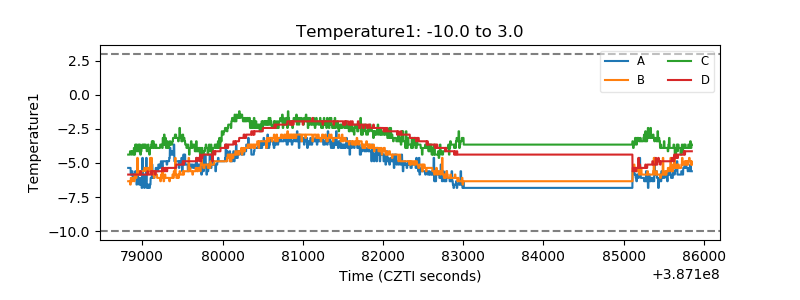 |
| Veto HV Monitor | 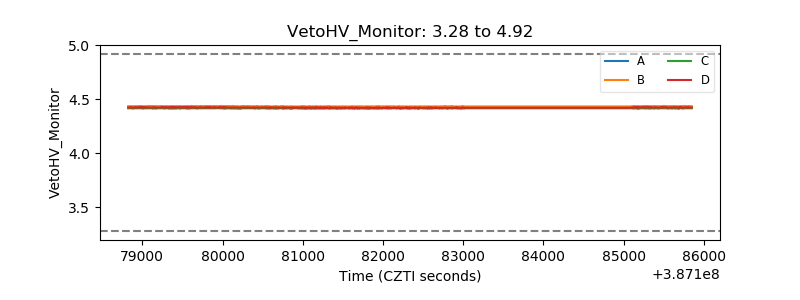 |
| Veto LLD | 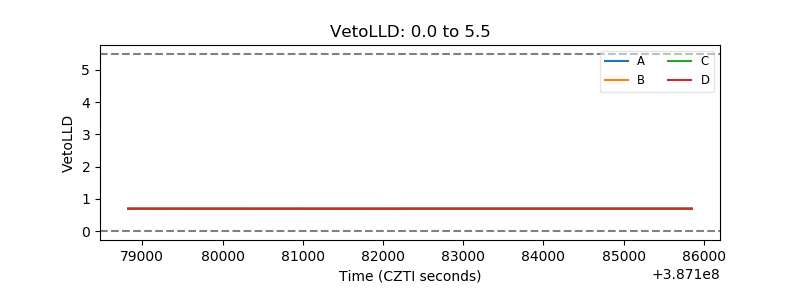 |
| Alpha Counter | 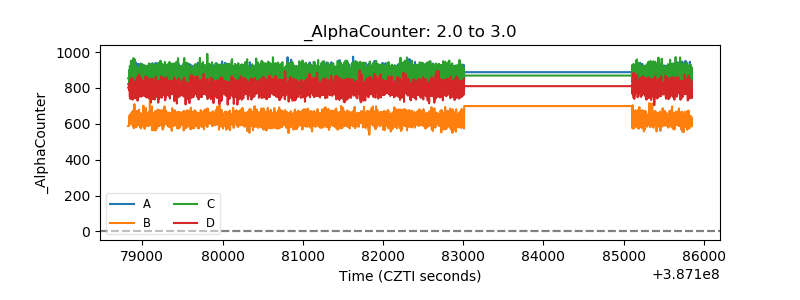 |
| _CPM_Rate | 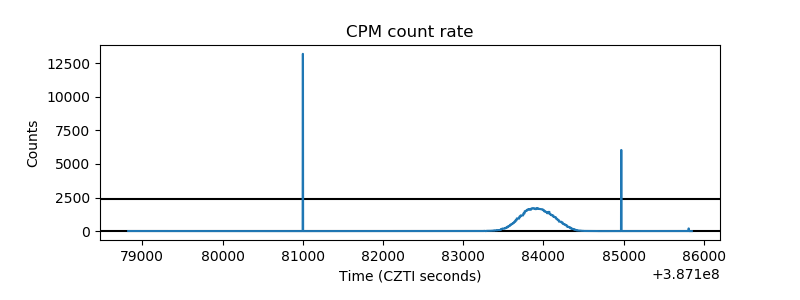 |
| CZT Counter | 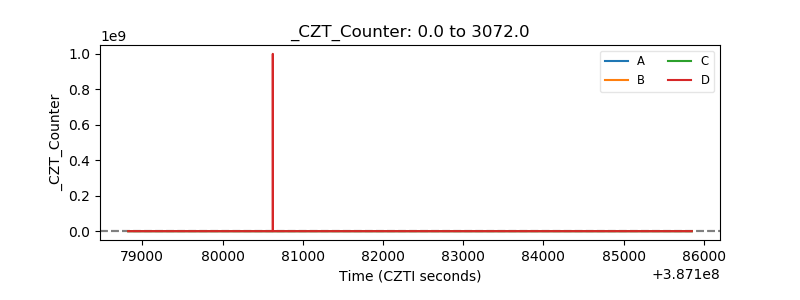 |
| +2.5 Volts monitor | 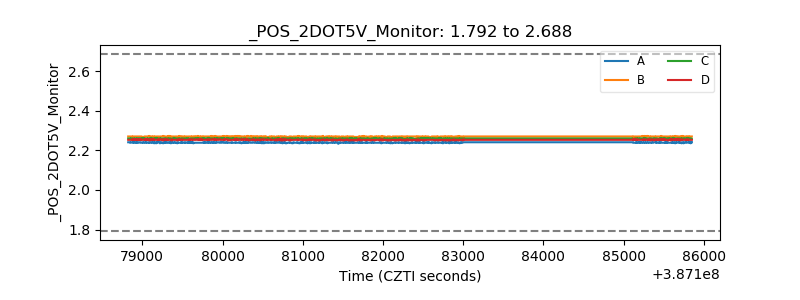 |
| +5 Volts monitor | 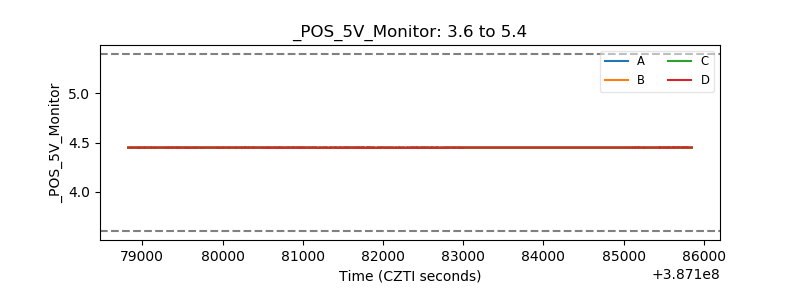 |
| _ROLL_ROT | 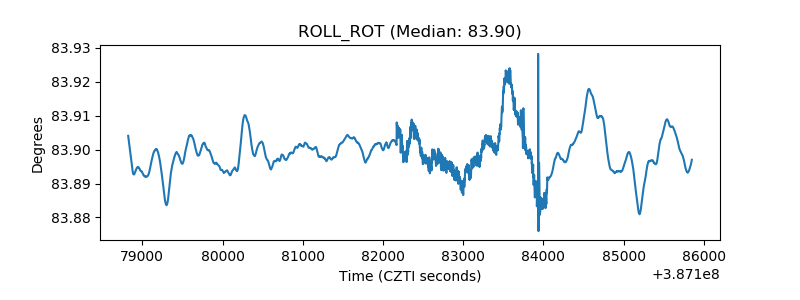 |
| _Roll_DEC | 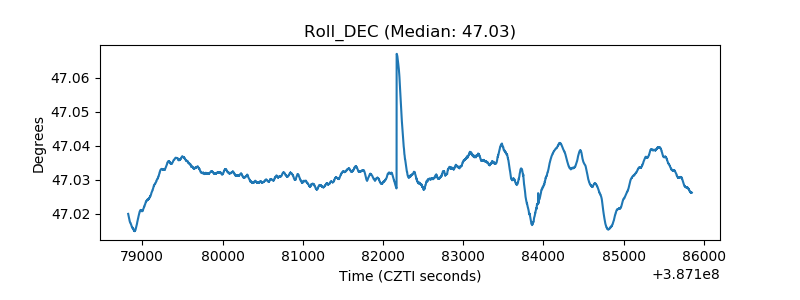 |
| _Roll_RA | 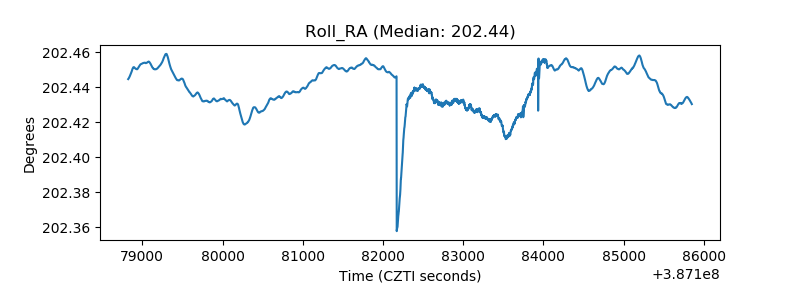 |
| Veto Counter | 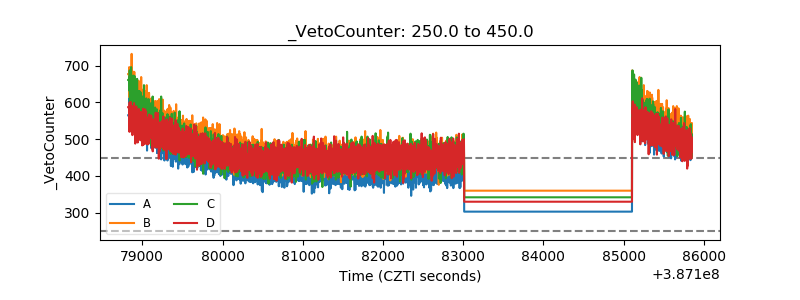 |