| Param | Original file | Final file |
|---|---|---|
| Filename | modeM0/AS1T05_023T01_9000005058_35302cztM0_level2.evt | modeM0/AS1T05_023T01_9000005058_35302cztM0_level2_quad_clean.evt |
| Size (bytes) | 104,394,240 | 15,845,760 |
| Size | 99.6 MB | 15.1 MB |
| Events in quadrant A | 524,127 | 113,460 |
| Events in quadrant B | 1,532,546 | 74,684 |
| Events in quadrant C | 581,742 | 113,505 |
| Events in quadrant D | 462,887 | 111,087 |
| Mode M0 | |||
|---|---|---|---|
| Quadrant | BADHDUFLAG | Total packets | Discarded packets |
| A | 0 | 2162 | 2 |
| B | 0 | 5131 | 1 |
| C | 0 | 2241 | 1 |
| D | 0 | 1914 | 1 |
| Mode M9 | |||
|---|---|---|---|
| Quadrant | BADHDUFLAG | Total packets | Discarded packets |
| A | 0 | 17 | 0 |
| B | 0 | 17 | 0 |
| C | 0 | 17 | 0 |
| D | 0 | 17 | 0 |
| Mode SS | |||
|---|---|---|---|
| Quadrant | BADHDUFLAG | Total packets | Discarded packets |
| A | 0 | 20 | 0 |
| B | 0 | 20 | 0 |
| C | 0 | 20 | 0 |
| D | 0 | 20 | 0 |
| Quadrant | Total seconds | Saturated seconds | Saturation percentage |
|---|---|---|---|
| A | 841 | 3 | 0.356718% |
| B | 841 | 522 | 62.068966% |
| C | 841 | 36 | 4.280618% |
| D | 841 | 10 | 1.189061% |
Noise dominated data is calculated using 1-second bins in cleaned event files. If a bin has >2000 counts, and if more than 50% of those come from <1% of pixels, then it is considered to be noise-dominated and hence unusable.
| Quadrant | # 1 sec bins | Bins with >0 counts | Bins with >2000 counts | High rate bins dominated by noise | Noise dominated (total time) | Noise dominated (detector-on time) | Marked lightcurve |
|---|---|---|---|---|---|---|---|
| A | 841 | 841 | 2 | 2 | 0.24% | 0.24% | 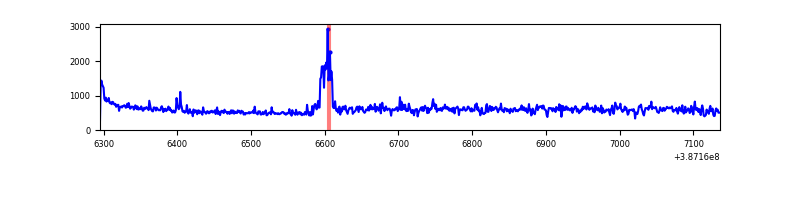 |
| B | 840 | 840 | 433 | 433 | 51.55% | 51.55% | 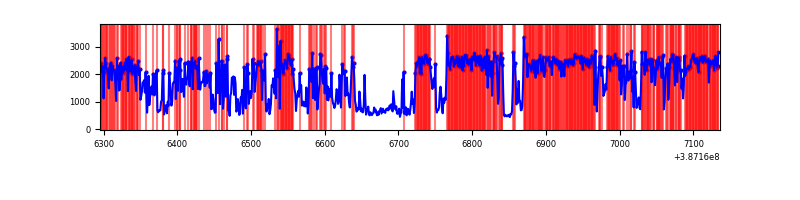 |
| C | 841 | 841 | 30 | 30 | 3.57% | 3.57% | 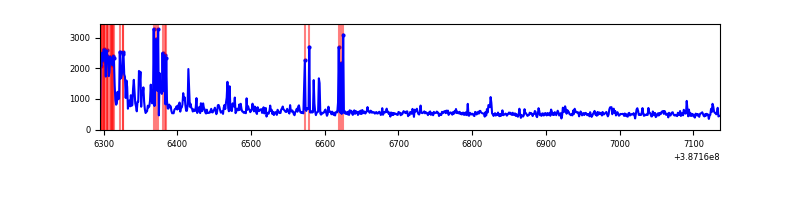 |
| D | 841 | 841 | 10 | 10 | 1.19% | 1.19% | 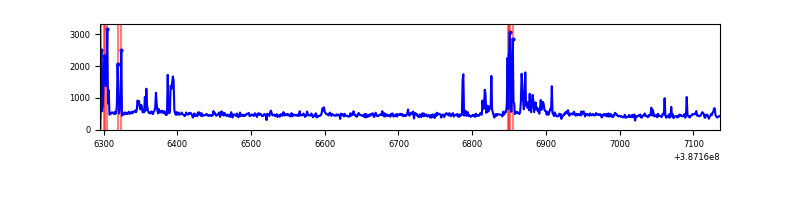 |
Top three noisy pixels from each quadrant. If the there are fewer than three noisy pixels in the level2.evt file, extra rows are filled as -1
| Pixel properties | Quadrant properties | ||||||
|---|---|---|---|---|---|---|---|
| Quadrant | DetID | PixID | Counts | Sigma | Mean | Median | Sigma |
| A | 15 | 169 | 103689 | 4660.03 | 97 | 95 | 22.2 |
| A | 10 | 83 | 36077 | 1618.6 | 97 | 95 | 22.2 |
| A | 7 | 16 | 3663 | 160.5 | 97 | 95 | 22.2 |
| B | 5 | 172 | 766517 | 51044.41 | 67 | 66 | 15.0 |
| B | 5 | 236 | 497324 | 33116.59 | 67 | 66 | 15.0 |
| B | 12 | 111 | 1460 | 92.84 | 67 | 66 | 15.0 |
| C | 0 | 10 | 169332 | 7164.07 | 94 | 95 | 23.6 |
| C | 15 | 214 | 39177 | 1654.4 | 94 | 95 | 23.6 |
| C | 3 | 233 | 2762 | 112.9 | 94 | 95 | 23.6 |
| D | 13 | 249 | 44042 | 1762.29 | 93 | 90 | 24.9 |
| D | 7 | 80 | 30818 | 1232.06 | 93 | 90 | 24.9 |
| D | 8 | 195 | 23493 | 938.36 | 93 | 90 | 24.9 |
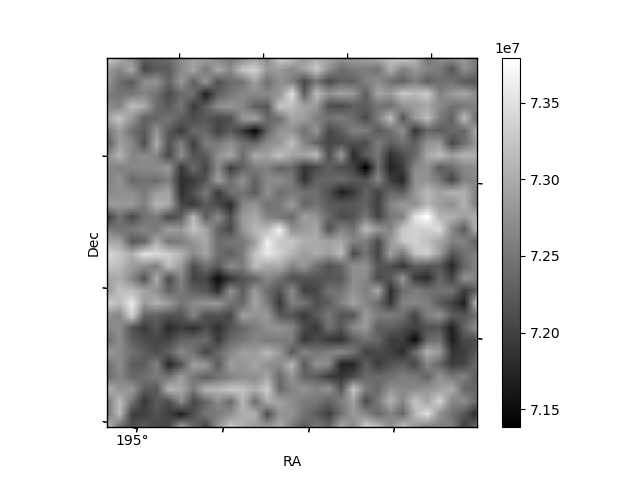
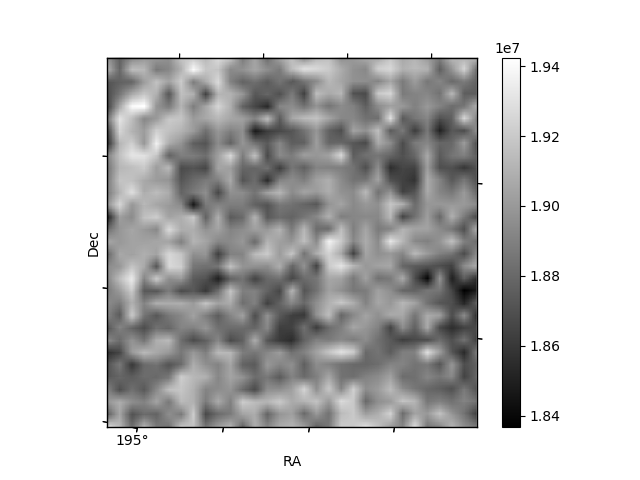
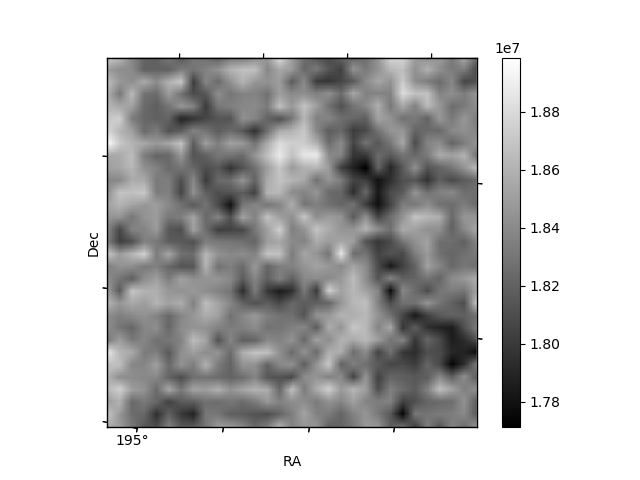
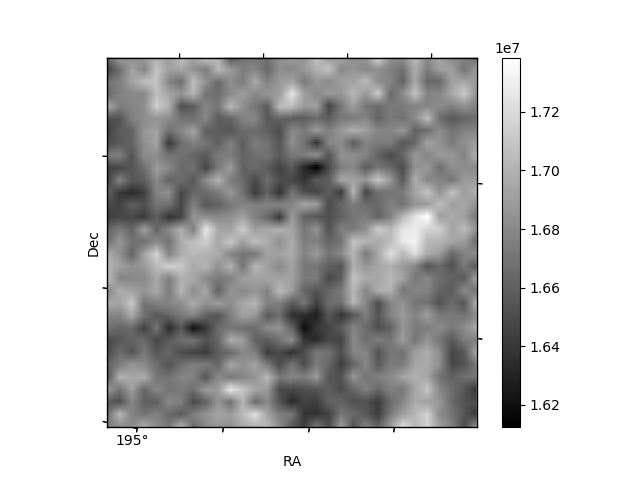
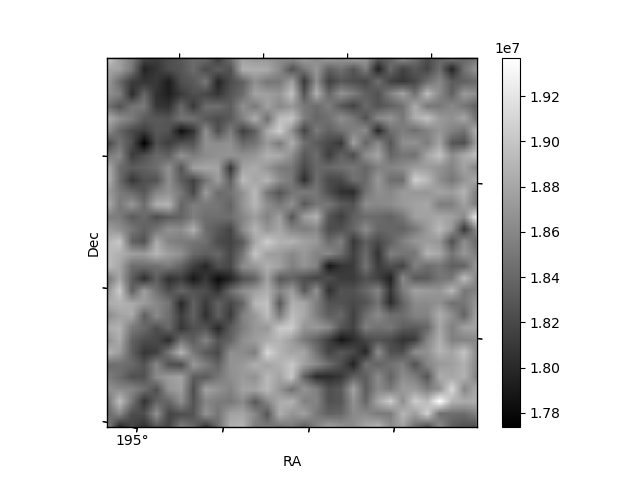
Histogram calculated using DETX and DETY for each event in the final _common_clean file
| Quadrant A | 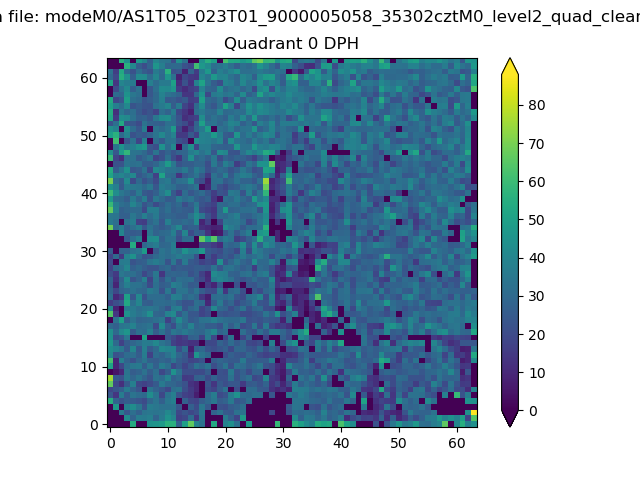 |
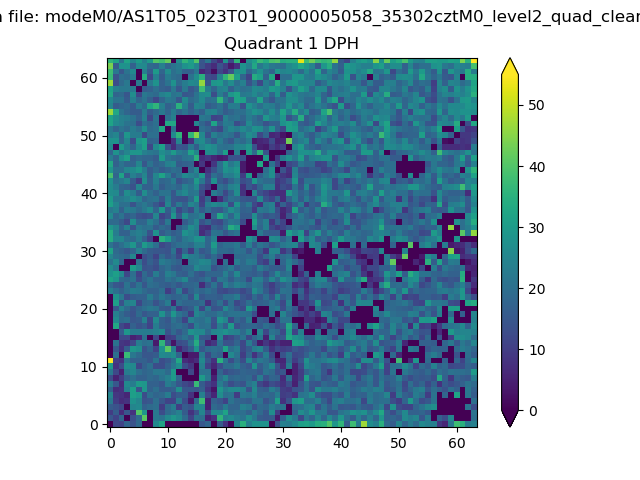 |
Quadrant B |
|---|---|---|---|
| Quadrant D | 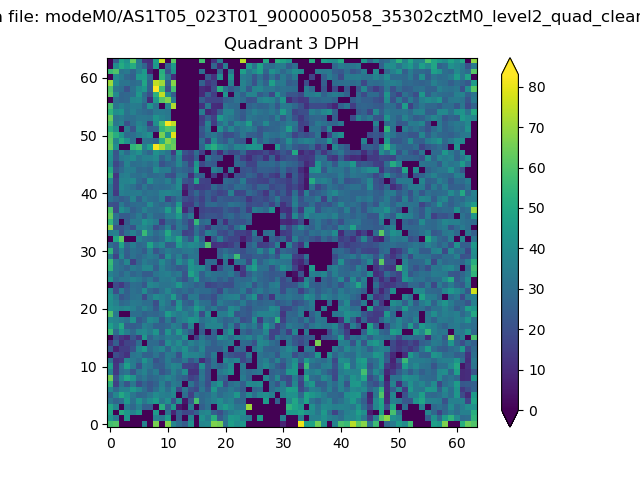 |
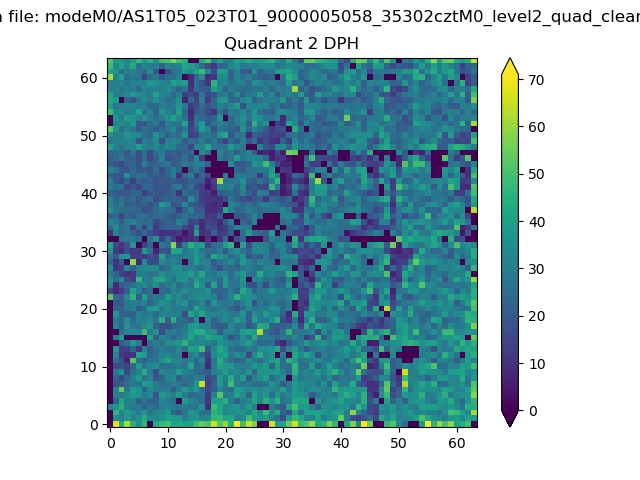 |
Quadrant C |
| Plot type | Count rate plots | Images |
|---|---|---|
| Comparison with Poisson distribution Blue bars denote a histogram of data divided into 1 sec bins. Red curve is a Poisson curve with rate = median count rate of data. |
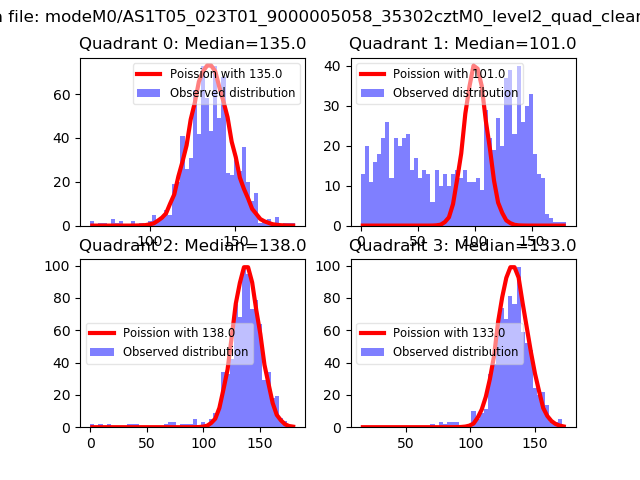 |
 |
| Quadrant-wise count rates Data is divided into 100 sec bins |
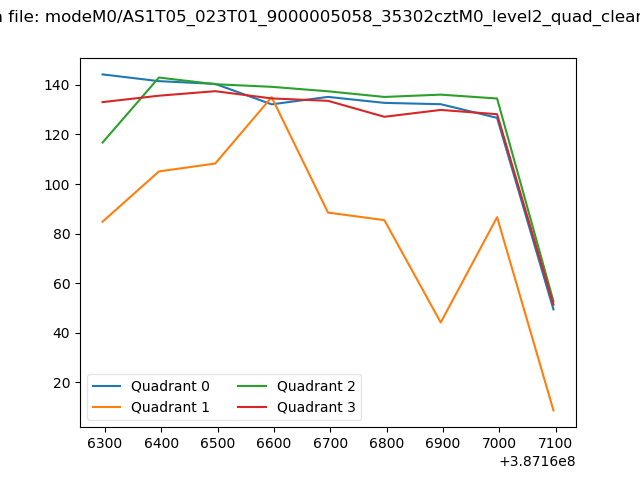 |
|
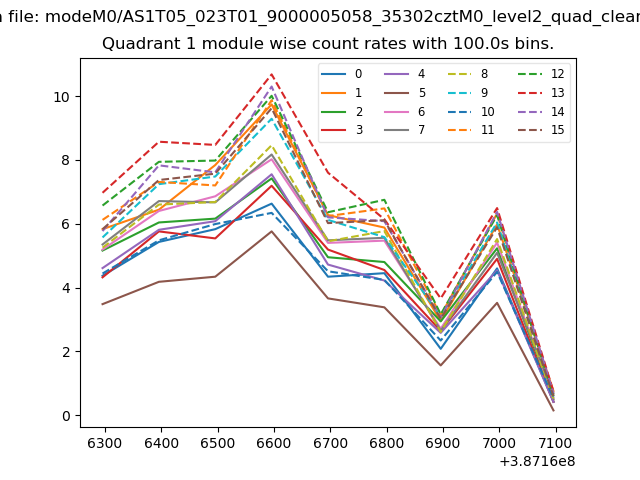
| Module-wise count rates for Quadrant A Data is divided into 100 sec bins |
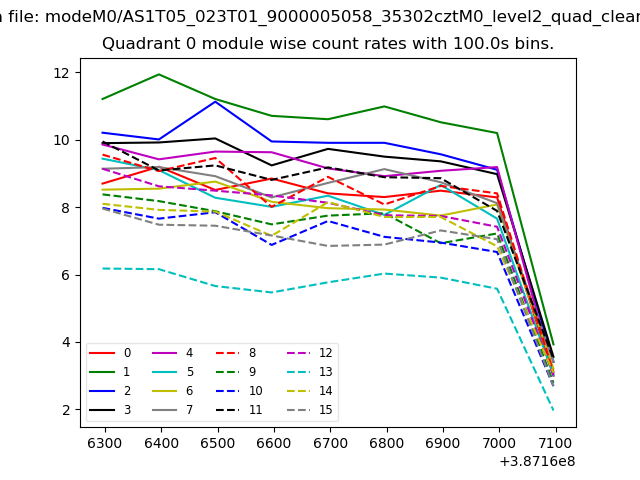 |
 |
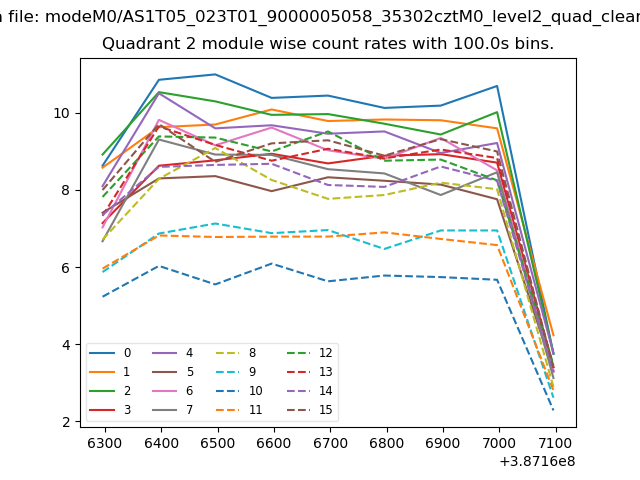
| Module-wise count rates for Quadrant B Data is divided into 100 sec bins |
 |
 |
| Module-wise count rates for Quadrant C Data is divided into 100 sec bins |
 |
 |
| Module-wise count rates for Quadrant D Data is divided into 100 sec bins |
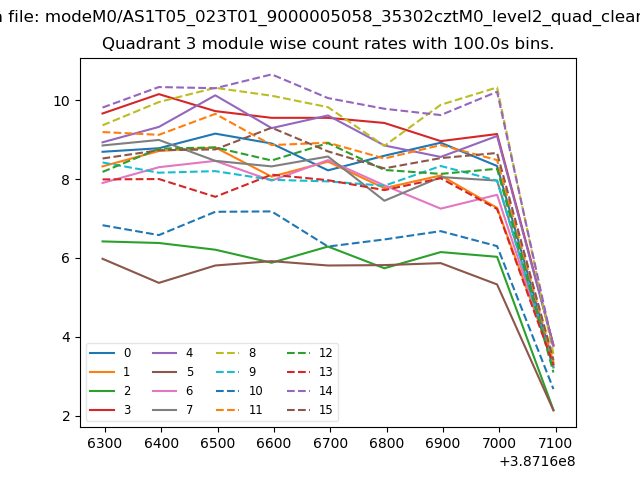 |
 |
| Parameter | Plot |
|---|---|
| CZT HV Monitor | 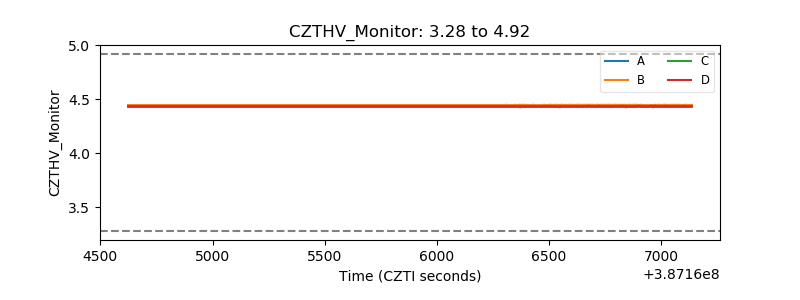 |
| D_VDD | 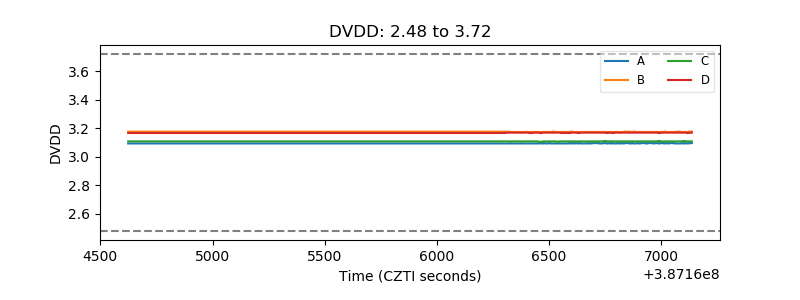 |
| Temperature 1 | 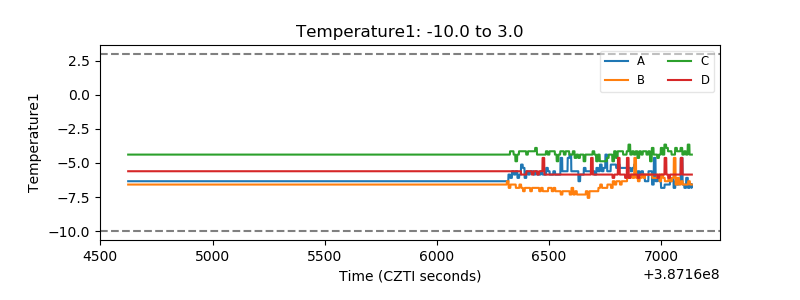 |
| Veto HV Monitor |  |
| Veto LLD | 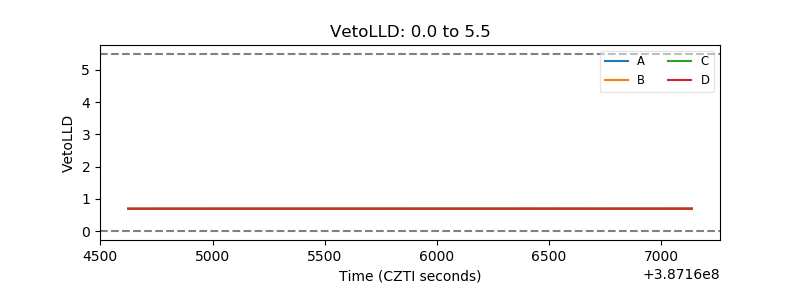 |
| Alpha Counter | 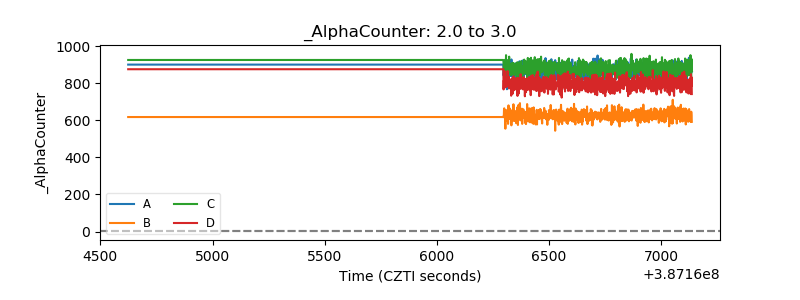 |
| _CPM_Rate | 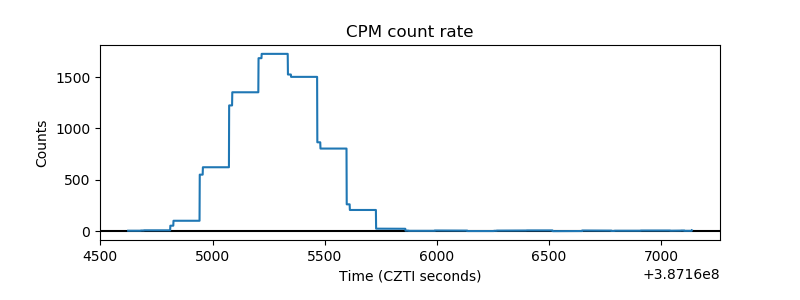 |
| CZT Counter | 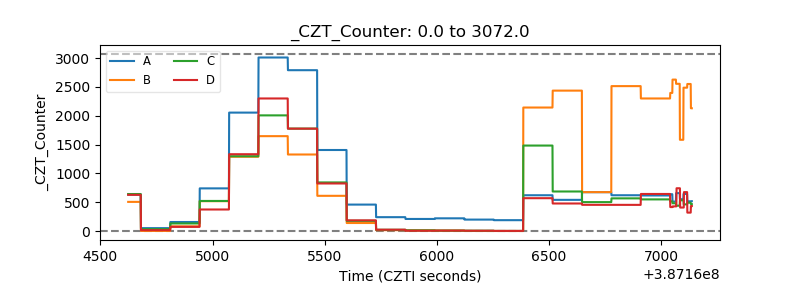 |
| +2.5 Volts monitor |  |
| +5 Volts monitor | 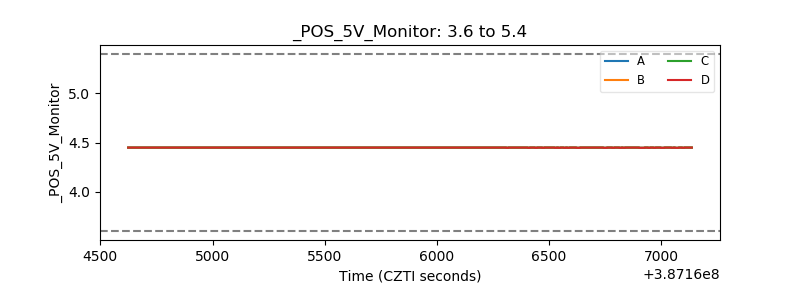 |
| _ROLL_ROT | 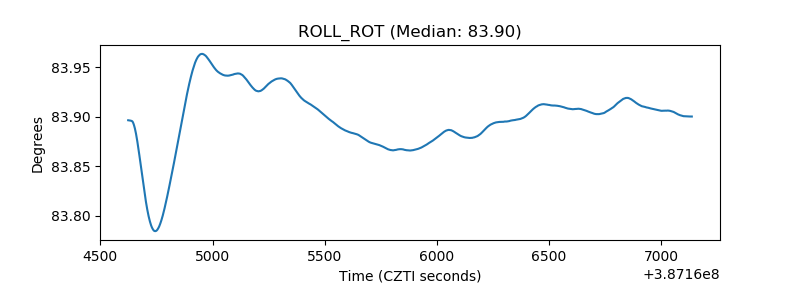 |
| _Roll_DEC | 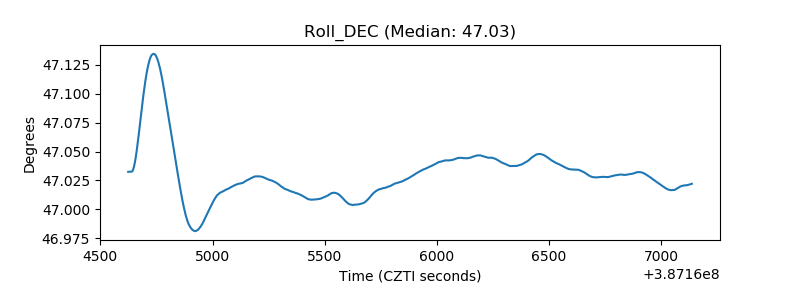 |
| _Roll_RA | 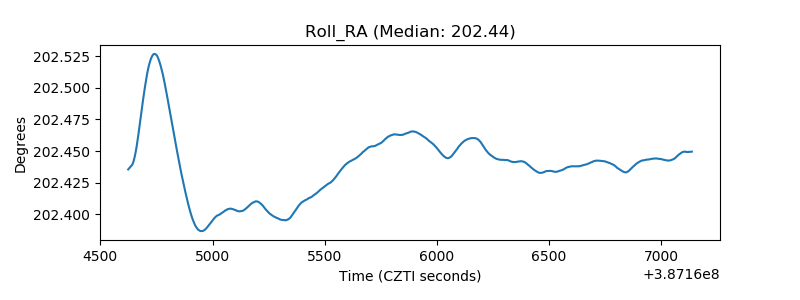 |
| Veto Counter | 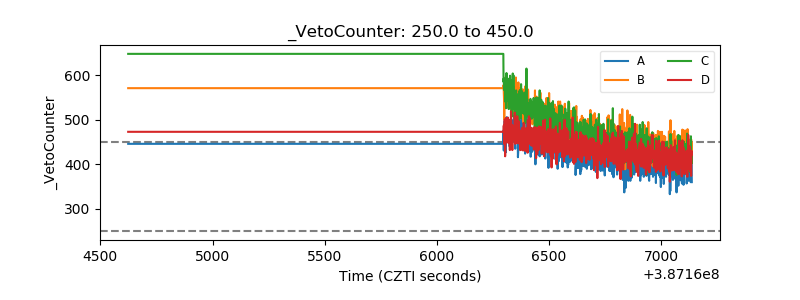 |