| Param | Original file | Final file |
|---|---|---|
| Filename | modeM0/AS1T05_023T01_9000005058cztM0_level2_bc.evt | modeM0/AS1T05_023T01_9000005058cztM0_level2_quad_clean.evt |
| Size (bytes) | 4,935,680,640 | 952,770,240 |
| Size | 4.6 GB | 908.6 MB |
| Events in quadrant A | 25,518,498 | 6,333,298 |
| Events in quadrant B | 54,658,995 | 5,409,007 |
| Events in quadrant C | 23,135,622 | 6,303,099 |
| Events in quadrant D | 40,990,881 | 5,581,594 |
| Mode M0 | |||
|---|---|---|---|
| Quadrant | BADHDUFLAG | Total packets | Discarded packets |
| A | 0 | 185457 | 0 |
| B | 0 | 340062 | 0 |
| C | 0 | 172599 | 0 |
| D | 0 | 250567 | 0 |
| Mode M9 | |||
|---|---|---|---|
| Quadrant | BADHDUFLAG | Total packets | Discarded packets |
| A | 0 | 297 | 0 |
| B | 0 | 297 | 0 |
| C | 0 | 297 | 0 |
| D | 0 | 297 | 0 |
| Mode SS | |||
|---|---|---|---|
| Quadrant | BADHDUFLAG | Total packets | Discarded packets |
| A | 0 | 1554 | 0 |
| B | 0 | 1554 | 0 |
| C | 0 | 1554 | 0 |
| D | 0 | 1554 | 0 |
| Quadrant | Total seconds | Saturated seconds | Saturation percentage |
|---|---|---|---|
| A | 76158 | 740 | 0.971664% |
| B | 76158 | 22407 | 29.421729% |
| C | 76158 | 983 | 1.290738% |
| D | 76158 | 7079 | 9.295150% |
Noise dominated data is calculated using 1-second bins in cleaned event files. If a bin has >2000 counts, and if more than 50% of those come from <1% of pixels, then it is considered to be noise-dominated and hence unusable.
| Quadrant | # 1 sec bins | Bins with >0 counts | Bins with >2000 counts | High rate bins dominated by noise | Noise dominated (total time) | Noise dominated (detector-on time) | Marked lightcurve |
|---|---|---|---|---|---|---|---|
| A | 104216 | 76172 | 104 | 104 | 0.10% | 0.14% | 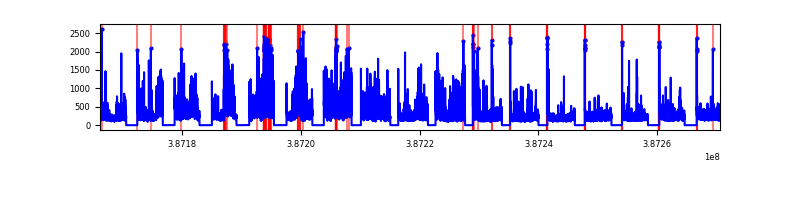 |
| B | 104215 | 76119 | 275 | 275 | 0.26% | 0.36% | 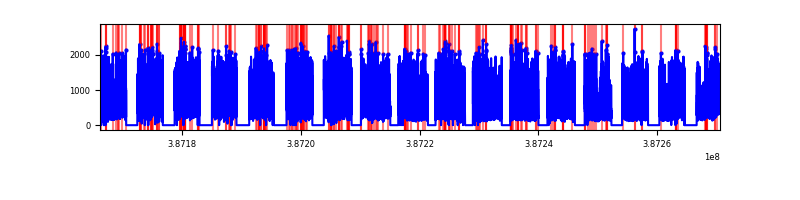 |
| C | 104215 | 76157 | 173 | 173 | 0.17% | 0.23% | 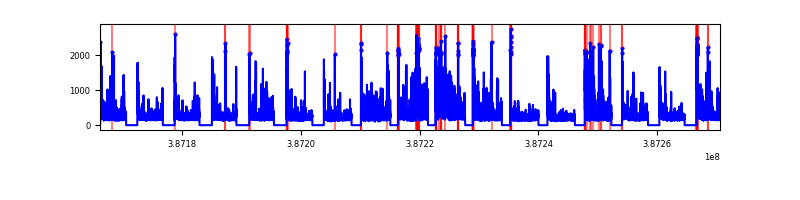 |
| D | 104215 | 76130 | 1336 | 1336 | 1.28% | 1.75% | 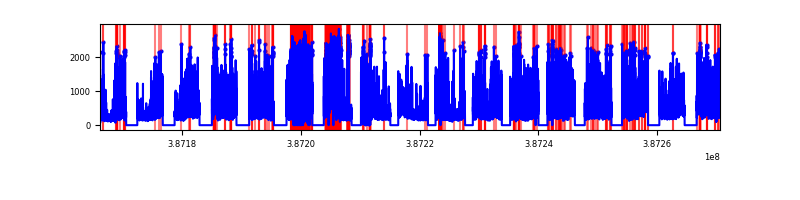 |
Top three noisy pixels from each quadrant. If the there are fewer than three noisy pixels in the level2.evt file, extra rows are filled as -1
| Pixel properties | Quadrant properties | ||||||
|---|---|---|---|---|---|---|---|
| Quadrant | DetID | PixID | Counts | Sigma | Mean | Median | Sigma |
| A | 15 | 169 | 8454662 | 9676.89 | 3971 | 3913 | 873.3 |
| A | 10 | 83 | 973614 | 1110.4 | 3971 | 3913 | 873.3 |
| A | 9 | 143 | 188258 | 211.09 | 3971 | 3913 | 873.3 |
| B | 5 | 236 | 27813295 | 39841.01 | 3494 | 3424 | 698.0 |
| B | 5 | 172 | 12892841 | 18465.65 | 3494 | 3424 | 698.0 |
| B | 5 | 200 | 253416 | 358.14 | 3494 | 3424 | 698.0 |
| C | 15 | 214 | 2962449 | 3334.33 | 3880 | 3851 | 887.3 |
| C | 0 | 10 | 2702362 | 3041.21 | 3880 | 3851 | 887.3 |
| C | 4 | 254 | 963958 | 1082.04 | 3880 | 3851 | 887.3 |
| D | 8 | 195 | 6591631 | 7575.44 | 3720 | 3613 | 869.7 |
| D | 7 | 80 | 4641723 | 5333.28 | 3720 | 3613 | 869.7 |
| D | 10 | 203 | 4180834 | 4803.31 | 3720 | 3613 | 869.7 |
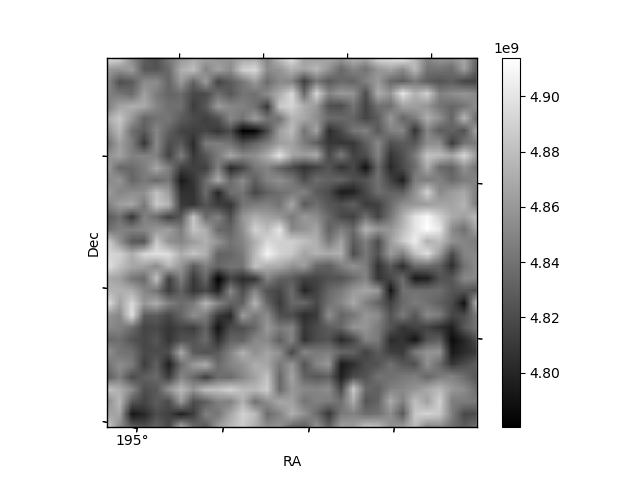
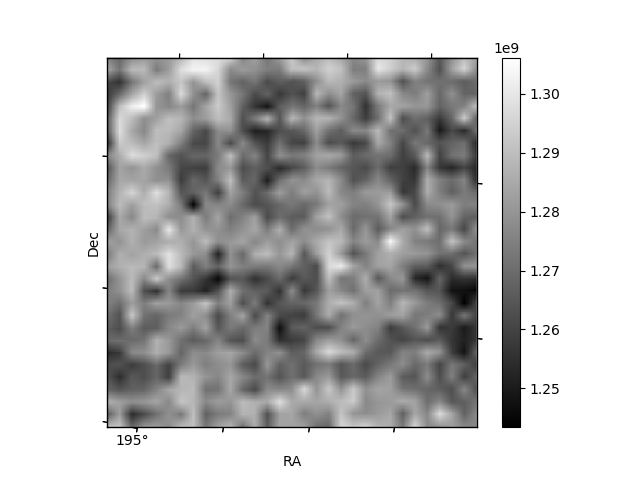
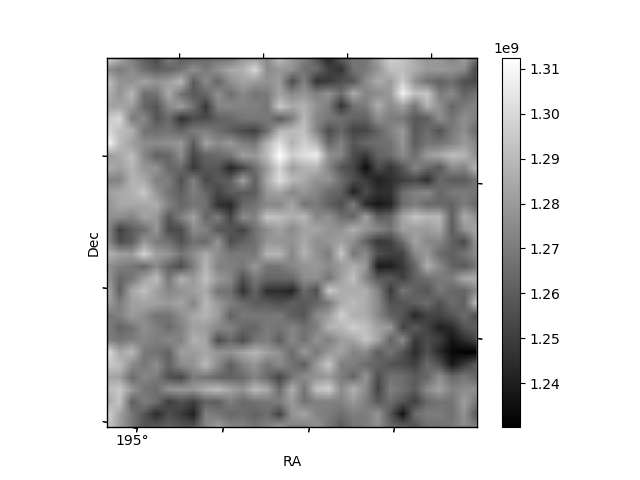
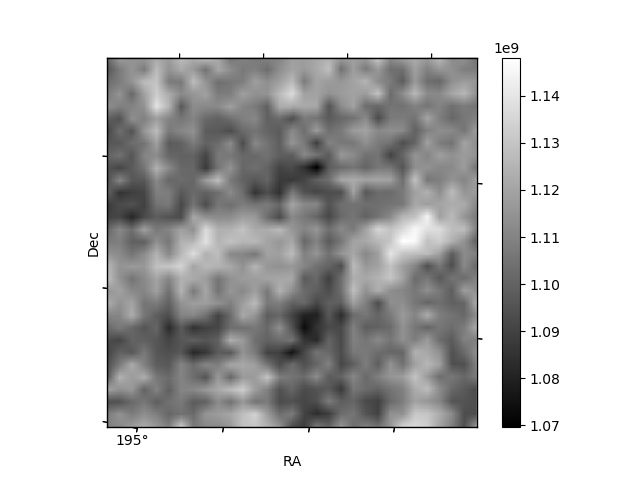
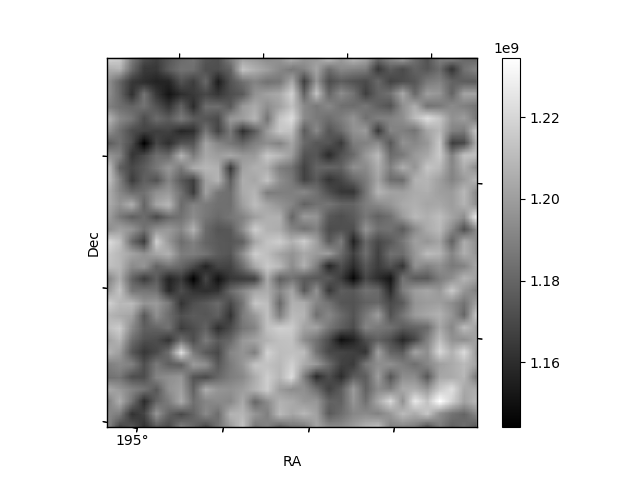
Histogram calculated using DETX and DETY for each event in the final _common_clean file
| Quadrant A | 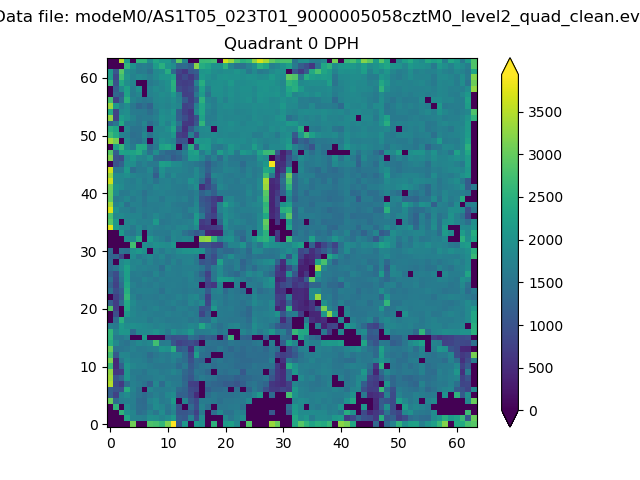 |
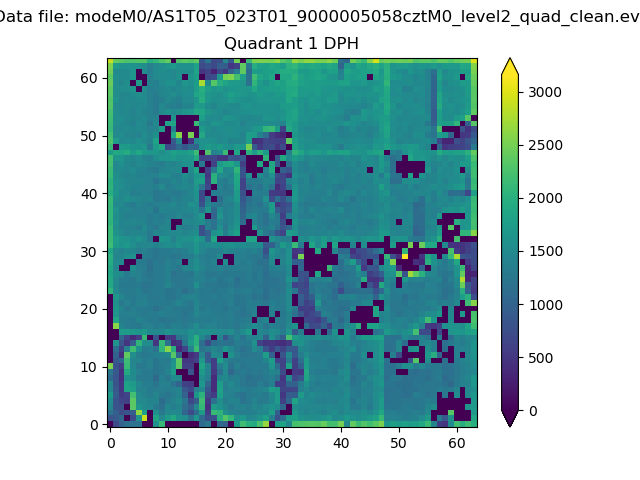 |
Quadrant B |
|---|---|---|---|
| Quadrant D | 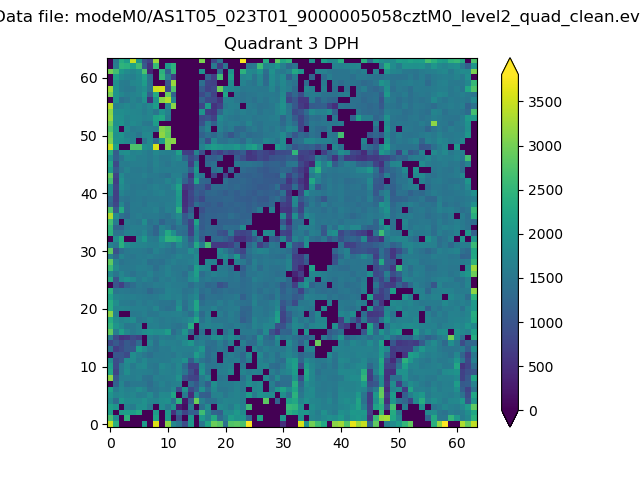 |
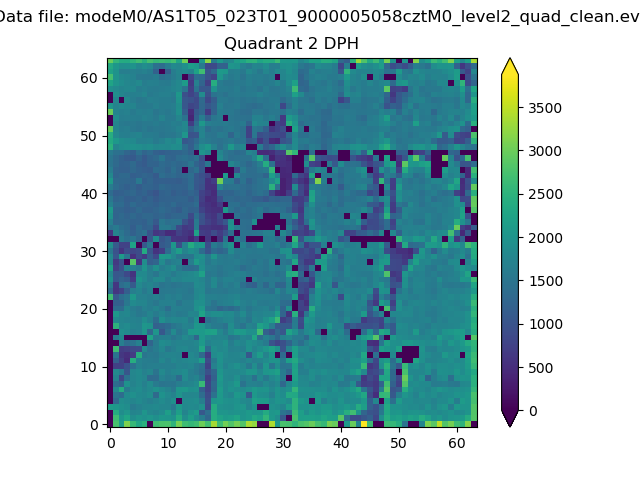 |
Quadrant C |
| Plot type | Count rate plots | Images |
|---|---|---|
| Comparison with Poisson distribution Blue bars denote a histogram of data divided into 1 sec bins. Red curve is a Poisson curve with rate = median count rate of data. |
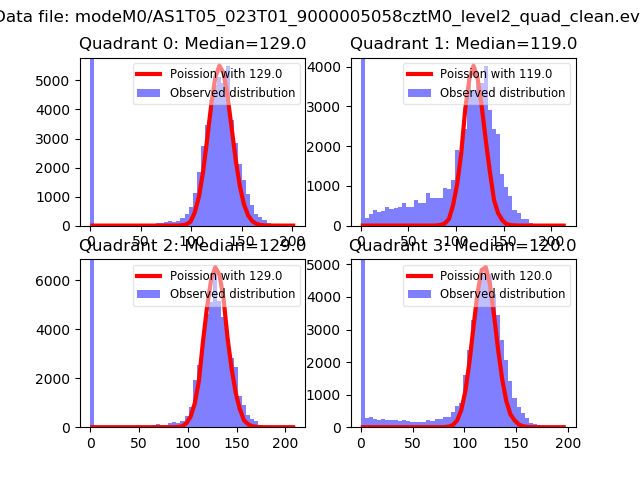 |
 |
| Quadrant-wise count rates Data is divided into 100 sec bins |
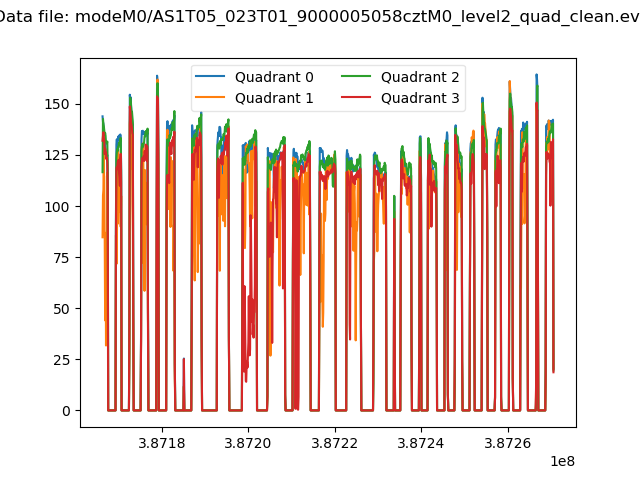 |
|
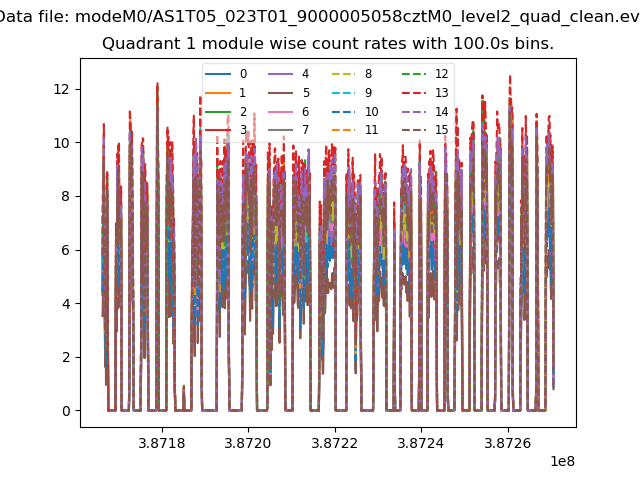
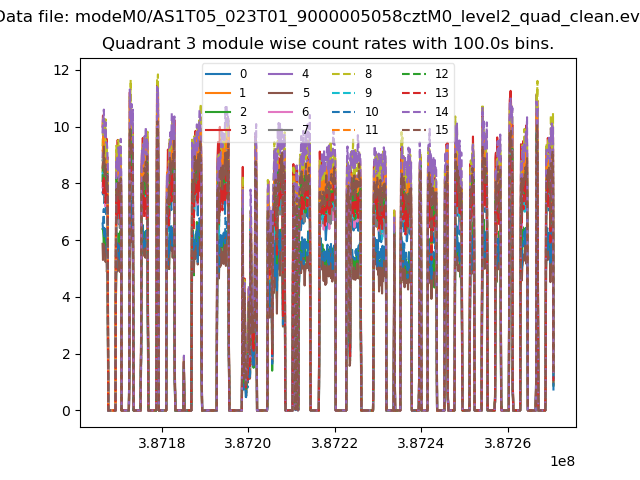
| Module-wise count rates for Quadrant A Data is divided into 100 sec bins |
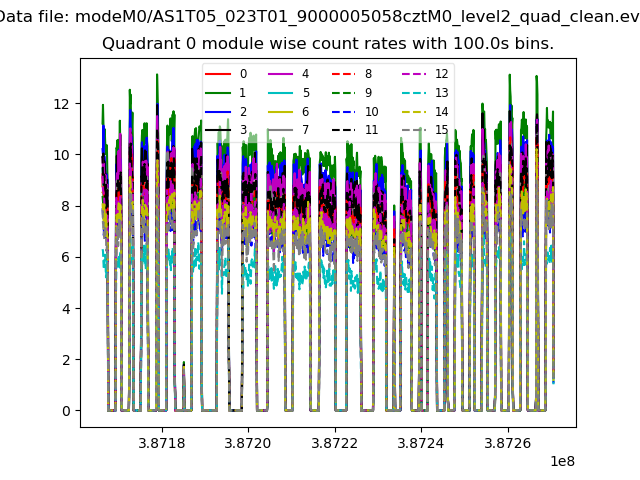 |
 |
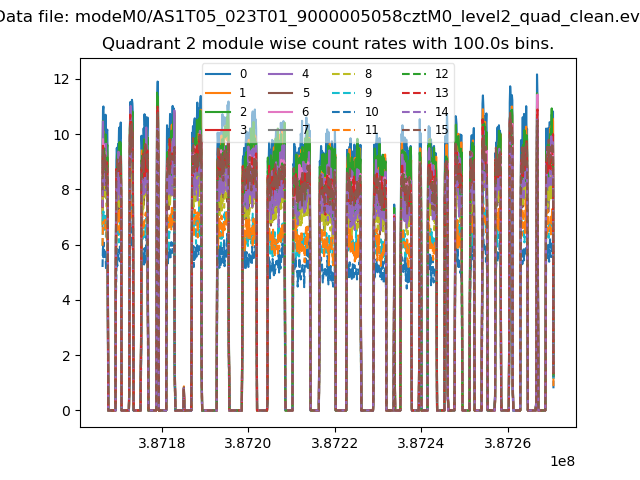
| Module-wise count rates for Quadrant B Data is divided into 100 sec bins |
 |
 |
| Module-wise count rates for Quadrant C Data is divided into 100 sec bins |
 |
 |
| Module-wise count rates for Quadrant D Data is divided into 100 sec bins |
 |
 |
| Parameter | Plot |
|---|---|
| CZT HV Monitor | 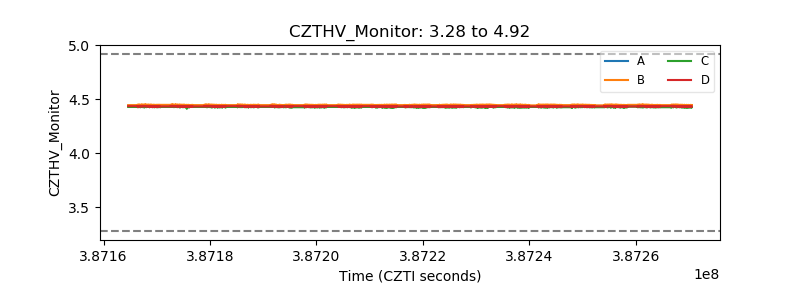 |
| D_VDD | 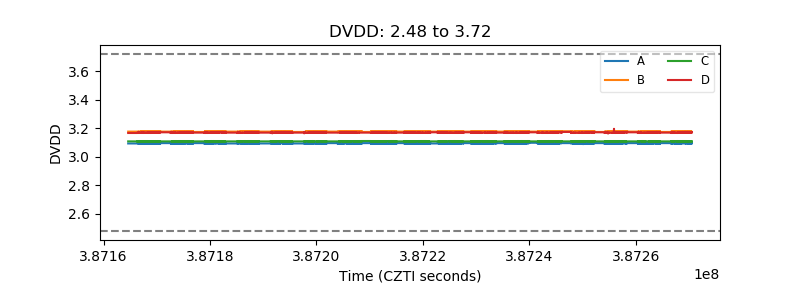 |
| Temperature 1 | 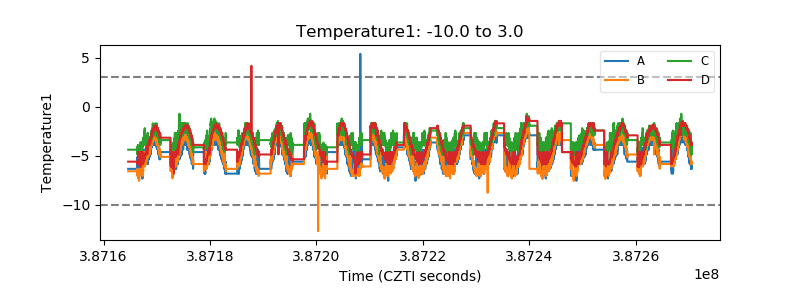 |
| Veto HV Monitor | 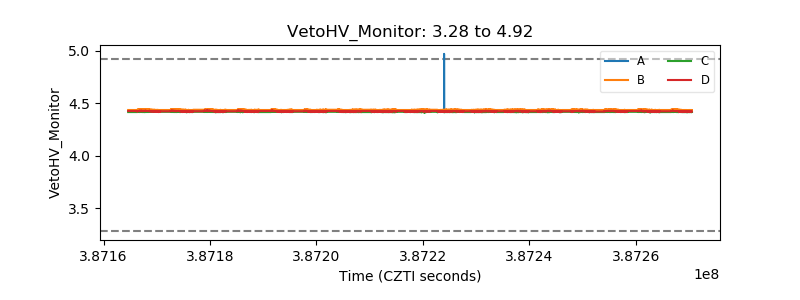 |
| Veto LLD | 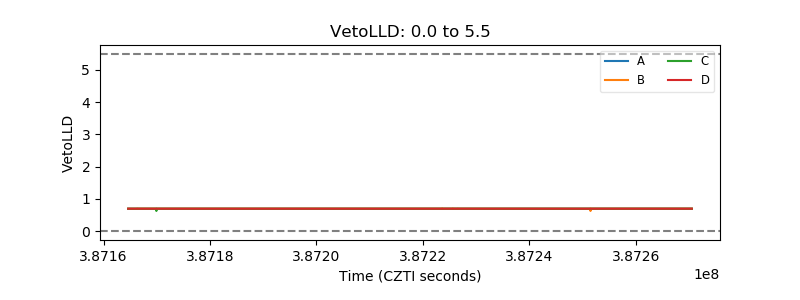 |
| Alpha Counter | 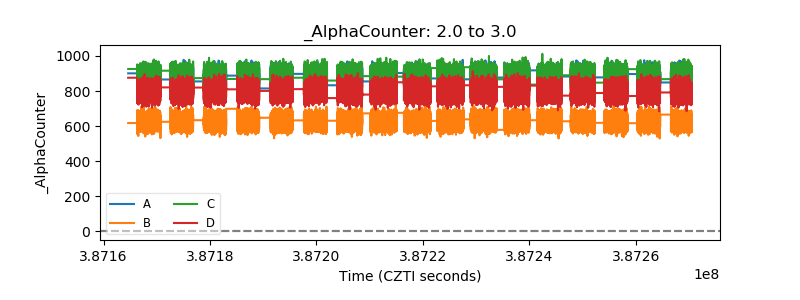 |
| _CPM_Rate | 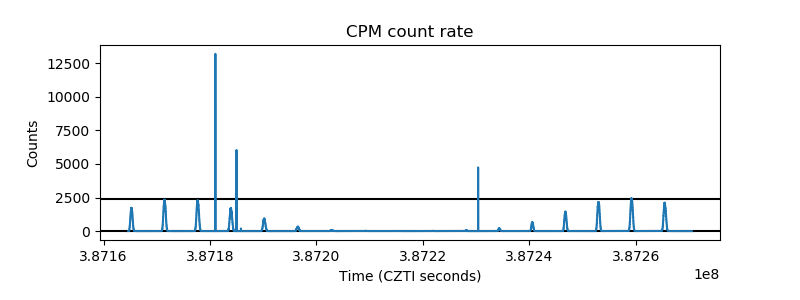 |
| CZT Counter | 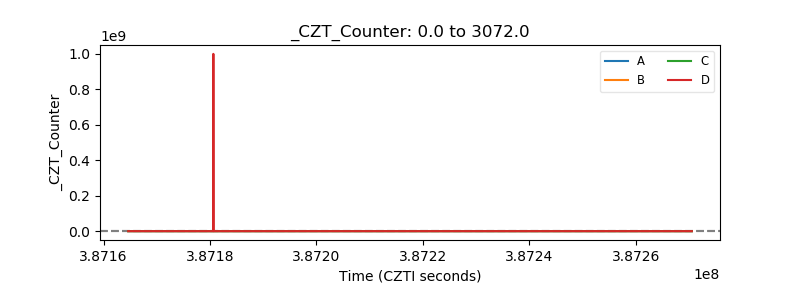 |
| +2.5 Volts monitor | 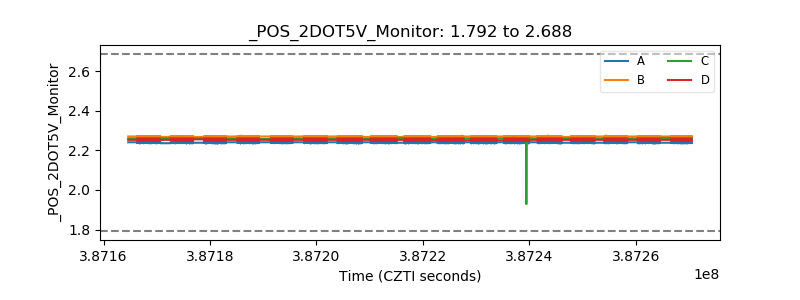 |
| +5 Volts monitor | 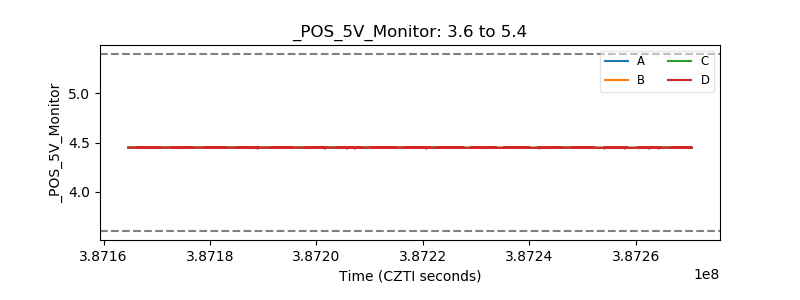 |
| _ROLL_ROT | 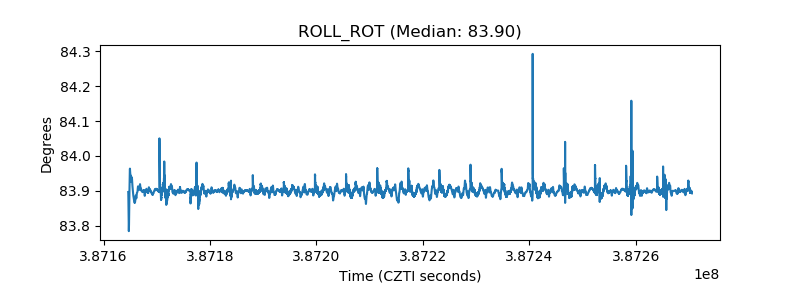 |
| _Roll_DEC | 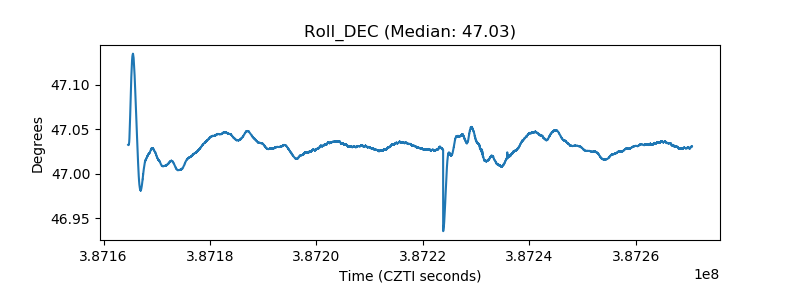 |
| _Roll_RA | 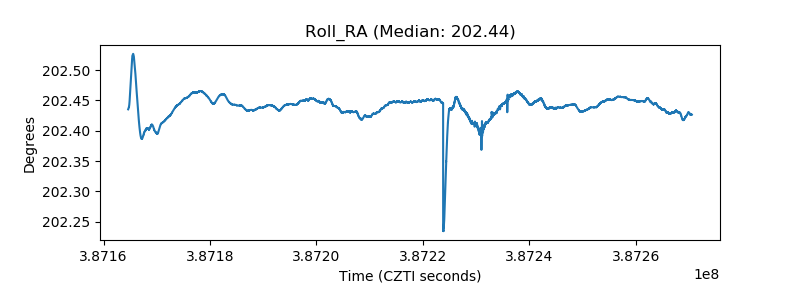 |
| Veto Counter | 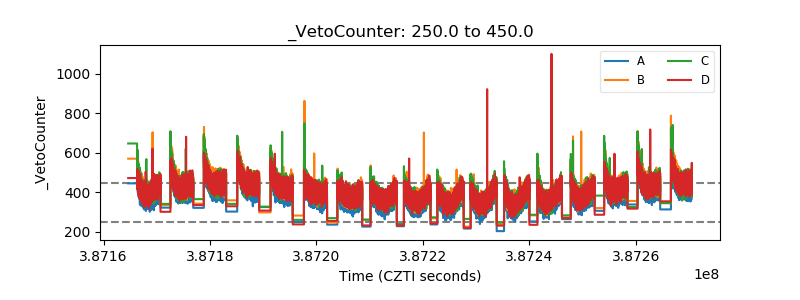 |