| Param | Original file | Final file |
|---|---|---|
| Filename | modeM0/AS1A11_082T01_9000005056_35302cztM0_level2.evt | modeM0/AS1A11_082T01_9000005056_35302cztM0_level2_quad_clean.evt |
| Size (bytes) | 317,315,520 | 52,436,160 |
| Size | 302.6 MB | 50.0 MB |
| Events in quadrant A | 1,944,421 | 345,875 |
| Events in quadrant B | 3,581,998 | 333,424 |
| Events in quadrant C | 1,795,587 | 349,675 |
| Events in quadrant D | 2,069,353 | 330,712 |
| Mode M0 | |||
|---|---|---|---|
| Quadrant | BADHDUFLAG | Total packets | Discarded packets |
| A | 0 | 8004 | 1 |
| B | 0 | 12826 | 1 |
| C | 0 | 7245 | 1 |
| D | 0 | 8295 | 1 |
| Mode SS | |||
|---|---|---|---|
| Quadrant | BADHDUFLAG | Total packets | Discarded packets |
| A | 0 | 64 | 0 |
| B | 0 | 64 | 0 |
| C | 0 | 64 | 0 |
| D | 0 | 64 | 0 |
| Mode M9 | |||
|---|---|---|---|
| Quadrant | BADHDUFLAG | Total packets | Discarded packets |
| A | 0 | 12 | 0 |
| B | 0 | 12 | 0 |
| C | 0 | 12 | 0 |
| D | 0 | 13 | 0 |
| Quadrant | Total seconds | Saturated seconds | Saturation percentage |
|---|---|---|---|
| A | 3204 | 52 | 1.622971% |
| B | 3204 | 589 | 18.383271% |
| C | 3204 | 57 | 1.779026% |
| D | 3204 | 104 | 3.245943% |
Noise dominated data is calculated using 1-second bins in cleaned event files. If a bin has >2000 counts, and if more than 50% of those come from <1% of pixels, then it is considered to be noise-dominated and hence unusable.
| Quadrant | # 1 sec bins | Bins with >0 counts | Bins with >2000 counts | High rate bins dominated by noise | Noise dominated (total time) | Noise dominated (detector-on time) | Marked lightcurve |
|---|---|---|---|---|---|---|---|
| A | 3204 | 3204 | 46 | 46 | 1.44% | 1.44% | 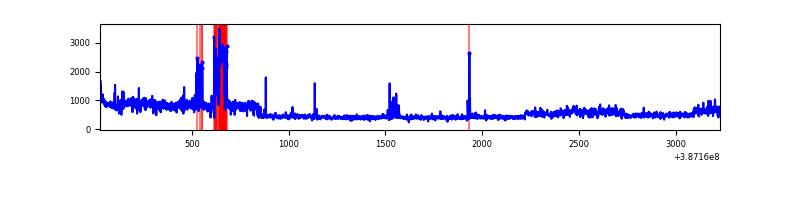 |
| B | 3204 | 3204 | 494 | 494 | 15.42% | 15.42% | 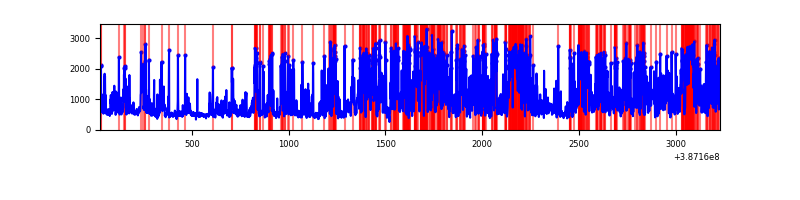 |
| C | 3204 | 3204 | 41 | 41 | 1.28% | 1.28% | 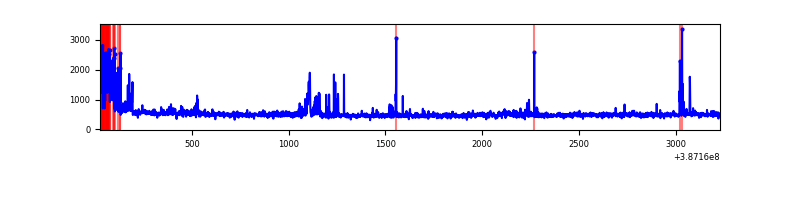 |
| D | 3204 | 3204 | 96 | 96 | 3.00% | 3.00% | 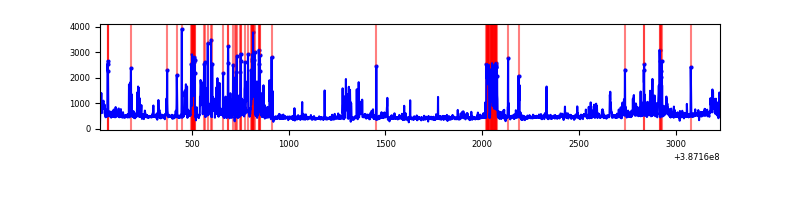 |
Top three noisy pixels from each quadrant. If the there are fewer than three noisy pixels in the level2.evt file, extra rows are filled as -1
| Pixel properties | Quadrant properties | ||||||
|---|---|---|---|---|---|---|---|
| Quadrant | DetID | PixID | Counts | Sigma | Mean | Median | Sigma |
| A | 15 | 169 | 369757 | 5129.2 | 353 | 346 | 72.0 |
| A | 7 | 16 | 134584 | 1863.87 | 353 | 346 | 72.0 |
| A | 10 | 83 | 50869 | 701.5 | 353 | 346 | 72.0 |
| B | 5 | 236 | 1914887 | 29728.06 | 332 | 323 | 64.4 |
| B | 5 | 172 | 347231 | 5386.55 | 332 | 323 | 64.4 |
| B | 4 | 232 | 12127 | 183.28 | 332 | 323 | 64.4 |
| C | 0 | 10 | 244546 | 2922.51 | 354 | 358 | 83.6 |
| C | 15 | 214 | 132067 | 1576.33 | 354 | 358 | 83.6 |
| C | 9 | 69 | 17787 | 208.59 | 354 | 358 | 83.6 |
| D | 7 | 80 | 341460 | 4013.2 | 349 | 338 | 85.0 |
| D | 2 | 250 | 159291 | 1870.03 | 349 | 338 | 85.0 |
| D | 13 | 249 | 100973 | 1183.94 | 349 | 338 | 85.0 |
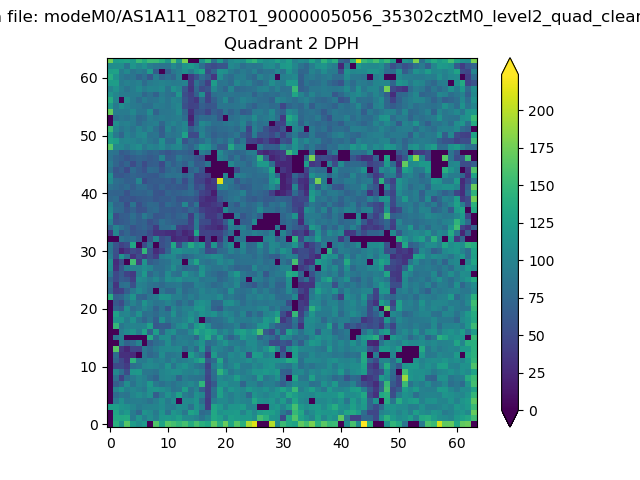
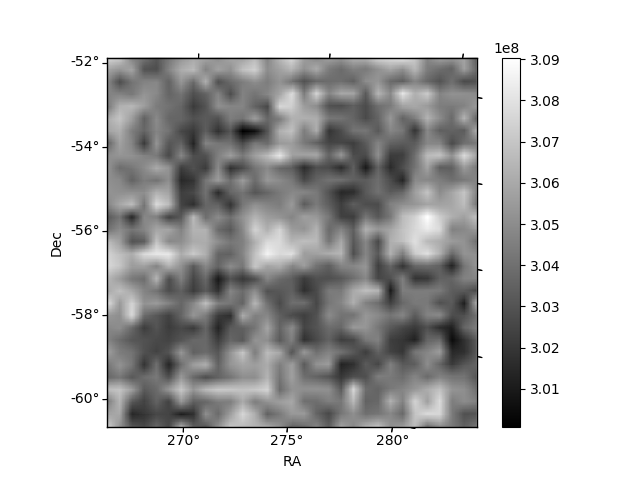
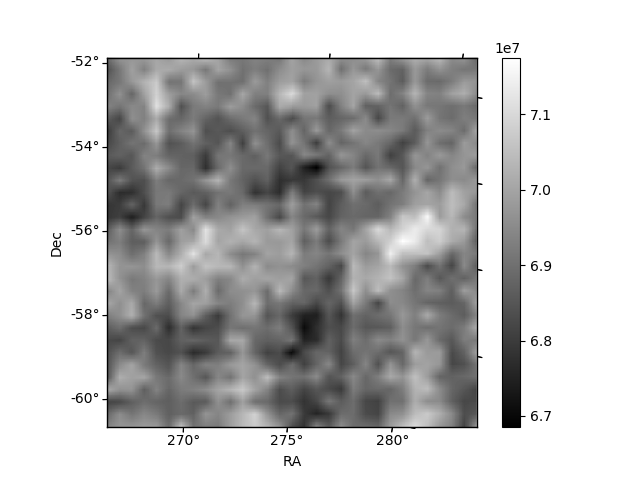
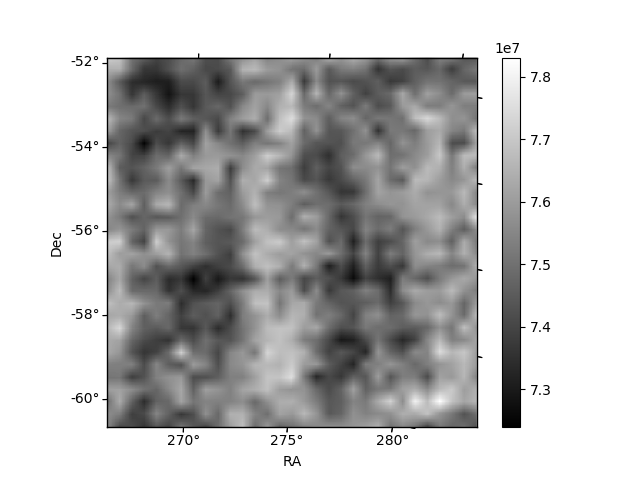
Histogram calculated using DETX and DETY for each event in the final _common_clean file
| Quadrant A | 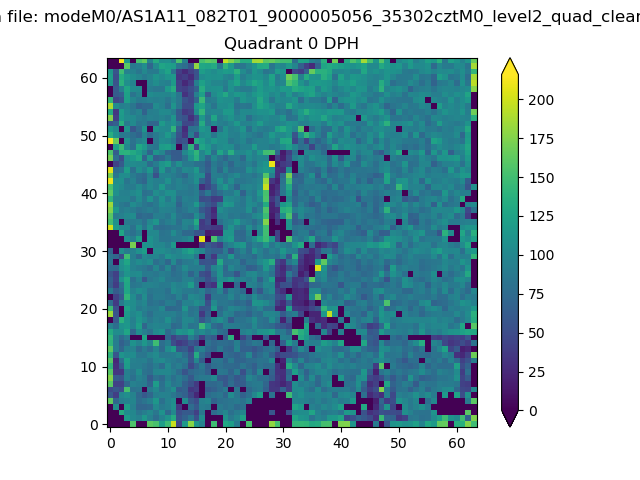 |
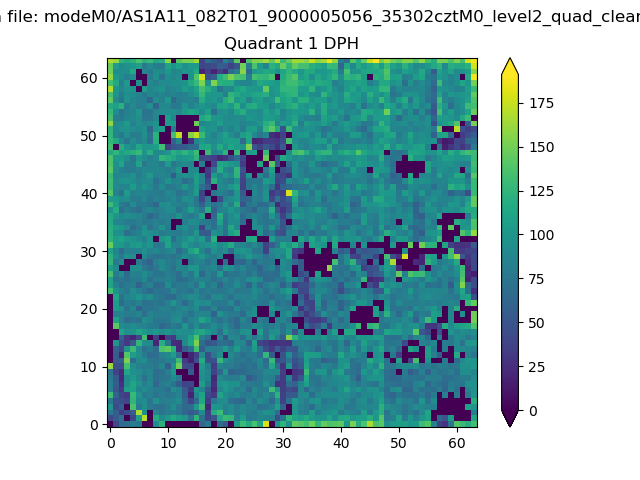 |
Quadrant B |
|---|---|---|---|
| Quadrant D | 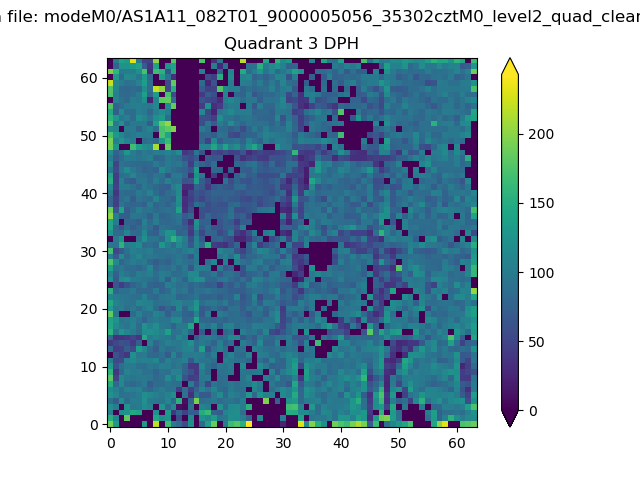 |
 |
Quadrant C |
| Plot type | Count rate plots | Images |
|---|---|---|
| Comparison with Poisson distribution Blue bars denote a histogram of data divided into 1 sec bins. Red curve is a Poisson curve with rate = median count rate of data. |
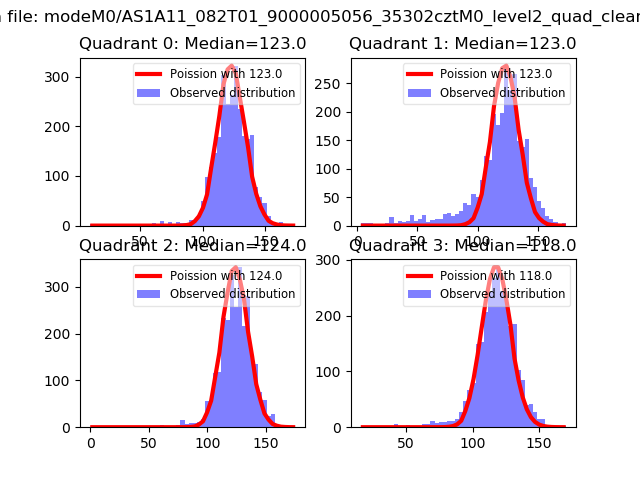 |
 |
| Quadrant-wise count rates Data is divided into 100 sec bins |
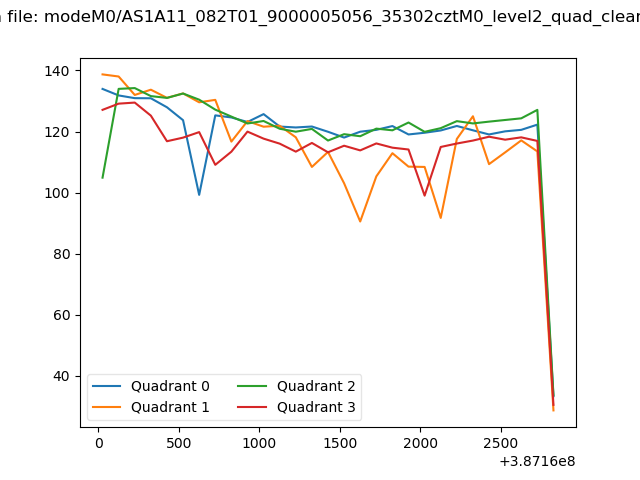 |
|
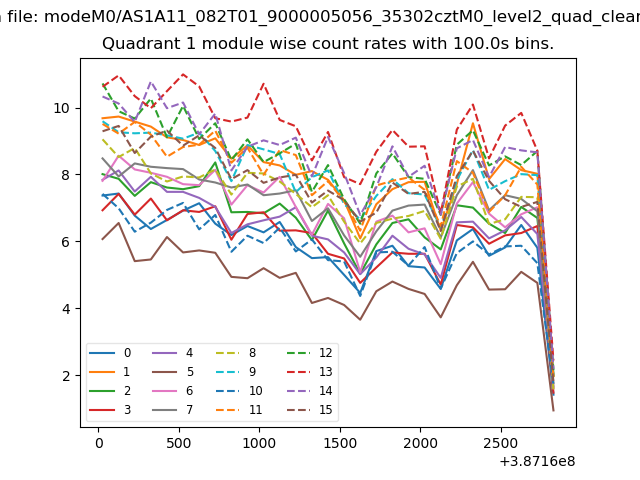
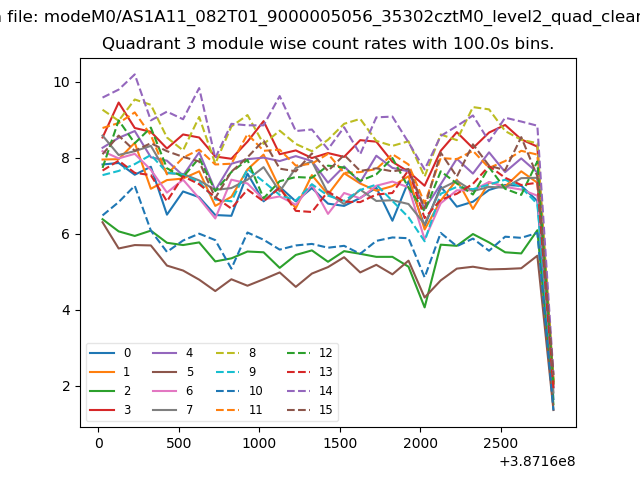
| Module-wise count rates for Quadrant A Data is divided into 100 sec bins |
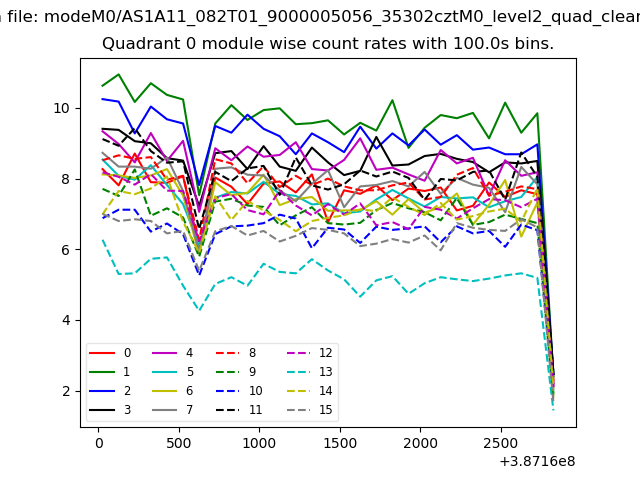 |
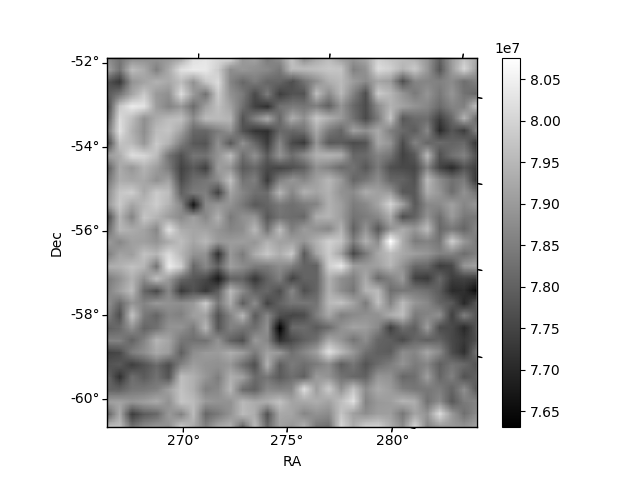 |
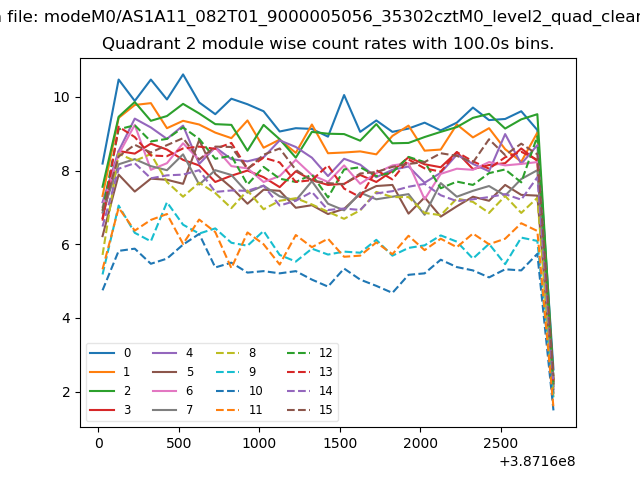
| Module-wise count rates for Quadrant B Data is divided into 100 sec bins |
 |
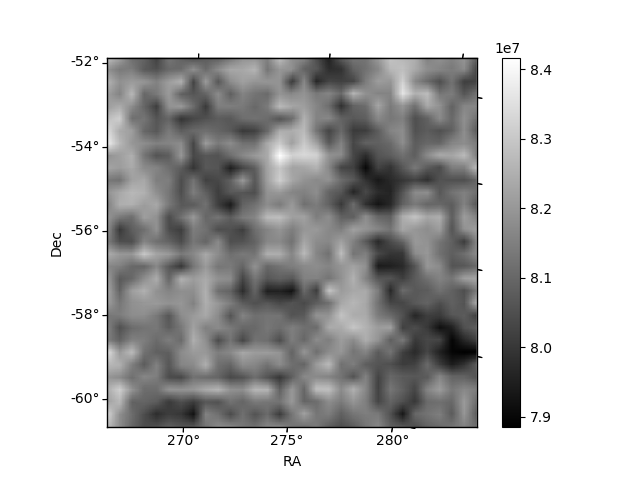 |
| Module-wise count rates for Quadrant C Data is divided into 100 sec bins |
 |
 |
| Module-wise count rates for Quadrant D Data is divided into 100 sec bins |
 |
 |
| Parameter | Plot |
|---|---|
| CZT HV Monitor | 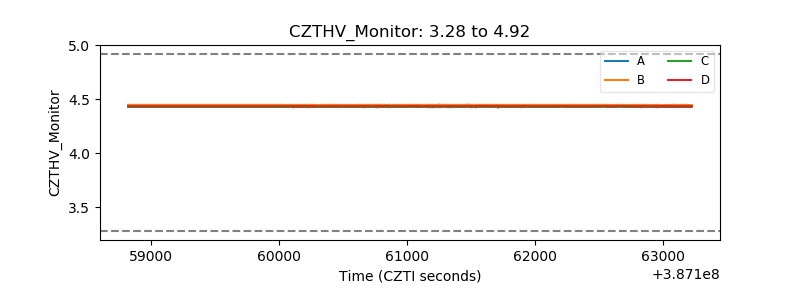 |
| D_VDD | 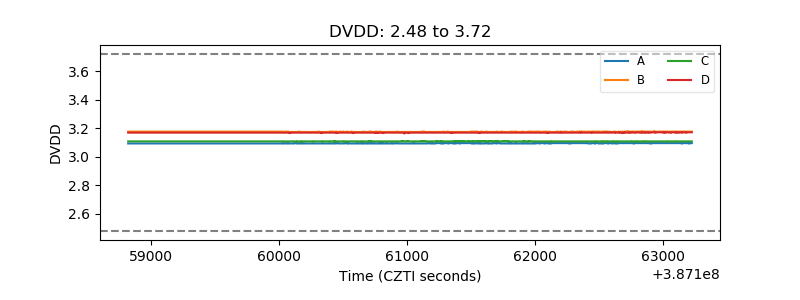 |
| Temperature 1 | 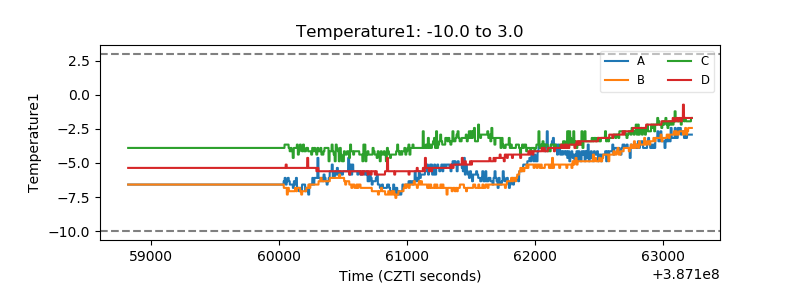 |
| Veto HV Monitor | 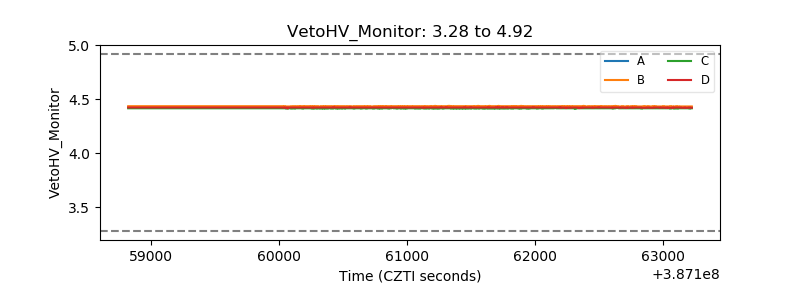 |
| Veto LLD | 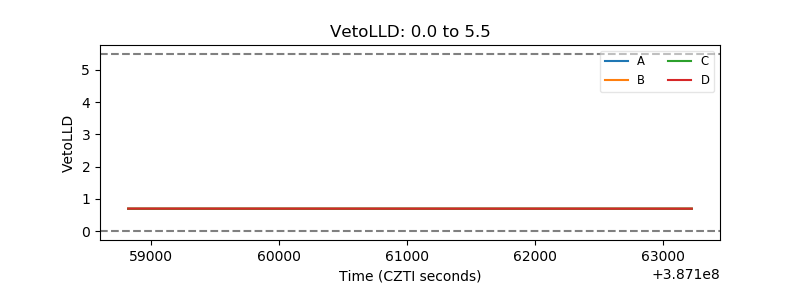 |
| Alpha Counter | 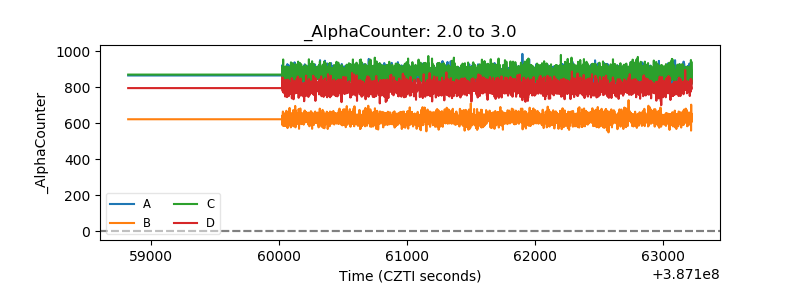 |
| _CPM_Rate | 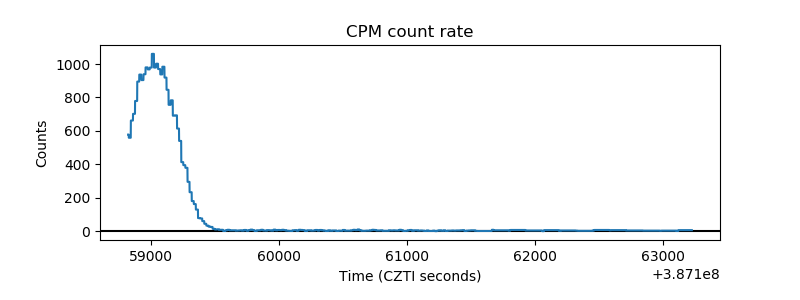 |
| CZT Counter | 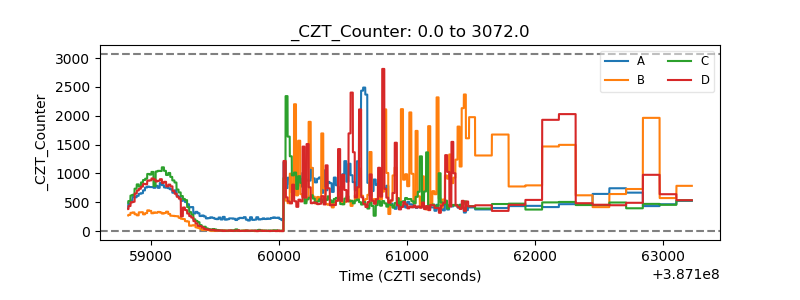 |
| +2.5 Volts monitor | 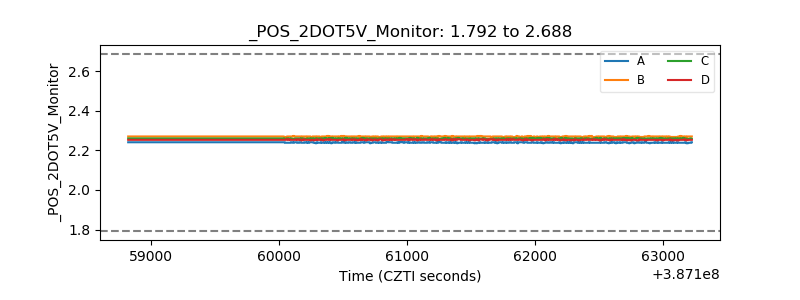 |
| +5 Volts monitor | 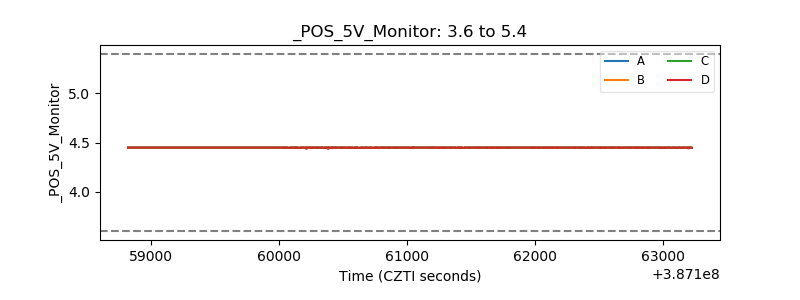 |
| _ROLL_ROT | 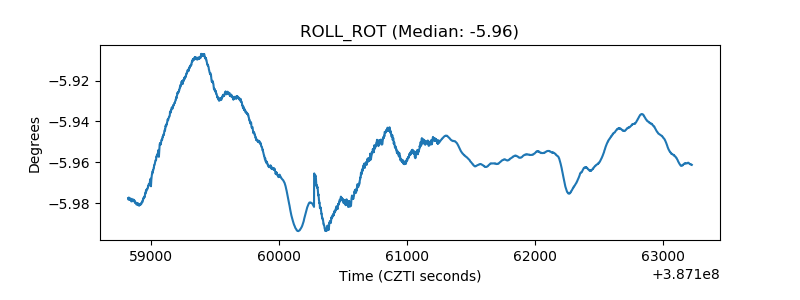 |
| _Roll_DEC | 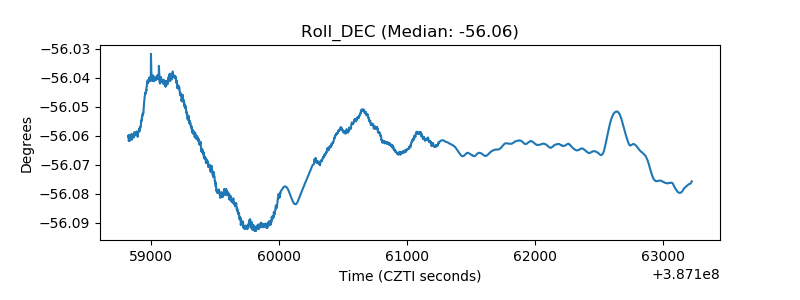 |
| _Roll_RA | 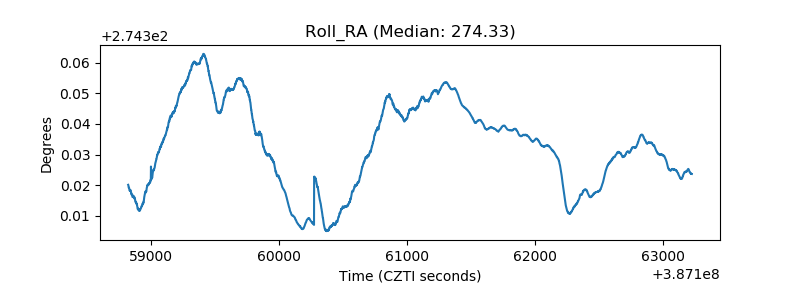 |
| Veto Counter | 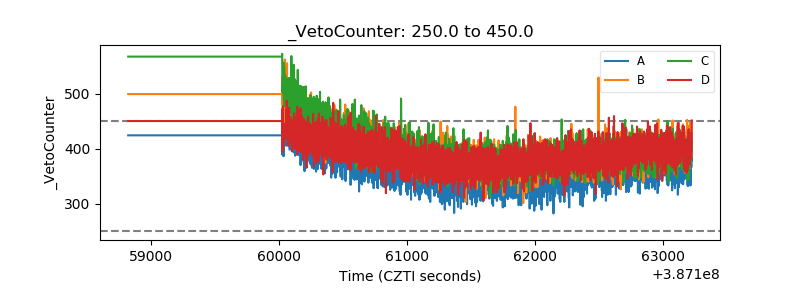 |