| Param | Original file | Final file |
|---|---|---|
| Filename | modeM0/AS1A11_082T01_9000005056_35299cztM0_level2.evt | modeM0/AS1A11_082T01_9000005056_35299cztM0_level2_quad_clean.evt |
| Size (bytes) | 1,768,953,600 | 205,845,120 |
| Size | 1.6 GB | 196.3 MB |
| Events in quadrant A | 7,068,305 | 1,439,124 |
| Events in quadrant B | 20,221,851 | 1,214,105 |
| Events in quadrant C | 8,241,906 | 1,412,404 |
| Events in quadrant D | 17,057,600 | 1,156,444 |
| Mode M0 | |||
|---|---|---|---|
| Quadrant | BADHDUFLAG | Total packets | Discarded packets |
| A | 0 | 30788 | 3 |
| B | 0 | 70158 | 3 |
| C | 0 | 33367 | 3 |
| D | 0 | 60576 | 3 |
| Mode SS | |||
|---|---|---|---|
| Quadrant | BADHDUFLAG | Total packets | Discarded packets |
| A | 0 | 298 | 0 |
| B | 0 | 298 | 0 |
| C | 0 | 298 | 0 |
| D | 0 | 298 | 0 |
| Mode M9 | |||
|---|---|---|---|
| Quadrant | BADHDUFLAG | Total packets | Discarded packets |
| A | 0 | 30 | 0 |
| B | 0 | 29 | 0 |
| C | 0 | 29 | 0 |
| D | 0 | 30 | 0 |
| Quadrant | Total seconds | Saturated seconds | Saturation percentage |
|---|---|---|---|
| A | 14632 | 37 | 0.252870% |
| B | 14632 | 5096 | 34.827775% |
| C | 14632 | 173 | 1.182340% |
| D | 14632 | 3430 | 23.441771% |
Noise dominated data is calculated using 1-second bins in cleaned event files. If a bin has >2000 counts, and if more than 50% of those come from <1% of pixels, then it is considered to be noise-dominated and hence unusable.
| Quadrant | # 1 sec bins | Bins with >0 counts | Bins with >2000 counts | High rate bins dominated by noise | Noise dominated (total time) | Noise dominated (detector-on time) | Marked lightcurve |
|---|---|---|---|---|---|---|---|
| A | 17317 | 14634 | 8 | 8 | 0.05% | 0.05% | 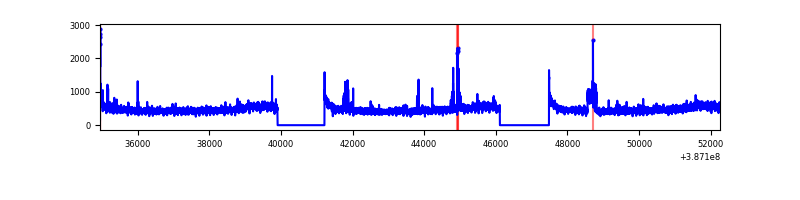 |
| B | 17316 | 14632 | 4009 | 4009 | 23.15% | 27.40% | 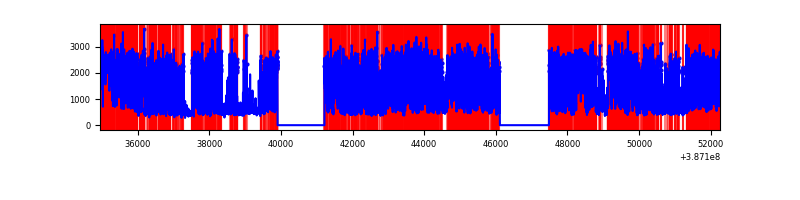 |
| C | 17317 | 14634 | 136 | 136 | 0.79% | 0.93% | 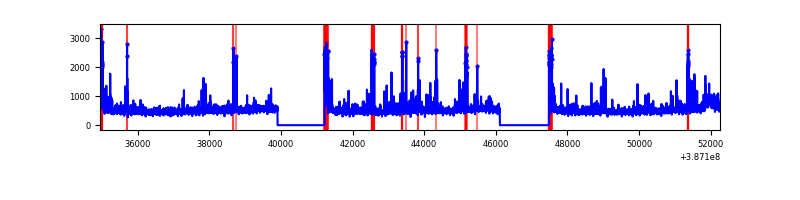 |
| D | 17316 | 14632 | 3176 | 3176 | 18.34% | 21.71% | 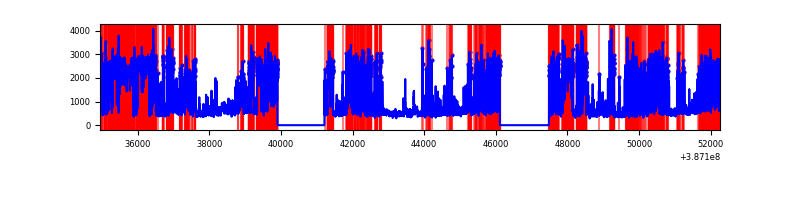 |
Top three noisy pixels from each quadrant. If the there are fewer than three noisy pixels in the level2.evt file, extra rows are filled as -1
| Pixel properties | Quadrant properties | ||||||
|---|---|---|---|---|---|---|---|
| Quadrant | DetID | PixID | Counts | Sigma | Mean | Median | Sigma |
| A | 15 | 169 | 222516 | 659.08 | 1678 | 1645 | 335.1 |
| A | 10 | 83 | 193328 | 571.98 | 1678 | 1645 | 335.1 |
| A | 7 | 3 | 78931 | 230.62 | 1678 | 1645 | 335.1 |
| B | 5 | 236 | 8725648 | 32037.29 | 1425 | 1387 | 272.3 |
| B | 5 | 172 | 5584794 | 20503.43 | 1425 | 1387 | 272.3 |
| B | 4 | 232 | 103900 | 376.45 | 1425 | 1387 | 272.3 |
| C | 0 | 10 | 650046 | 1717.48 | 1634 | 1645 | 377.5 |
| C | 15 | 214 | 593926 | 1568.83 | 1634 | 1645 | 377.5 |
| C | 3 | 233 | 472937 | 1248.35 | 1634 | 1645 | 377.5 |
| D | 7 | 80 | 9434307 | 27530.26 | 1418 | 1381 | 342.6 |
| D | 10 | 118 | 567652 | 1652.68 | 1418 | 1381 | 342.6 |
| D | 8 | 195 | 397095 | 1154.9 | 1418 | 1381 | 342.6 |
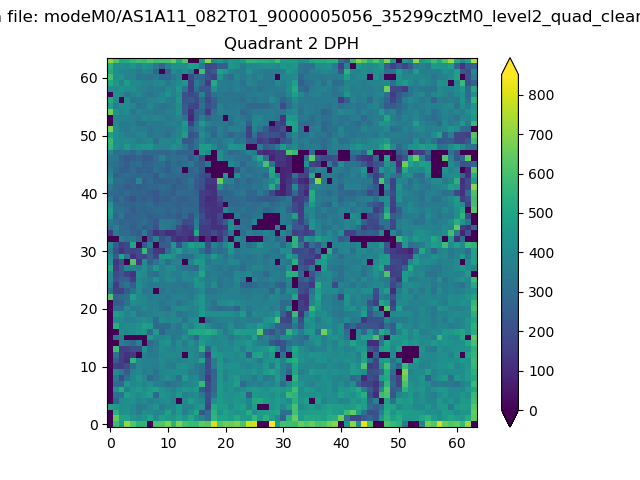
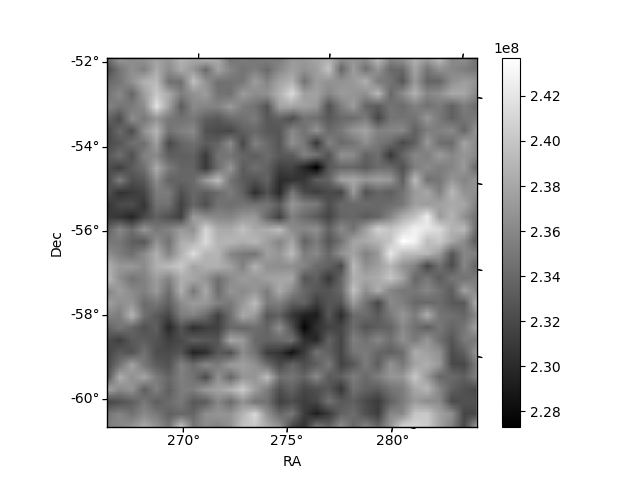
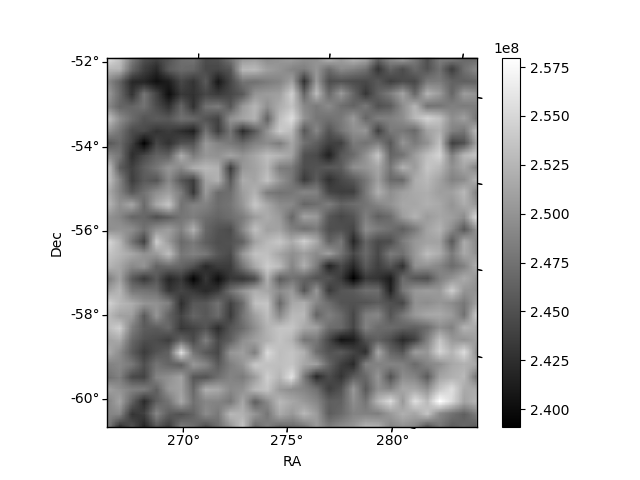
Histogram calculated using DETX and DETY for each event in the final _common_clean file
| Quadrant A | 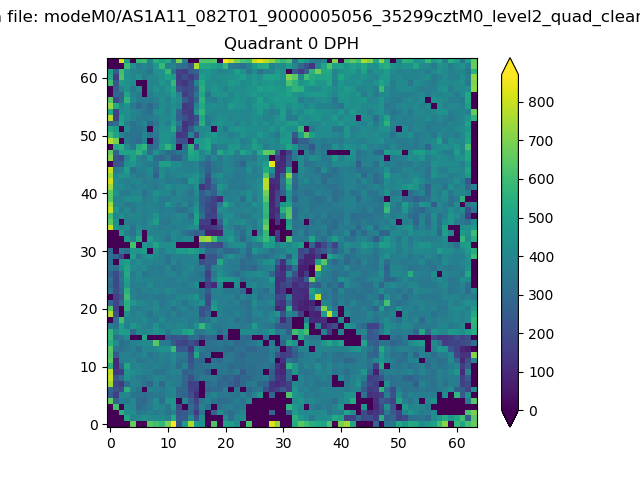 |
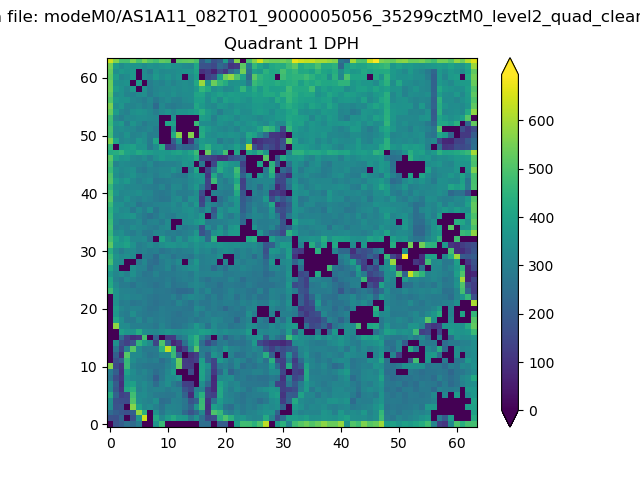 |
Quadrant B |
|---|---|---|---|
| Quadrant D | 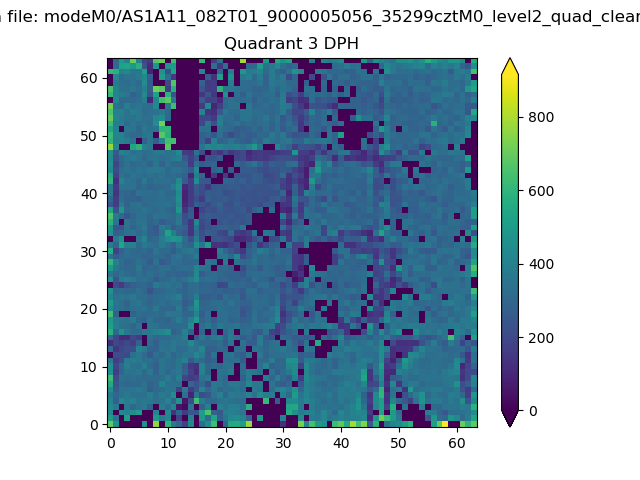 |
 |
Quadrant C |
| Plot type | Count rate plots | Images |
|---|---|---|
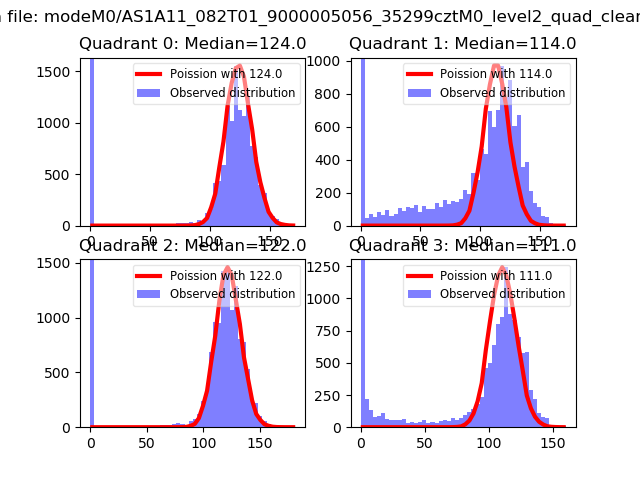
| Comparison with Poisson distribution Blue bars denote a histogram of data divided into 1 sec bins. Red curve is a Poisson curve with rate = median count rate of data. |
 |
 |
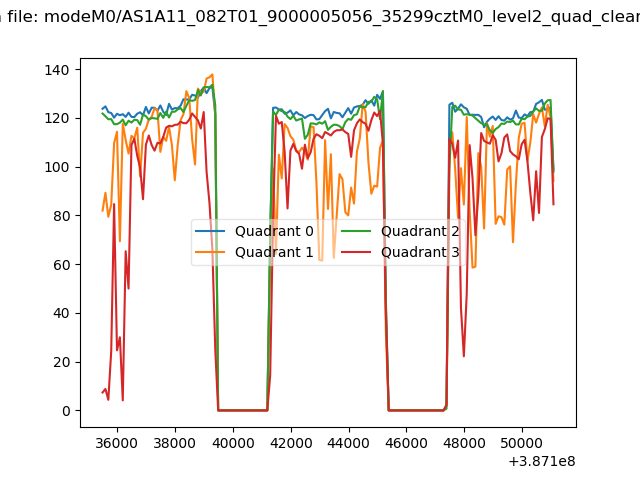
| Quadrant-wise count rates Data is divided into 100 sec bins |
 |
|
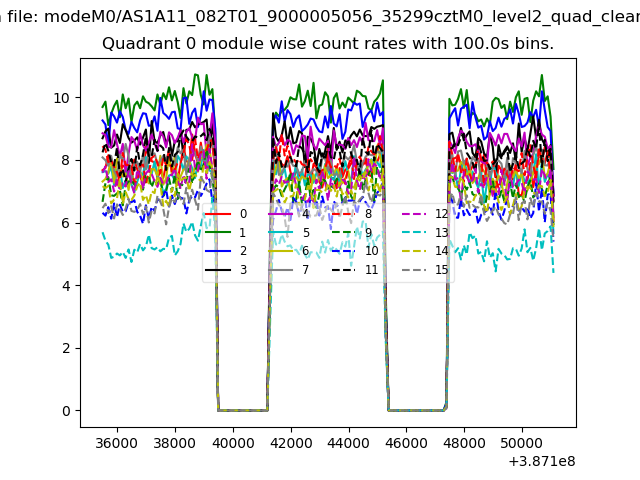
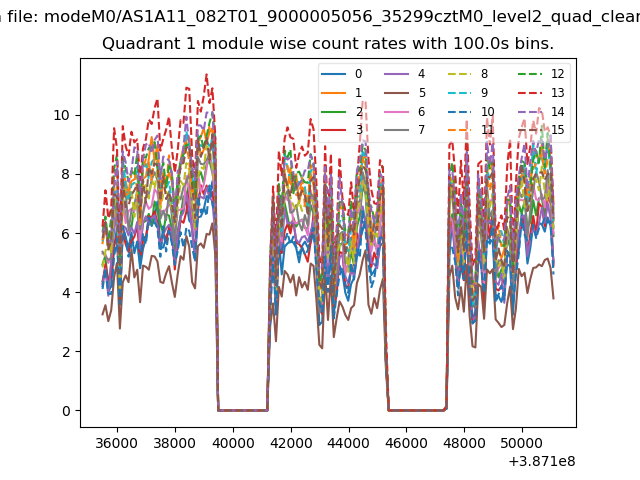
| Module-wise count rates for Quadrant A Data is divided into 100 sec bins |
 |
 |
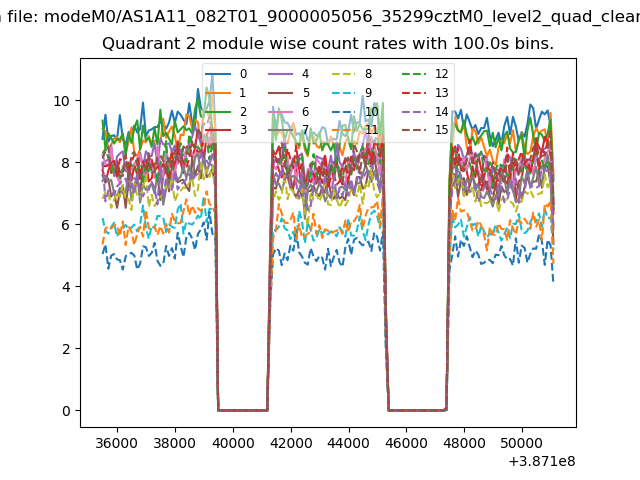
| Module-wise count rates for Quadrant B Data is divided into 100 sec bins |
 |
 |
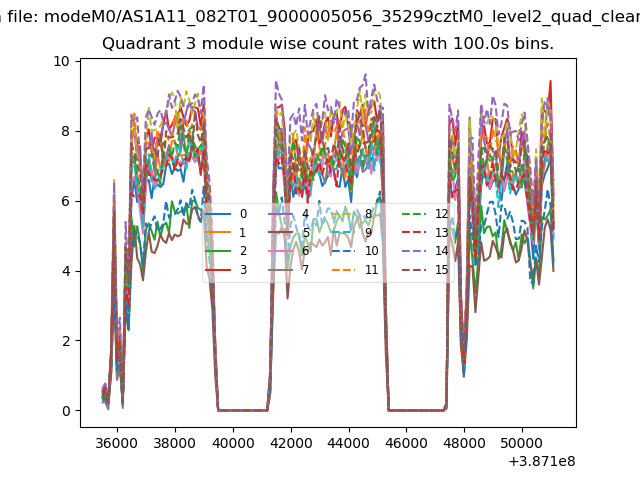
| Module-wise count rates for Quadrant C Data is divided into 100 sec bins |
 |
 |
| Module-wise count rates for Quadrant D Data is divided into 100 sec bins |
 |
 |
| Parameter | Plot |
|---|---|
| CZT HV Monitor | 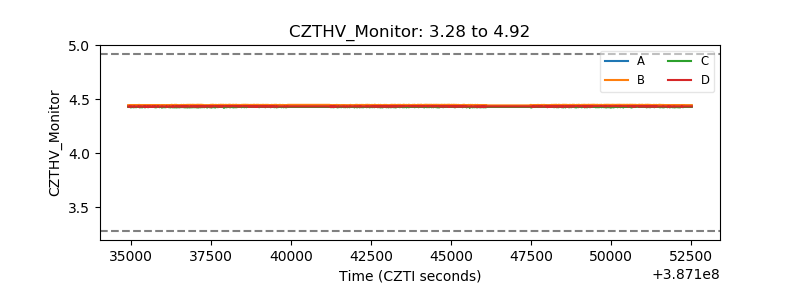 |
| D_VDD | 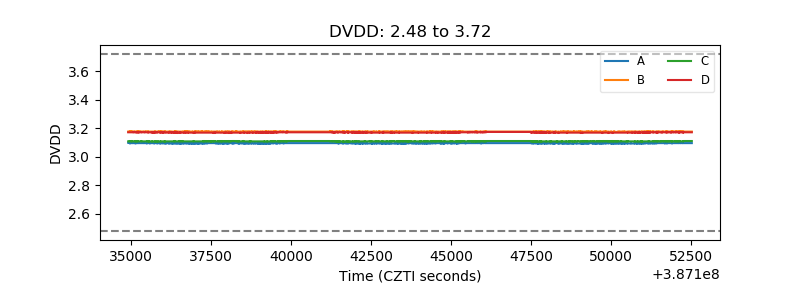 |
| Temperature 1 | 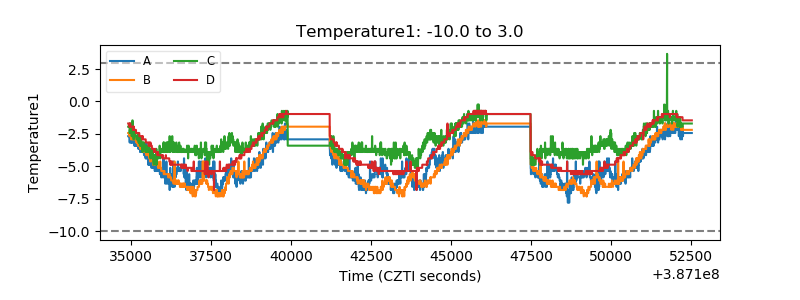 |
| Veto HV Monitor | 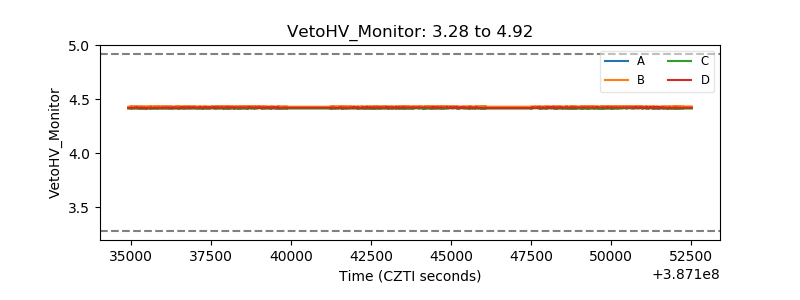 |
| Veto LLD | 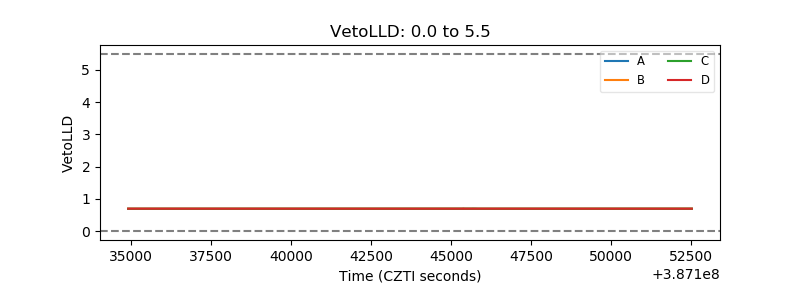 |
| Alpha Counter | 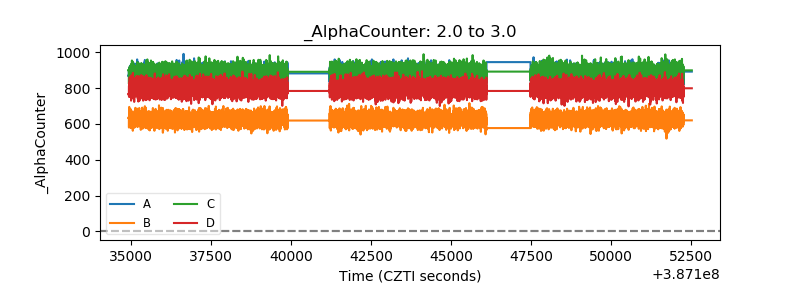 |
| _CPM_Rate | 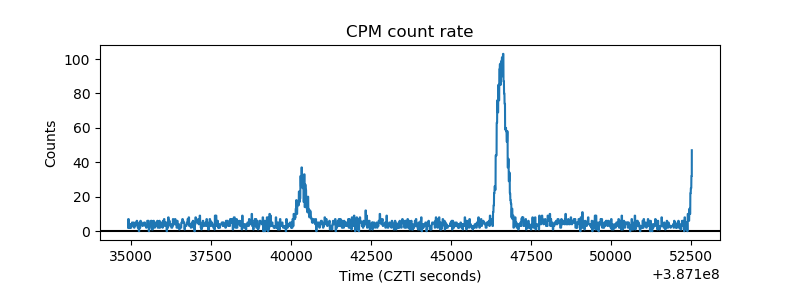 |
| CZT Counter | 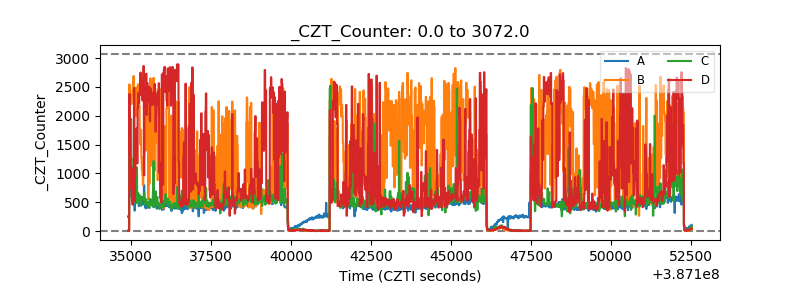 |
| +2.5 Volts monitor |  |
| +5 Volts monitor | 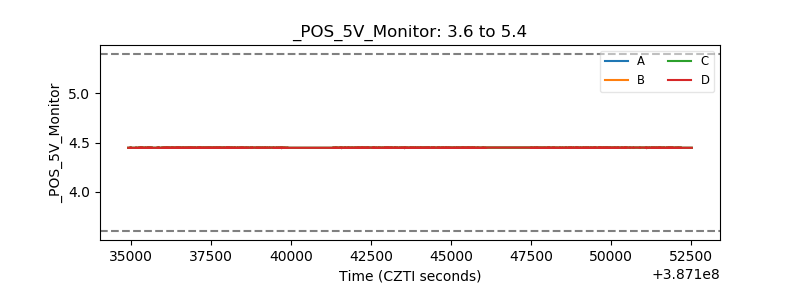 |
| _ROLL_ROT | 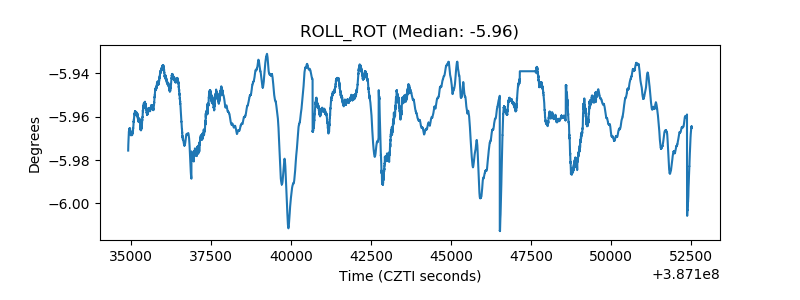 |
| _Roll_DEC | 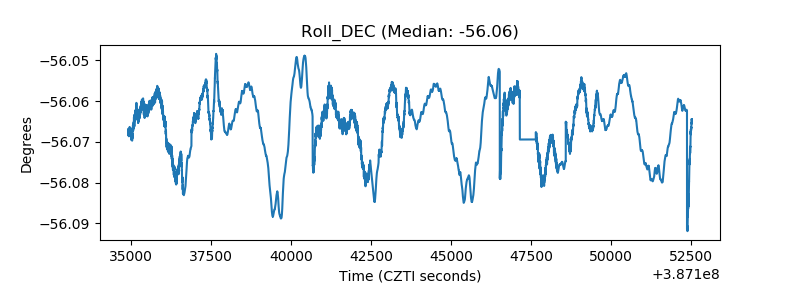 |
| _Roll_RA | 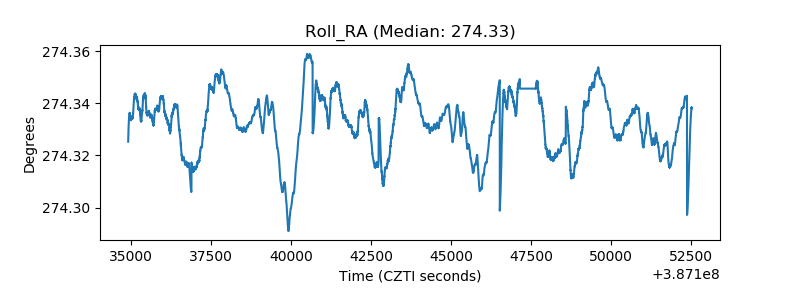 |
| Veto Counter | 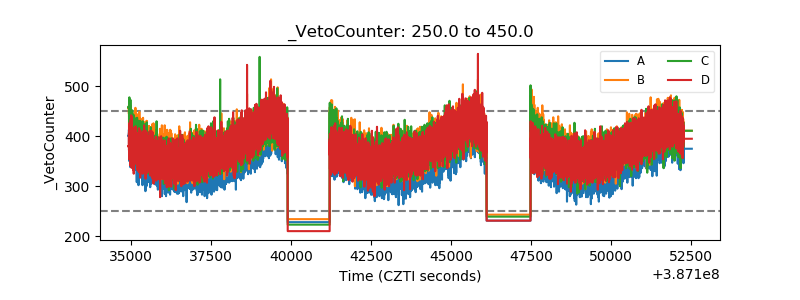 |