| Param | Original file | Final file |
|---|---|---|
| Filename | modeM0/AS1A11_082T01_9000005056_35296cztM0_level2.evt | modeM0/AS1A11_082T01_9000005056_35296cztM0_level2_quad_clean.evt |
| Size (bytes) | 658,730,880 | 79,974,720 |
| Size | 628.2 MB | 76.3 MB |
| Events in quadrant A | 2,851,782 | 537,845 |
| Events in quadrant B | 8,380,757 | 468,731 |
| Events in quadrant C | 3,358,482 | 532,150 |
| Events in quadrant D | 4,966,116 | 476,925 |
| Mode M0 | |||
|---|---|---|---|
| Quadrant | BADHDUFLAG | Total packets | Discarded packets |
| A | 0 | 12294 | 3 |
| B | 0 | 28856 | 2 |
| C | 0 | 13478 | 2 |
| D | 0 | 18509 | 2 |
| Mode SS | |||
|---|---|---|---|
| Quadrant | BADHDUFLAG | Total packets | Discarded packets |
| A | 0 | 118 | 0 |
| B | 0 | 118 | 0 |
| C | 0 | 118 | 0 |
| D | 0 | 118 | 0 |
| Mode M9 | |||
|---|---|---|---|
| Quadrant | BADHDUFLAG | Total packets | Discarded packets |
| A | 0 | 22 | 0 |
| B | 0 | 22 | 0 |
| C | 0 | 22 | 0 |
| D | 0 | 23 | 0 |
| Quadrant | Total seconds | Saturated seconds | Saturation percentage |
|---|---|---|---|
| A | 5801 | 30 | 0.517152% |
| B | 5801 | 2307 | 39.769005% |
| C | 5801 | 110 | 1.896225% |
| D | 5801 | 721 | 12.428892% |
Noise dominated data is calculated using 1-second bins in cleaned event files. If a bin has >2000 counts, and if more than 50% of those come from <1% of pixels, then it is considered to be noise-dominated and hence unusable.
| Quadrant | # 1 sec bins | Bins with >0 counts | Bins with >2000 counts | High rate bins dominated by noise | Noise dominated (total time) | Noise dominated (detector-on time) | Marked lightcurve |
|---|---|---|---|---|---|---|---|
| A | 7114 | 5802 | 21 | 21 | 0.30% | 0.36% | 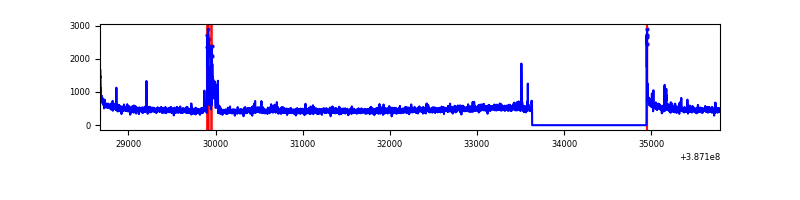 |
| B | 7113 | 5800 | 1921 | 1921 | 27.01% | 33.12% | 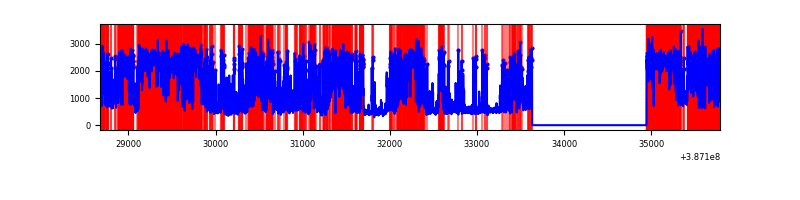 |
| C | 7114 | 5802 | 97 | 97 | 1.36% | 1.67% | 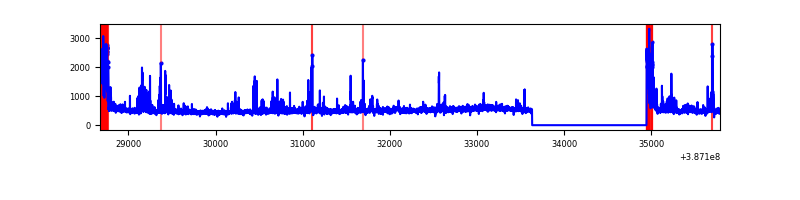 |
| D | 7113 | 5801 | 662 | 662 | 9.31% | 11.41% | 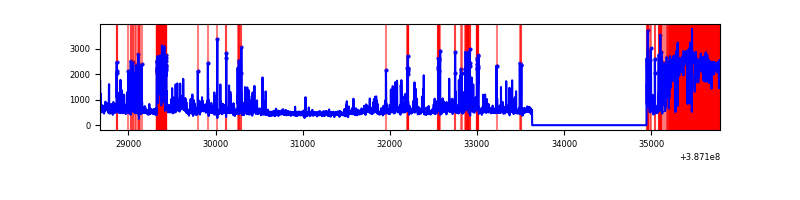 |
Top three noisy pixels from each quadrant. If the there are fewer than three noisy pixels in the level2.evt file, extra rows are filled as -1
| Pixel properties | Quadrant properties | ||||||
|---|---|---|---|---|---|---|---|
| Quadrant | DetID | PixID | Counts | Sigma | Mean | Median | Sigma |
| A | 15 | 169 | 133620 | 1002.78 | 660 | 646 | 132.6 |
| A | 10 | 83 | 103566 | 776.13 | 660 | 646 | 132.6 |
| A | 3 | 1 | 24309 | 178.44 | 660 | 646 | 132.6 |
| B | 5 | 236 | 3510264 | 33942.37 | 536 | 522 | 103.4 |
| B | 5 | 172 | 2660714 | 25726.46 | 536 | 522 | 103.4 |
| B | 4 | 232 | 38266 | 365.02 | 536 | 522 | 103.4 |
| C | 0 | 10 | 536408 | 3618.74 | 637 | 639 | 148.1 |
| C | 15 | 214 | 239536 | 1613.58 | 637 | 639 | 148.1 |
| C | 4 | 254 | 57505 | 384.09 | 637 | 639 | 148.1 |
| D | 7 | 80 | 1538525 | 10618.8 | 591 | 575 | 144.8 |
| D | 8 | 195 | 353153 | 2434.38 | 591 | 575 | 144.8 |
| D | 2 | 249 | 327434 | 2256.8 | 591 | 575 | 144.8 |
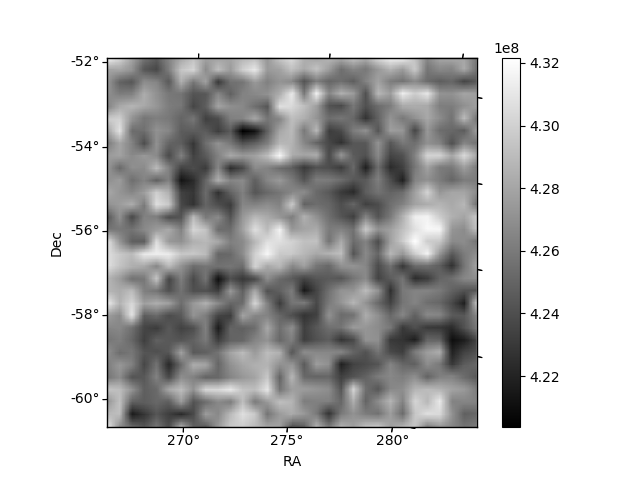
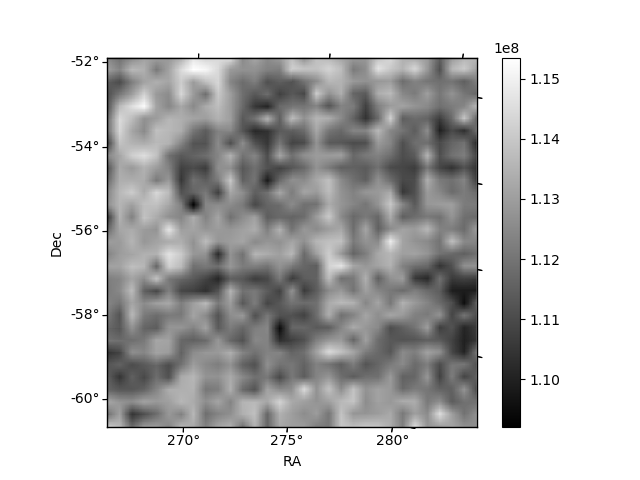
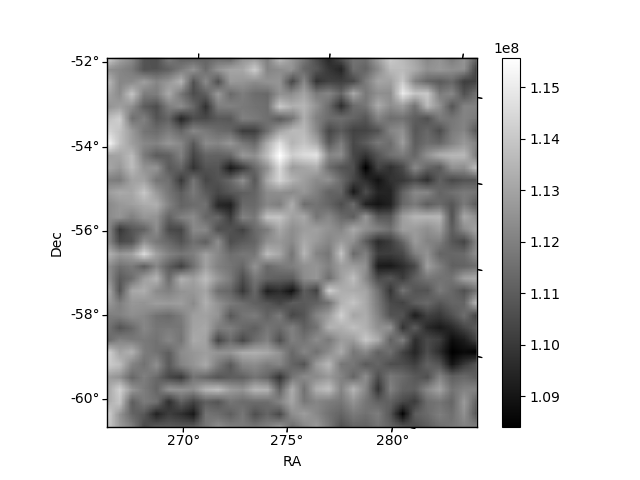
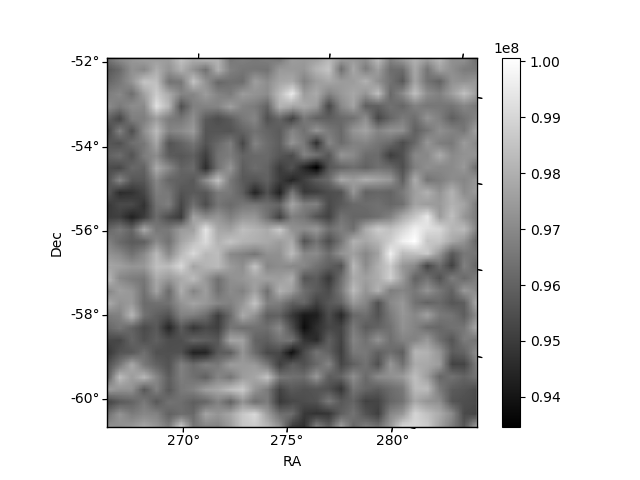
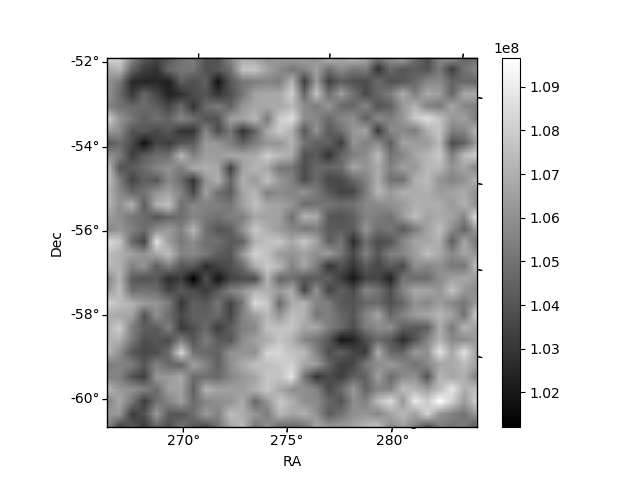
Histogram calculated using DETX and DETY for each event in the final _common_clean file
| Quadrant A | 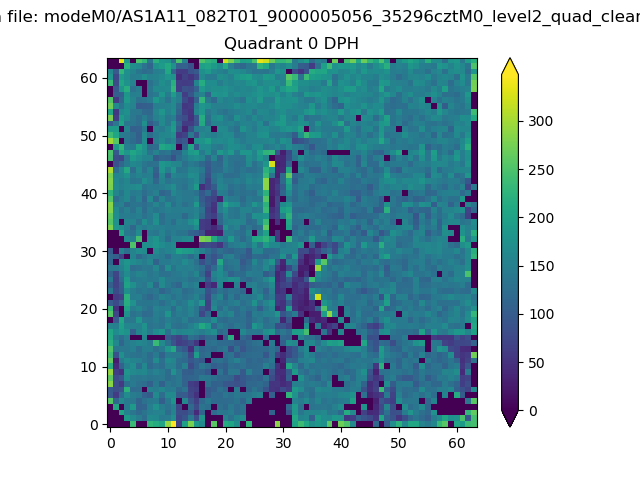 |
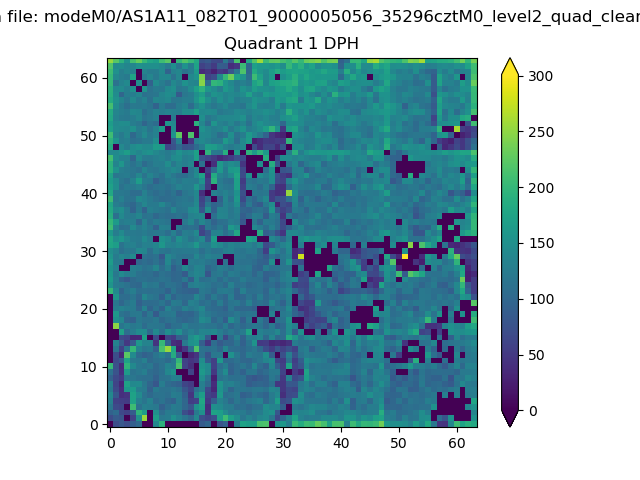 |
Quadrant B |
|---|---|---|---|
| Quadrant D | 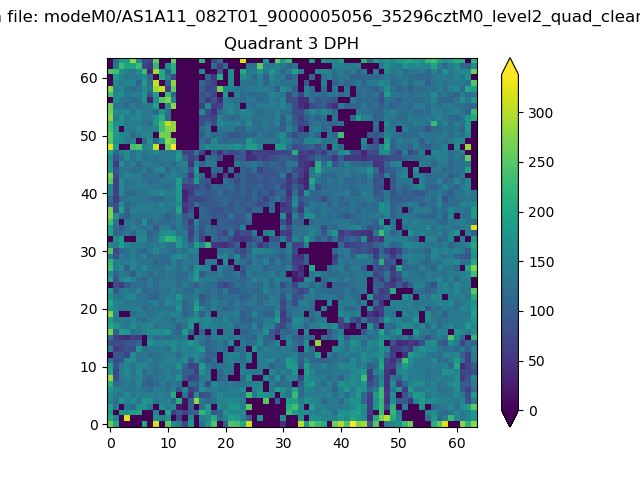 |
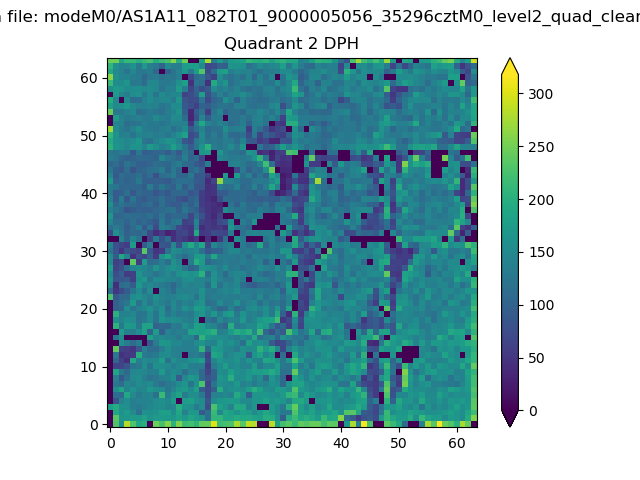 |
Quadrant C |
| Plot type | Count rate plots | Images |
|---|---|---|
| Comparison with Poisson distribution Blue bars denote a histogram of data divided into 1 sec bins. Red curve is a Poisson curve with rate = median count rate of data. |
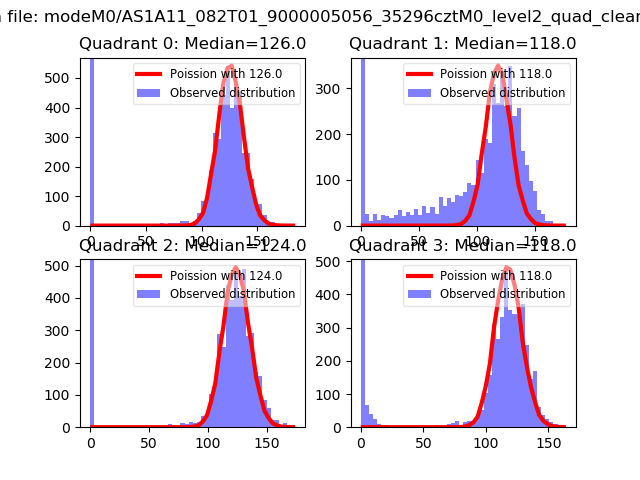 |
 |
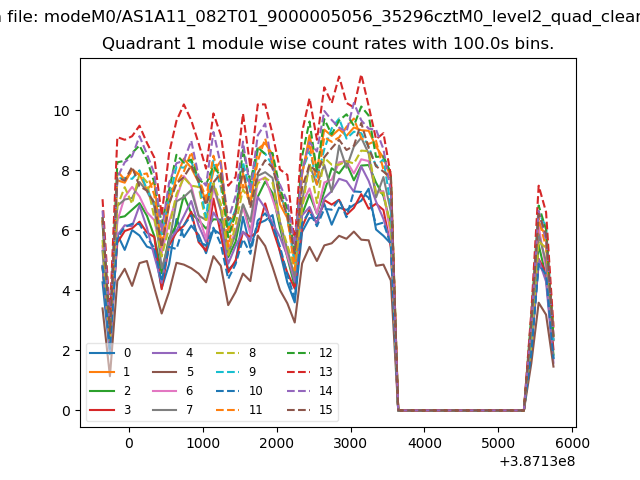
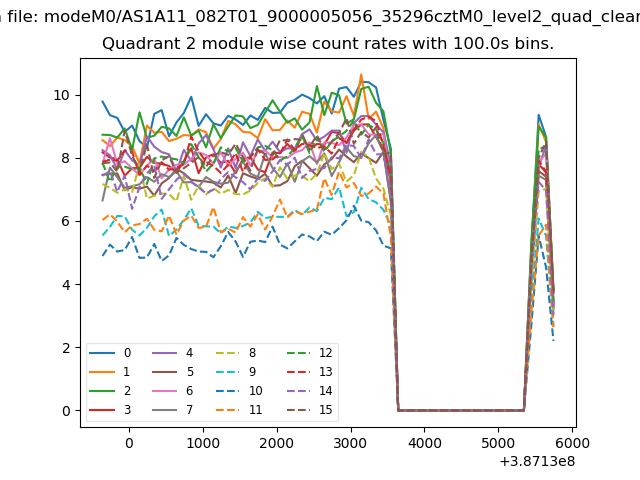
| Quadrant-wise count rates Data is divided into 100 sec bins |
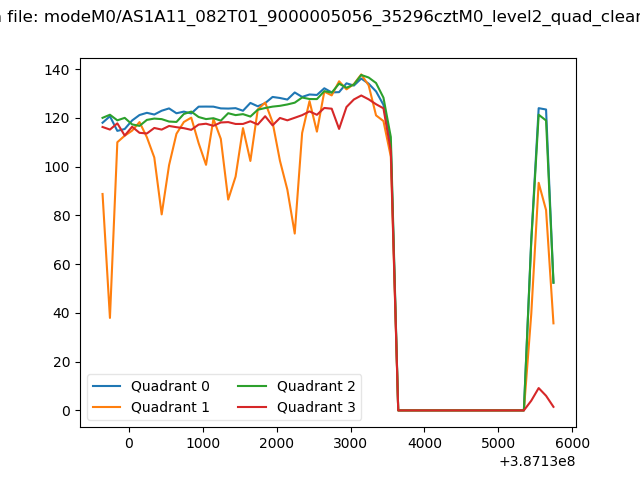 |
|
| Module-wise count rates for Quadrant A Data is divided into 100 sec bins |
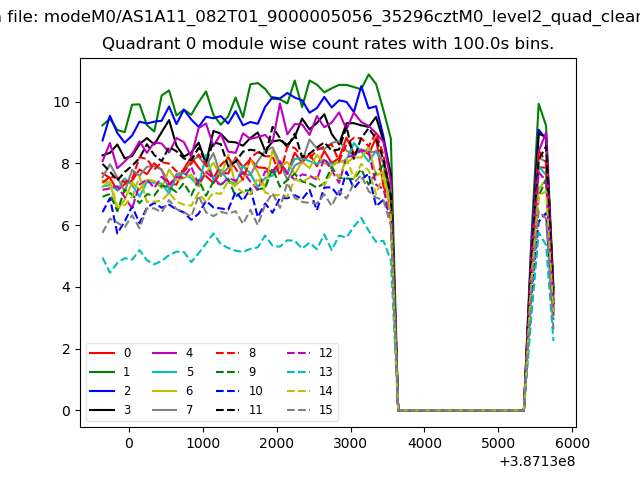 |
 |
| Module-wise count rates for Quadrant B Data is divided into 100 sec bins |
 |
 |
| Module-wise count rates for Quadrant C Data is divided into 100 sec bins |
 |
 |
| Module-wise count rates for Quadrant D Data is divided into 100 sec bins |
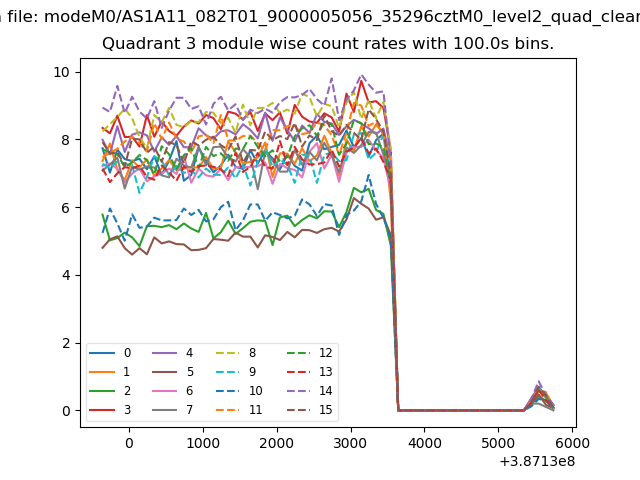 |
 |
| Parameter | Plot |
|---|---|
| CZT HV Monitor | 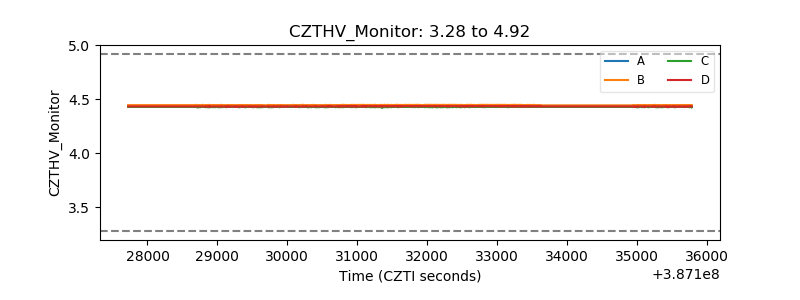 |
| D_VDD | 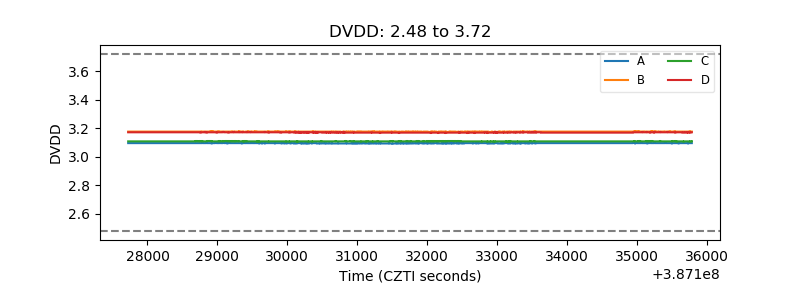 |
| Temperature 1 | 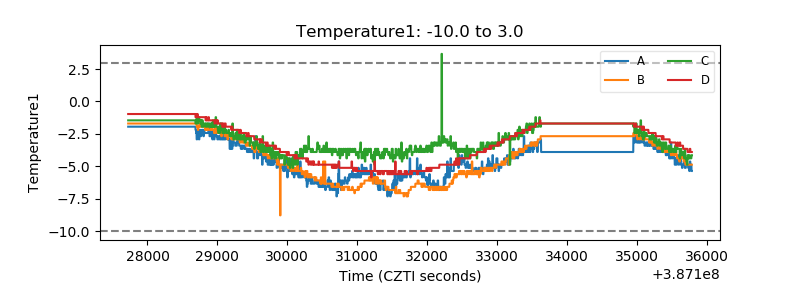 |
| Veto HV Monitor | 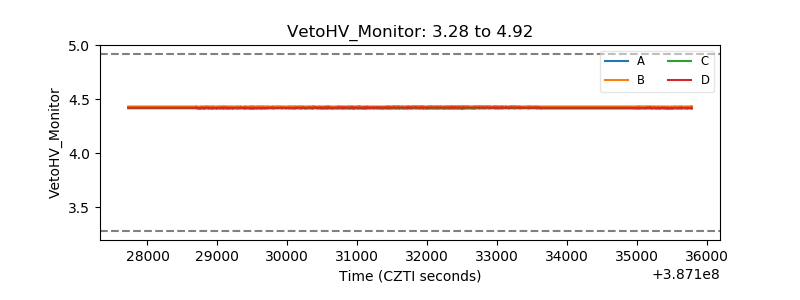 |
| Veto LLD | 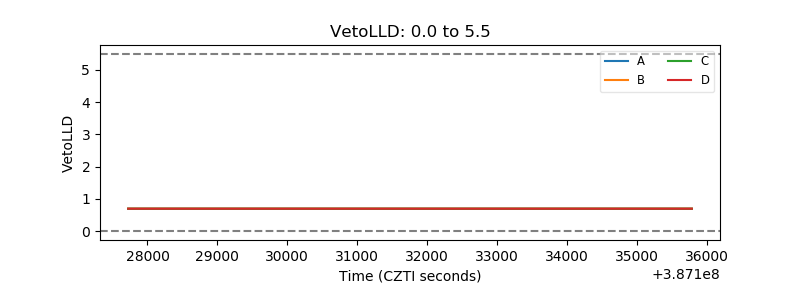 |
| Alpha Counter | 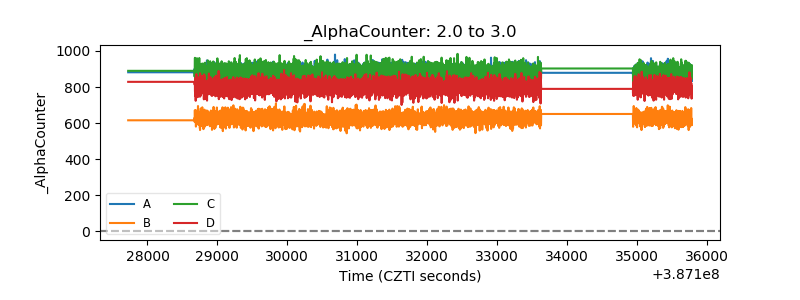 |
| _CPM_Rate | 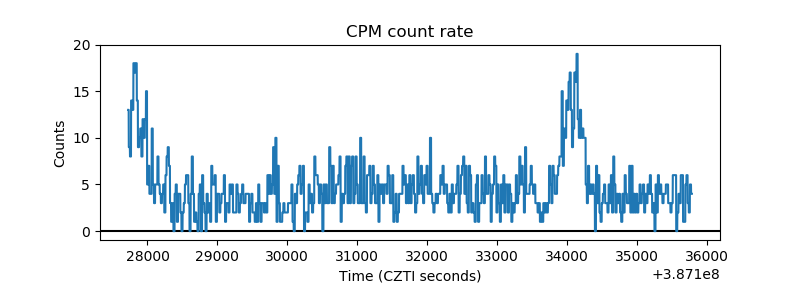 |
| CZT Counter | 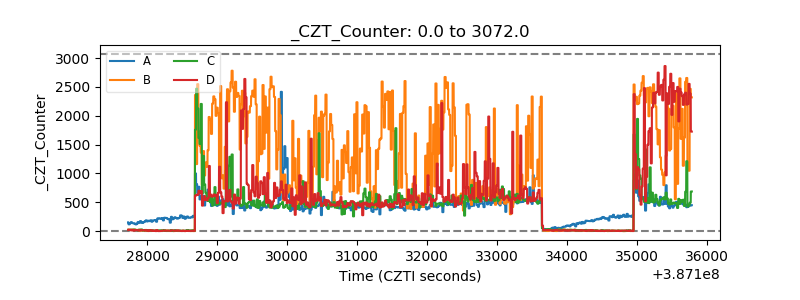 |
| +2.5 Volts monitor | 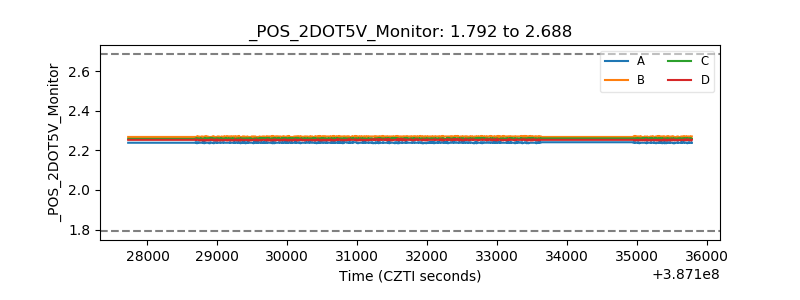 |
| +5 Volts monitor | 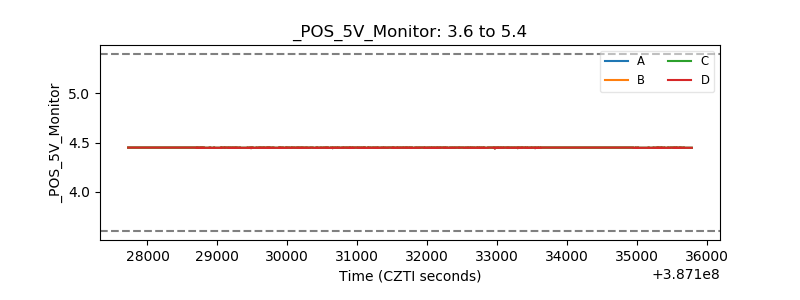 |
| _ROLL_ROT | 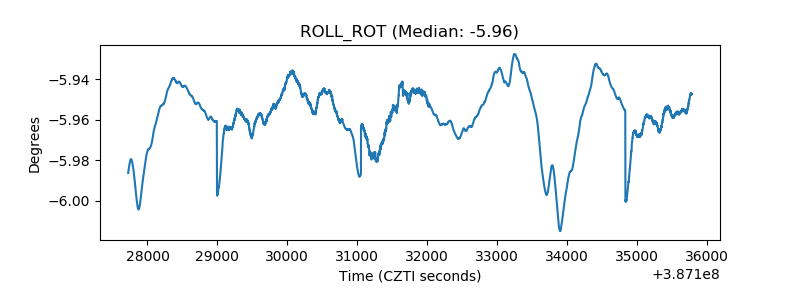 |
| _Roll_DEC | 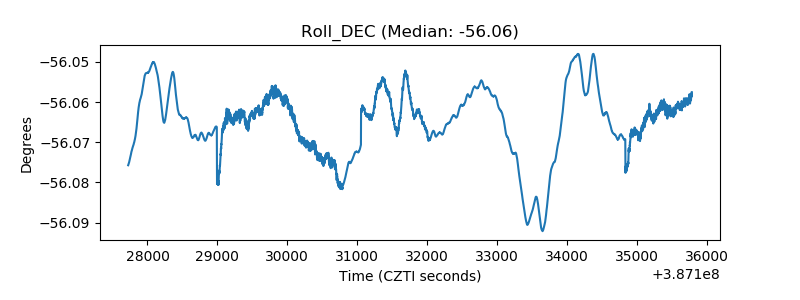 |
| _Roll_RA | 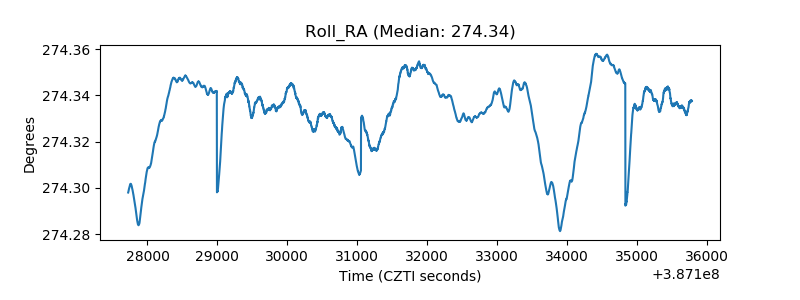 |
| Veto Counter | 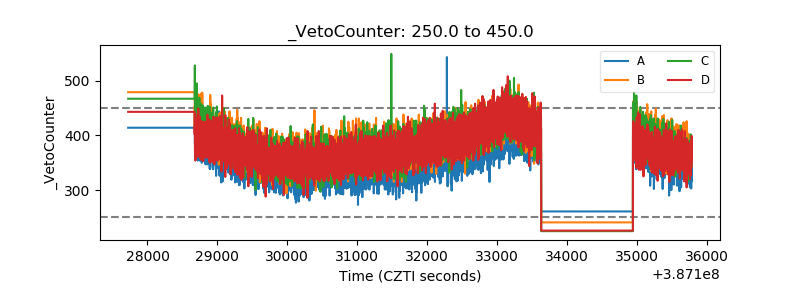 |