| Param | Original file | Final file |
|---|---|---|
| Filename | modeM0/AS1A11_082T01_9000005056_35293cztM0_level2.evt | modeM0/AS1A11_082T01_9000005056_35293cztM0_level2_quad_clean.evt |
| Size (bytes) | 627,212,160 | 52,081,920 |
| Size | 598.2 MB | 49.7 MB |
| Events in quadrant A | 2,581,928 | 323,375 |
| Events in quadrant B | 8,131,686 | 269,031 |
| Events in quadrant C | 3,145,812 | 313,588 |
| Events in quadrant D | 4,777,243 | 299,266 |
| Mode M0 | |||
|---|---|---|---|
| Quadrant | BADHDUFLAG | Total packets | Discarded packets |
| A | 0 | 10899 | 3 |
| B | 0 | 27852 | 2 |
| C | 0 | 12320 | 2 |
| D | 0 | 17601 | 2 |
| Mode SS | |||
|---|---|---|---|
| Quadrant | BADHDUFLAG | Total packets | Discarded packets |
| A | 0 | 108 | 0 |
| B | 0 | 108 | 0 |
| C | 0 | 108 | 0 |
| D | 0 | 108 | 0 |
| Mode M9 | |||
|---|---|---|---|
| Quadrant | BADHDUFLAG | Total packets | Discarded packets |
| A | 0 | 25 | 0 |
| B | 0 | 25 | 0 |
| C | 0 | 25 | 0 |
| D | 0 | 26 | 0 |
| Quadrant | Total seconds | Saturated seconds | Saturation percentage |
|---|---|---|---|
| A | 5296 | 7 | 0.132175% |
| B | 5296 | 2160 | 40.785498% |
| C | 5296 | 128 | 2.416918% |
| D | 5296 | 704 | 13.293051% |
Noise dominated data is calculated using 1-second bins in cleaned event files. If a bin has >2000 counts, and if more than 50% of those come from <1% of pixels, then it is considered to be noise-dominated and hence unusable.
| Quadrant | # 1 sec bins | Bins with >0 counts | Bins with >2000 counts | High rate bins dominated by noise | Noise dominated (total time) | Noise dominated (detector-on time) | Marked lightcurve |
|---|---|---|---|---|---|---|---|
| A | 7360 | 5297 | 0 | 0 | 0.00% | 0.00% | 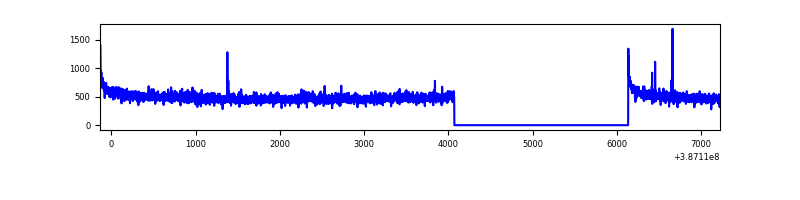 |
| B | 7359 | 5296 | 1795 | 1795 | 24.39% | 33.89% | 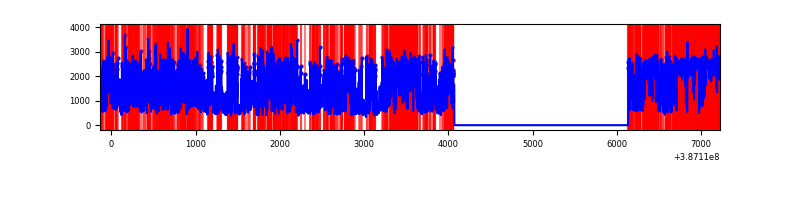 |
| C | 7360 | 5297 | 108 | 108 | 1.47% | 2.04% | 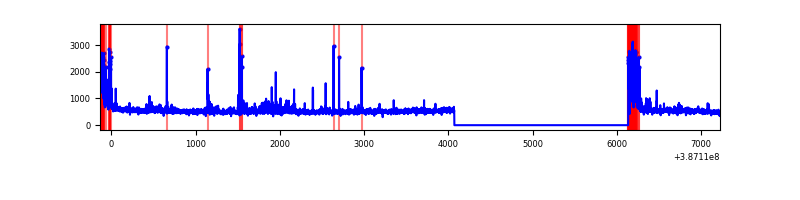 |
| D | 7360 | 5297 | 621 | 621 | 8.44% | 11.72% | 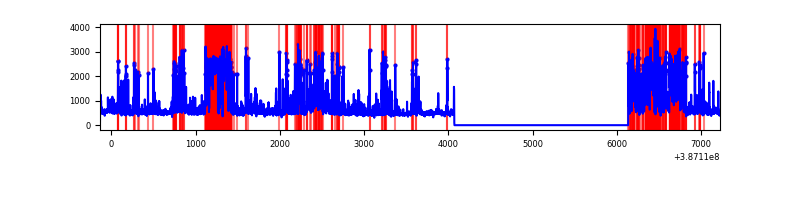 |
Top three noisy pixels from each quadrant. If the there are fewer than three noisy pixels in the level2.evt file, extra rows are filled as -1
| Pixel properties | Quadrant properties | ||||||
|---|---|---|---|---|---|---|---|
| Quadrant | DetID | PixID | Counts | Sigma | Mean | Median | Sigma |
| A | 10 | 83 | 96797 | 753.24 | 636 | 625 | 127.7 |
| A | 13 | 6 | 12926 | 96.34 | 636 | 625 | 127.7 |
| A | 13 | 254 | 7801 | 56.2 | 636 | 625 | 127.7 |
| B | 5 | 236 | 3350399 | 34671.81 | 511 | 499 | 96.6 |
| B | 5 | 172 | 2647416 | 27395.86 | 511 | 499 | 96.6 |
| B | 4 | 232 | 63001 | 646.9 | 511 | 499 | 96.6 |
| C | 0 | 10 | 493392 | 3517.99 | 607 | 611 | 140.1 |
| C | 15 | 214 | 218685 | 1556.84 | 607 | 611 | 140.1 |
| C | 14 | 67 | 30923 | 216.4 | 607 | 611 | 140.1 |
| D | 7 | 80 | 846349 | 6045.92 | 578 | 563 | 139.9 |
| D | 2 | 249 | 736562 | 5261.13 | 578 | 563 | 139.9 |
| D | 14 | 52 | 339968 | 2426.16 | 578 | 563 | 139.9 |
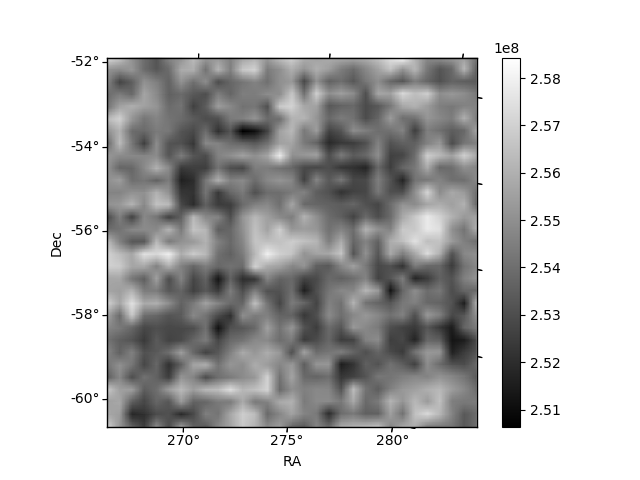
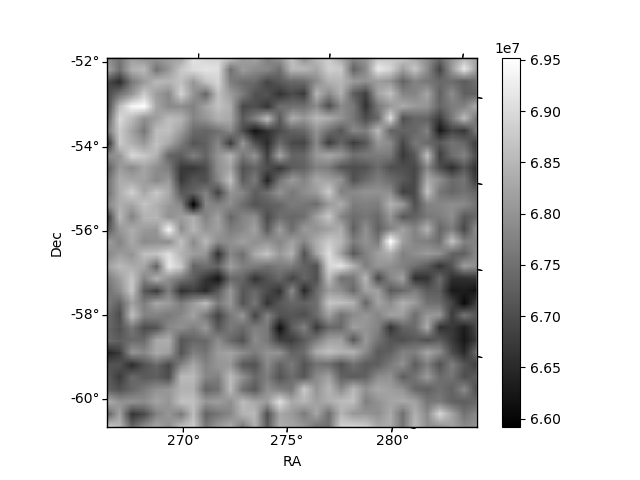
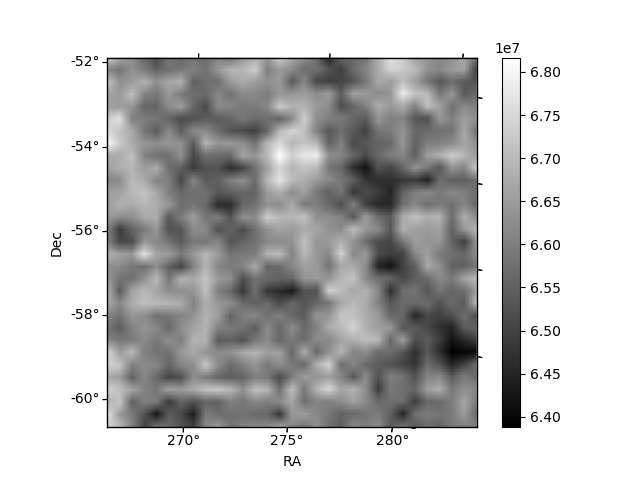
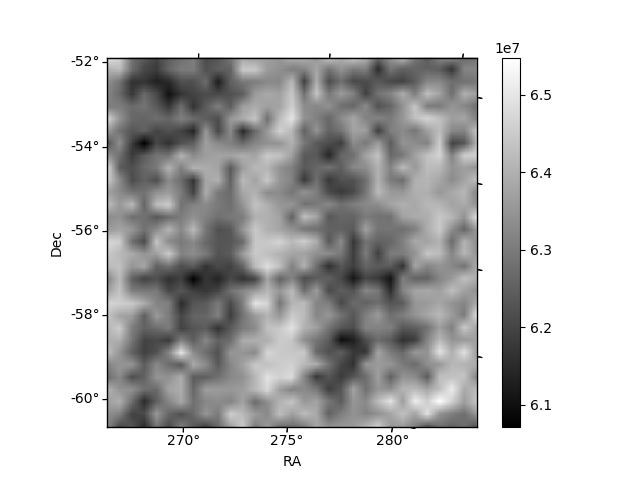
Histogram calculated using DETX and DETY for each event in the final _common_clean file
| Quadrant A | 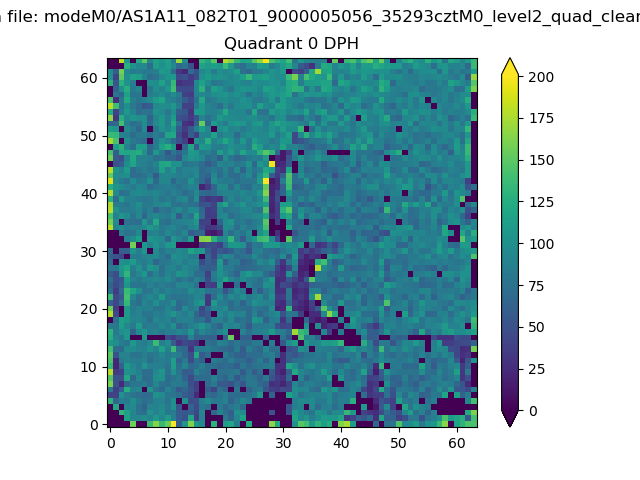 |
 |
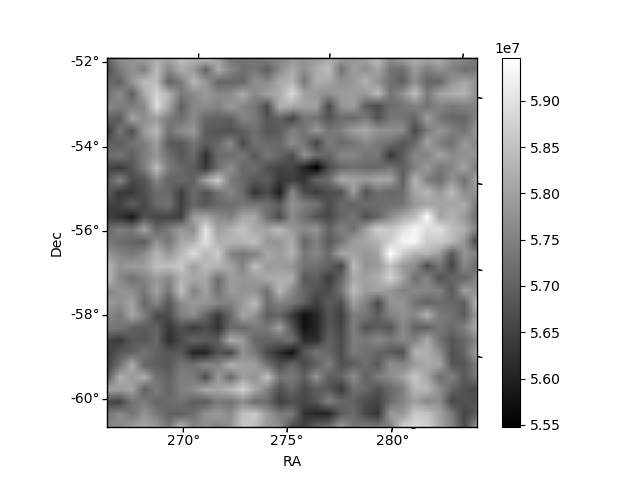
Quadrant B |
|---|---|---|---|
| Quadrant D | 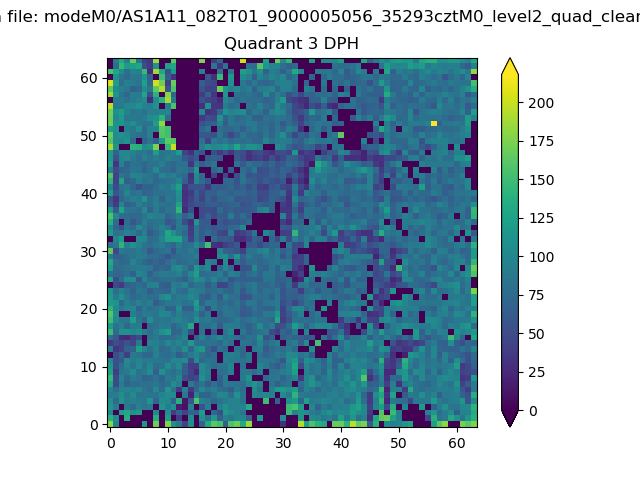 |
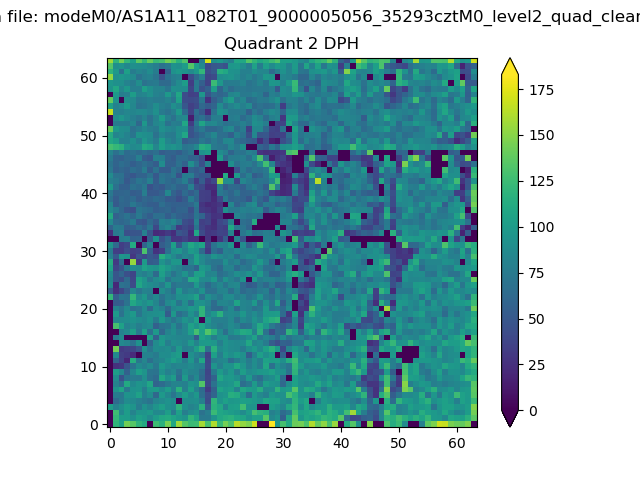 |
Quadrant C |
| Plot type | Count rate plots | Images |
|---|---|---|
| Comparison with Poisson distribution Blue bars denote a histogram of data divided into 1 sec bins. Red curve is a Poisson curve with rate = median count rate of data. |
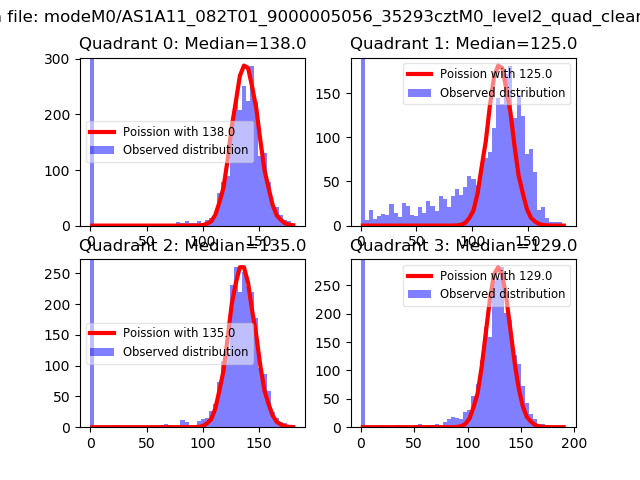 |
 |
| Quadrant-wise count rates Data is divided into 100 sec bins |
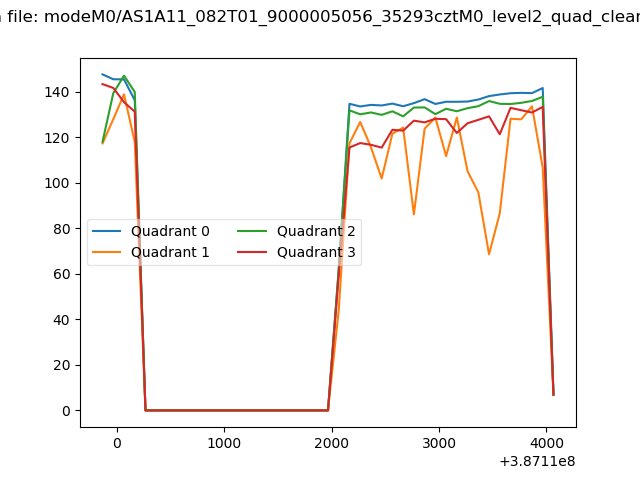 |
|
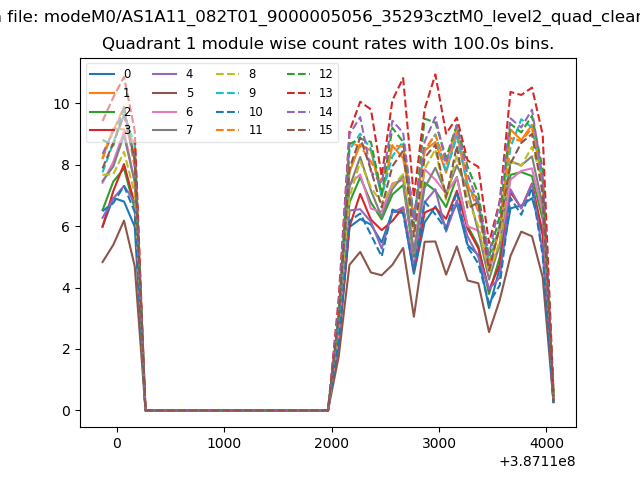
| Module-wise count rates for Quadrant A Data is divided into 100 sec bins |
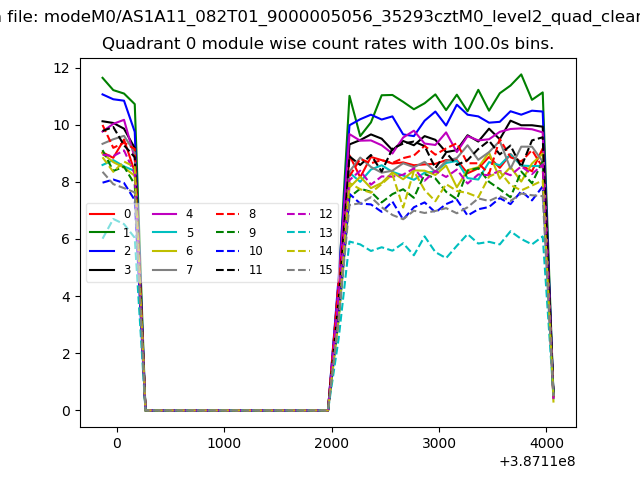 |
 |
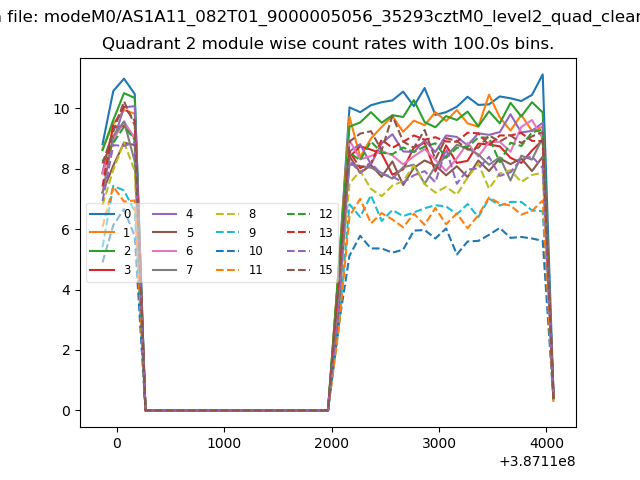
| Module-wise count rates for Quadrant B Data is divided into 100 sec bins |
 |
 |
| Module-wise count rates for Quadrant C Data is divided into 100 sec bins |
 |
 |
| Module-wise count rates for Quadrant D Data is divided into 100 sec bins |
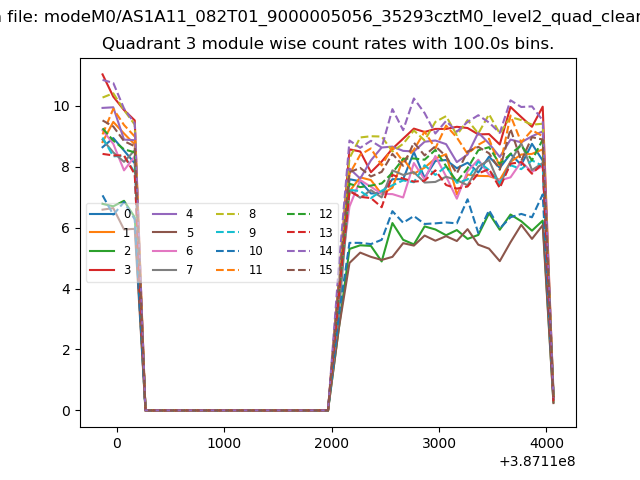 |
 |
| Parameter | Plot |
|---|---|
| CZT HV Monitor | 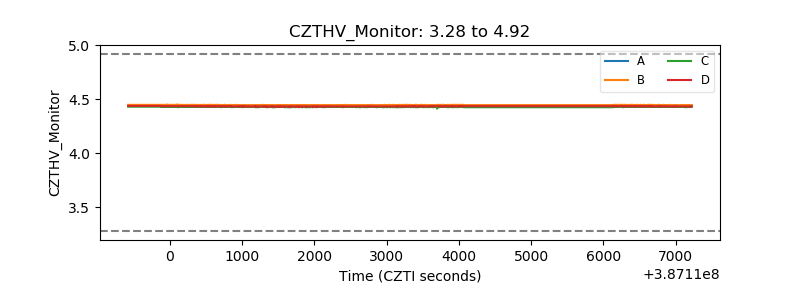 |
| D_VDD | 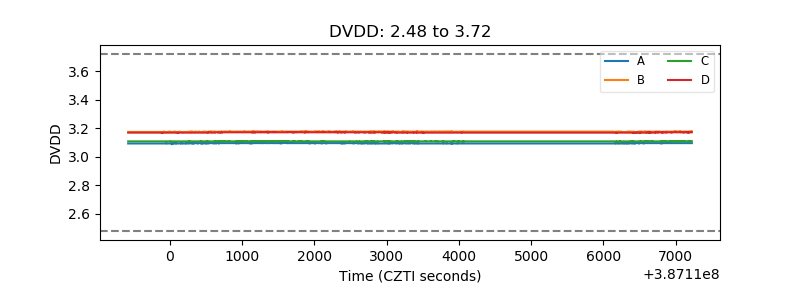 |
| Temperature 1 | 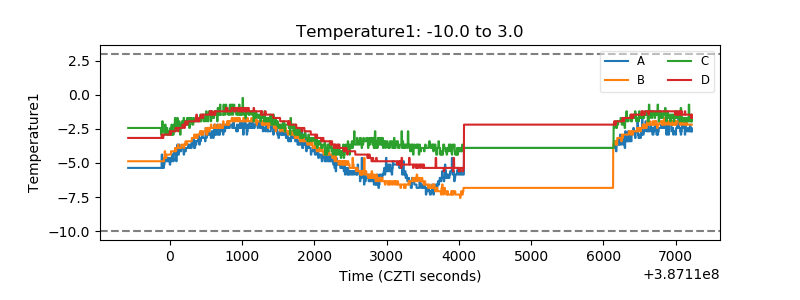 |
| Veto HV Monitor | 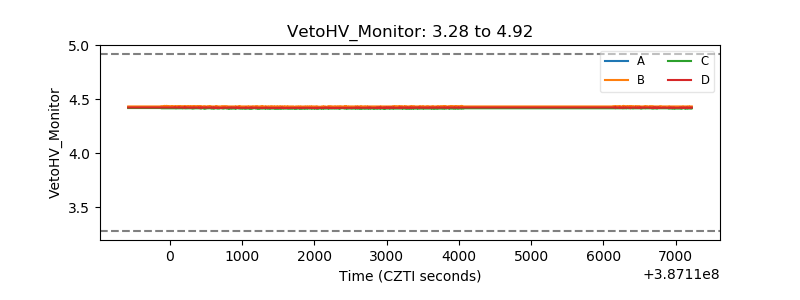 |
| Veto LLD | 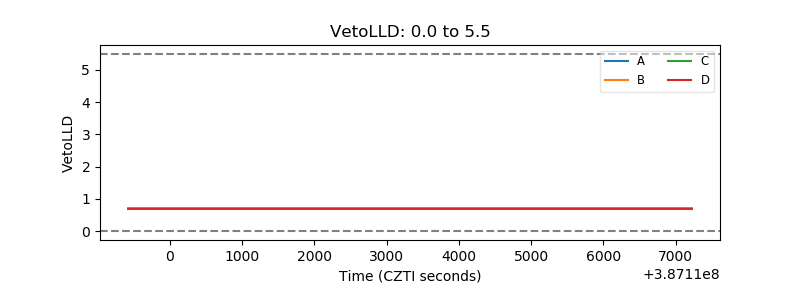 |
| Alpha Counter | 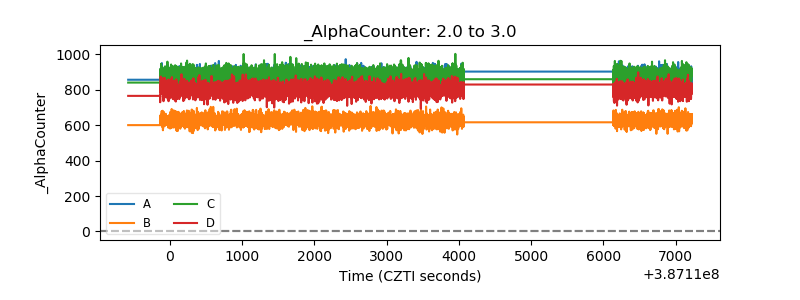 |
| _CPM_Rate | 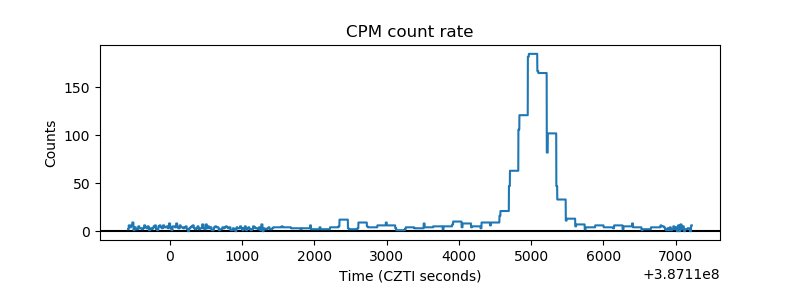 |
| CZT Counter | 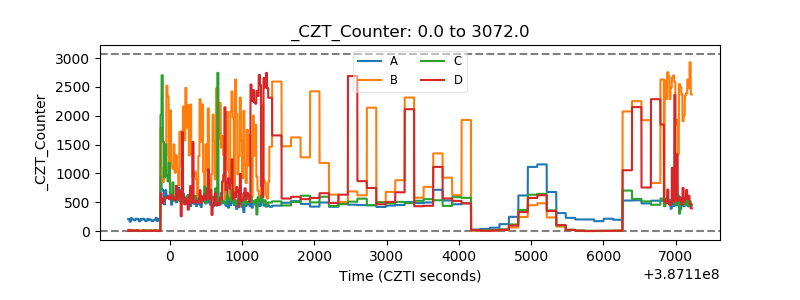 |
| +2.5 Volts monitor | 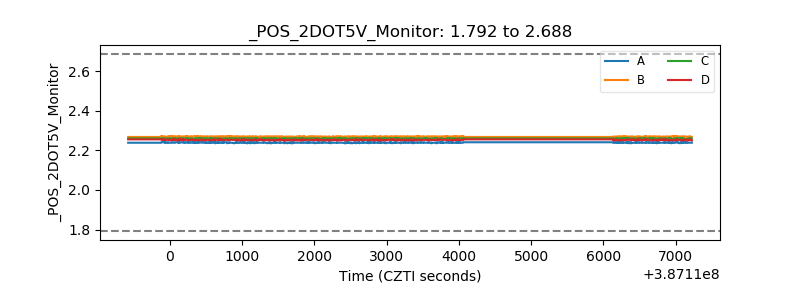 |
| +5 Volts monitor | 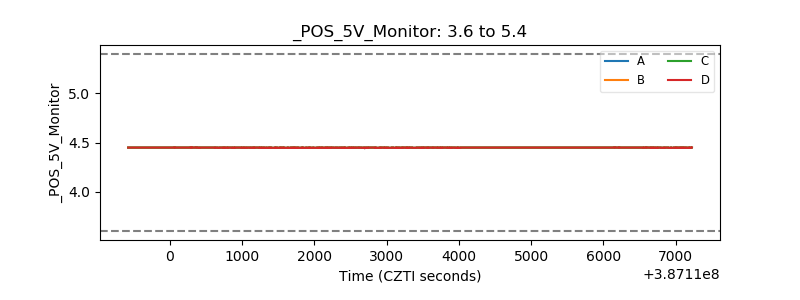 |
| _ROLL_ROT | 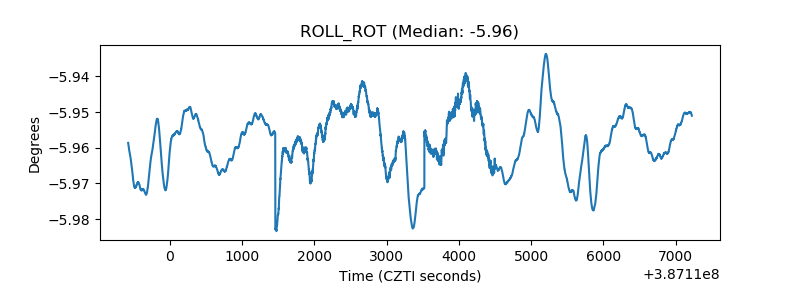 |
| _Roll_DEC | 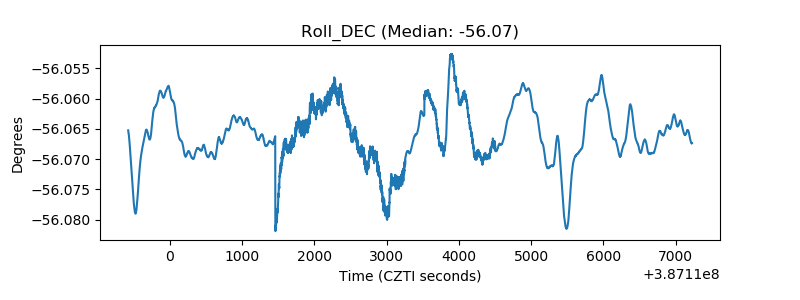 |
| _Roll_RA | 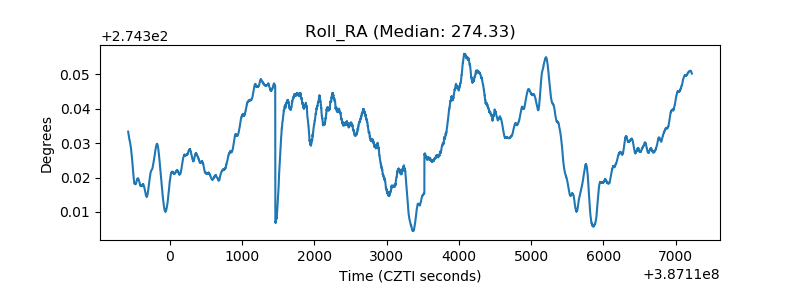 |
| Veto Counter | 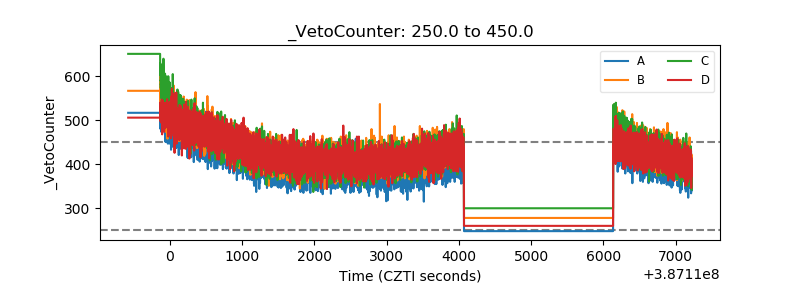 |