| Param | Original file | Final file |
|---|---|---|
| Filename | modeM0/AS1A11_082T01_9000005056_35292cztM0_level2.evt | modeM0/AS1A11_082T01_9000005056_35292cztM0_level2_quad_clean.evt |
| Size (bytes) | 630,550,080 | 60,537,600 |
| Size | 601.3 MB | 57.7 MB |
| Events in quadrant A | 2,700,178 | 394,408 |
| Events in quadrant B | 8,992,839 | 320,938 |
| Events in quadrant C | 3,265,424 | 378,162 |
| Events in quadrant D | 3,777,464 | 366,170 |
| Mode M0 | |||
|---|---|---|---|
| Quadrant | BADHDUFLAG | Total packets | Discarded packets |
| A | 0 | 11080 | 3 |
| B | 0 | 30429 | 2 |
| C | 0 | 12757 | 2 |
| D | 0 | 14482 | 2 |
| Mode SS | |||
|---|---|---|---|
| Quadrant | BADHDUFLAG | Total packets | Discarded packets |
| A | 0 | 110 | 0 |
| B | 0 | 110 | 0 |
| C | 0 | 110 | 0 |
| D | 0 | 110 | 0 |
| Mode M9 | |||
|---|---|---|---|
| Quadrant | BADHDUFLAG | Total packets | Discarded packets |
| A | 0 | 27 | 0 |
| B | 0 | 27 | 0 |
| C | 0 | 27 | 0 |
| D | 0 | 28 | 0 |
| Quadrant | Total seconds | Saturated seconds | Saturation percentage |
|---|---|---|---|
| A | 5315 | 6 | 0.112888% |
| B | 5315 | 2686 | 50.536218% |
| C | 5315 | 146 | 2.746943% |
| D | 5315 | 201 | 3.781750% |
Noise dominated data is calculated using 1-second bins in cleaned event files. If a bin has >2000 counts, and if more than 50% of those come from <1% of pixels, then it is considered to be noise-dominated and hence unusable.
| Quadrant | # 1 sec bins | Bins with >0 counts | Bins with >2000 counts | High rate bins dominated by noise | Noise dominated (total time) | Noise dominated (detector-on time) | Marked lightcurve |
|---|---|---|---|---|---|---|---|
| A | 7439 | 5316 | 0 | 0 | 0.00% | 0.00% | 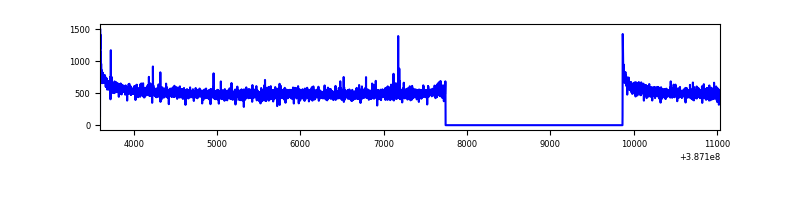 |
| B | 7439 | 5315 | 2256 | 2256 | 30.33% | 42.45% | 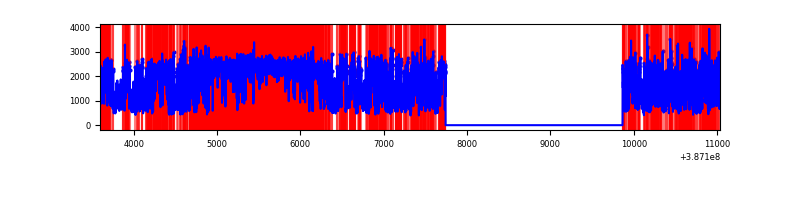 |
| C | 7439 | 5316 | 121 | 121 | 1.63% | 2.28% | 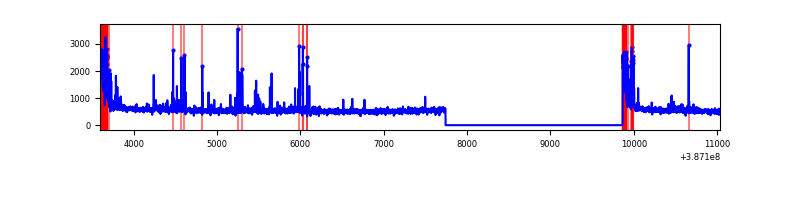 |
| D | 7439 | 5316 | 189 | 189 | 2.54% | 3.56% | 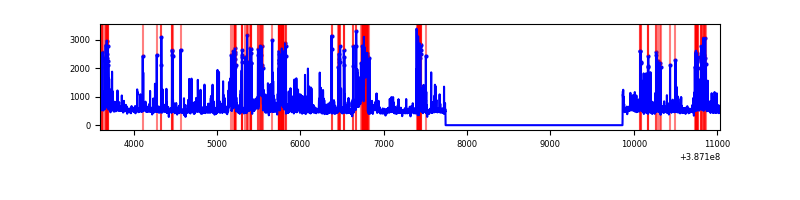 |
Top three noisy pixels from each quadrant. If the there are fewer than three noisy pixels in the level2.evt file, extra rows are filled as -1
| Pixel properties | Quadrant properties | ||||||
|---|---|---|---|---|---|---|---|
| Quadrant | DetID | PixID | Counts | Sigma | Mean | Median | Sigma |
| A | 10 | 83 | 95207 | 715.51 | 665 | 655 | 132.1 |
| A | 13 | 6 | 12742 | 91.47 | 665 | 655 | 132.1 |
| A | 15 | 169 | 10285 | 72.87 | 665 | 655 | 132.1 |
| B | 5 | 236 | 3905878 | 41350.41 | 500 | 489 | 94.4 |
| B | 5 | 172 | 3007828 | 31841.83 | 500 | 489 | 94.4 |
| B | 4 | 232 | 77254 | 812.79 | 500 | 489 | 94.4 |
| C | 0 | 10 | 492395 | 3388.15 | 635 | 641 | 145.1 |
| C | 15 | 214 | 219079 | 1505.02 | 635 | 641 | 145.1 |
| C | 4 | 254 | 53389 | 363.43 | 635 | 641 | 145.1 |
| D | 2 | 249 | 236822 | 1513.26 | 644 | 629 | 156.1 |
| D | 7 | 80 | 142913 | 911.6 | 644 | 629 | 156.1 |
| D | 13 | 13 | 129750 | 827.26 | 644 | 629 | 156.1 |
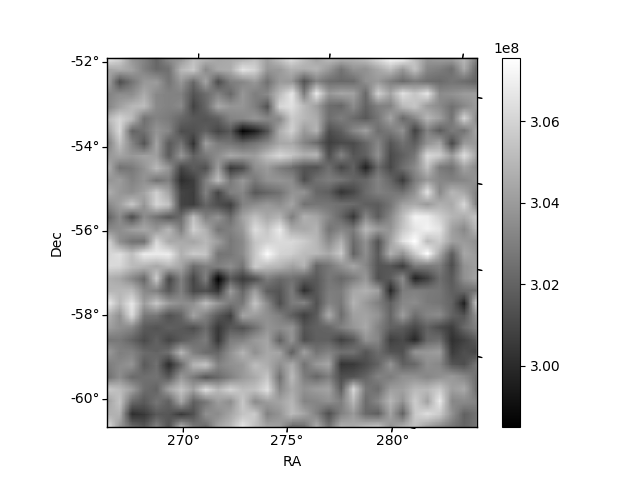
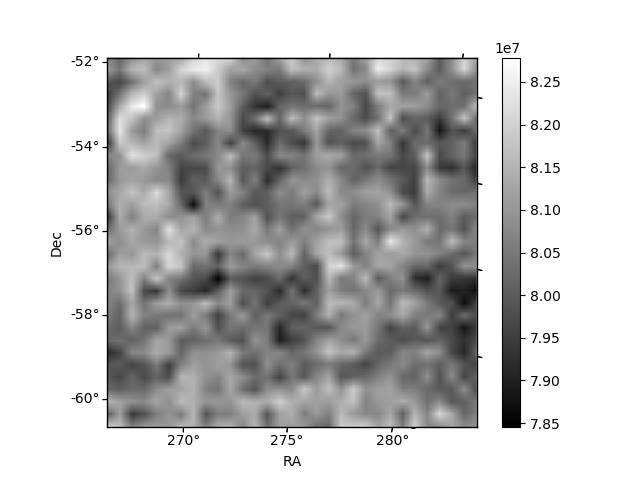
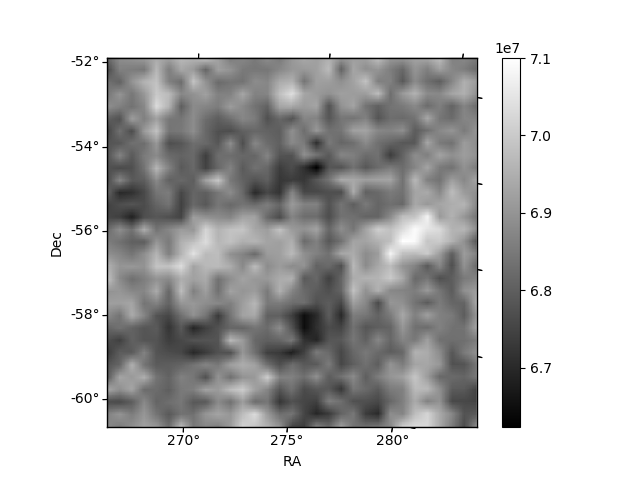
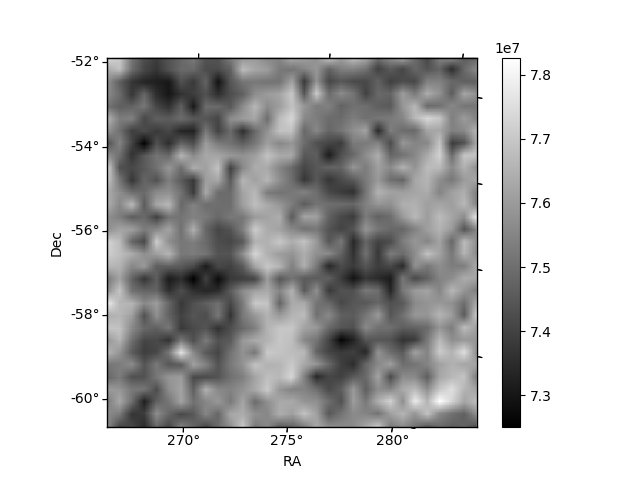
Histogram calculated using DETX and DETY for each event in the final _common_clean file
| Quadrant A | 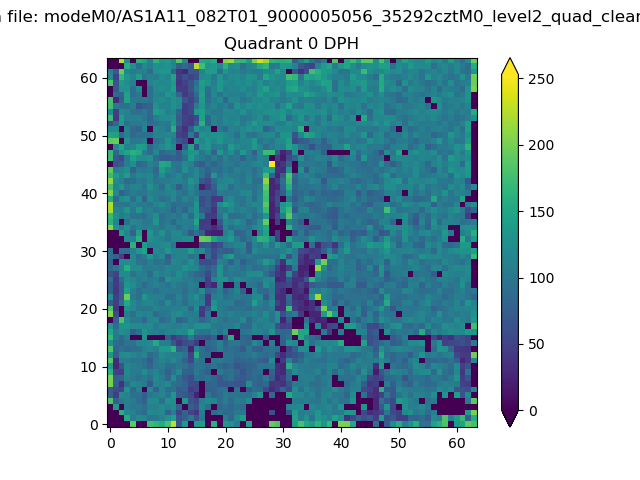 |
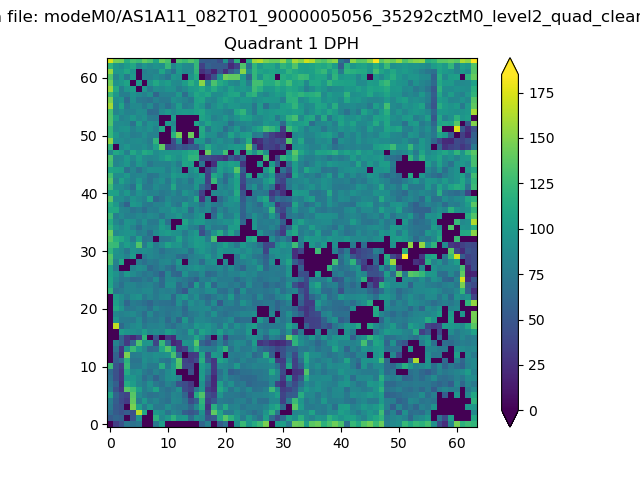 |
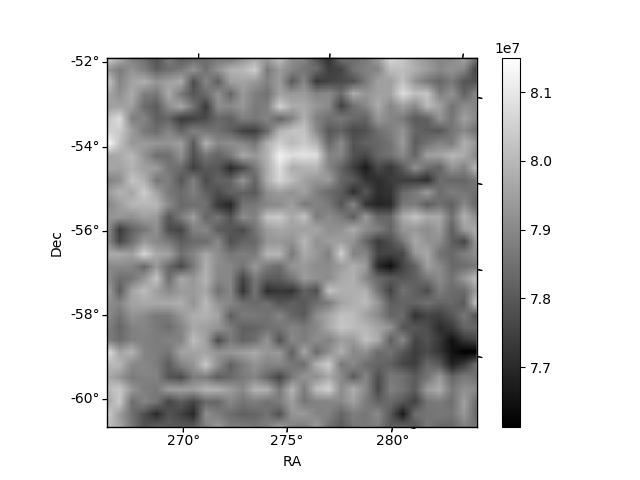
Quadrant B |
|---|---|---|---|
| Quadrant D | 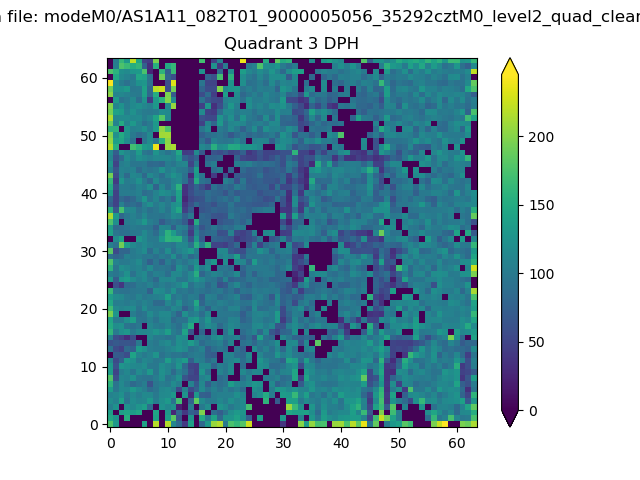 |
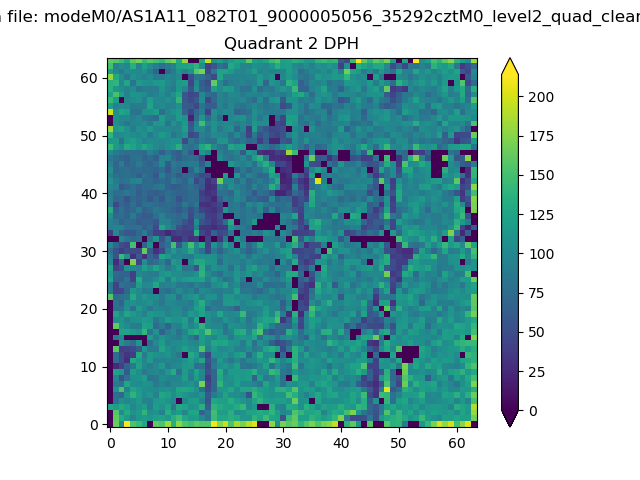 |
Quadrant C |
| Plot type | Count rate plots | Images |
|---|---|---|
| Comparison with Poisson distribution Blue bars denote a histogram of data divided into 1 sec bins. Red curve is a Poisson curve with rate = median count rate of data. |
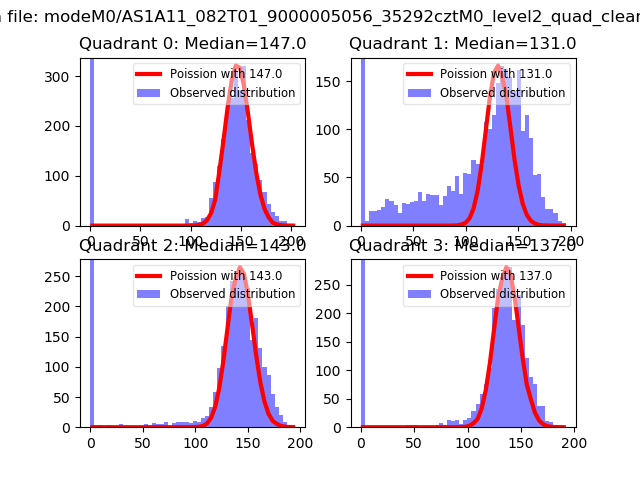 |
 |
| Quadrant-wise count rates Data is divided into 100 sec bins |
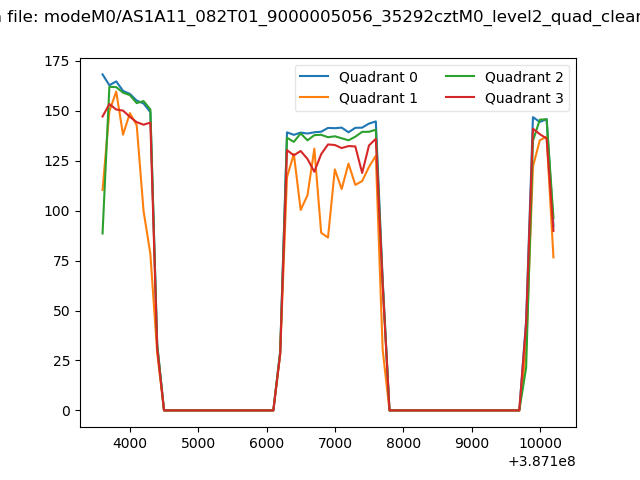 |
|
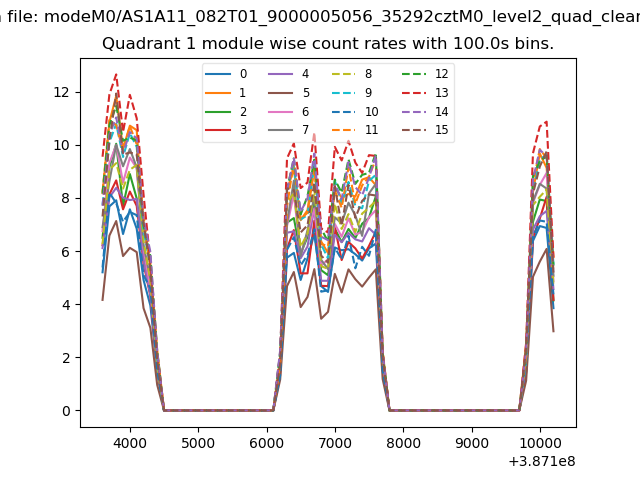
| Module-wise count rates for Quadrant A Data is divided into 100 sec bins |
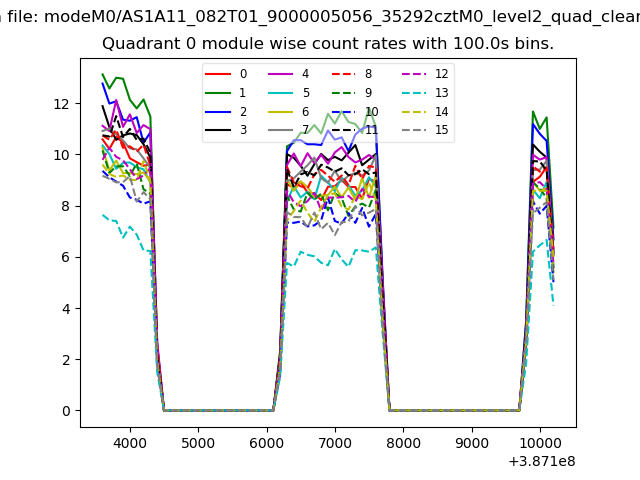 |
 |
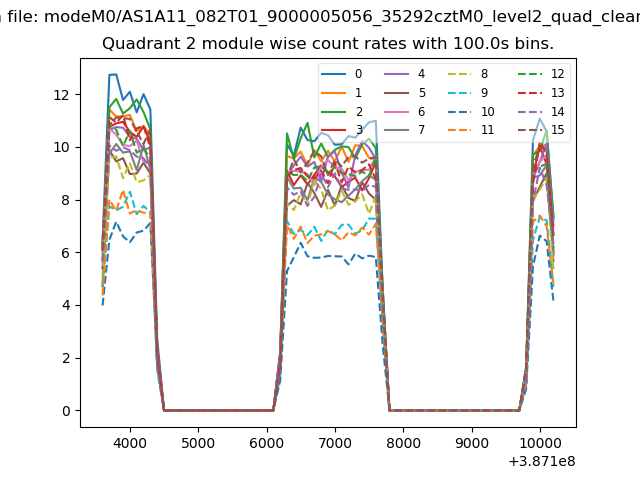
| Module-wise count rates for Quadrant B Data is divided into 100 sec bins |
 |
 |
| Module-wise count rates for Quadrant C Data is divided into 100 sec bins |
 |
 |
| Module-wise count rates for Quadrant D Data is divided into 100 sec bins |
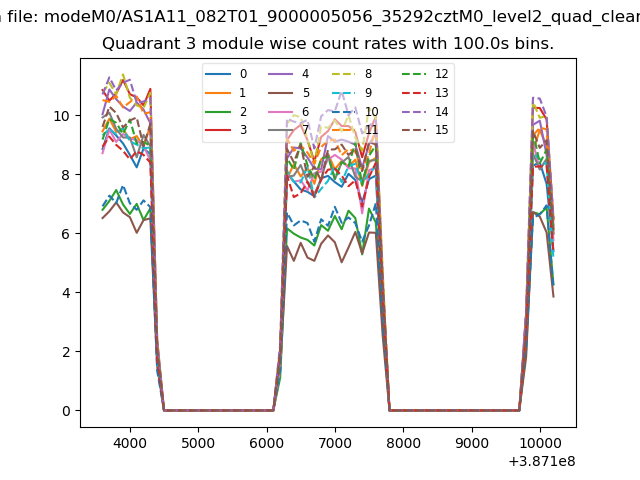 |
 |
| Parameter | Plot |
|---|---|
| CZT HV Monitor | 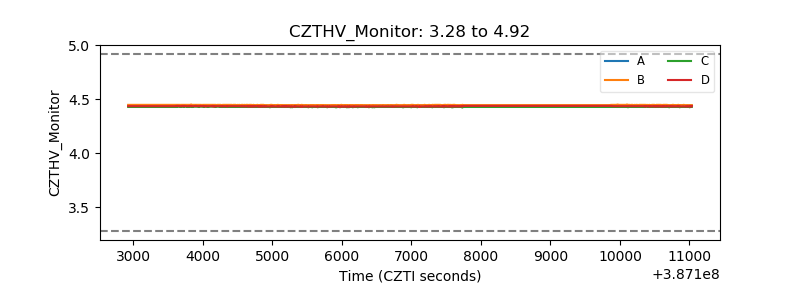 |
| D_VDD | 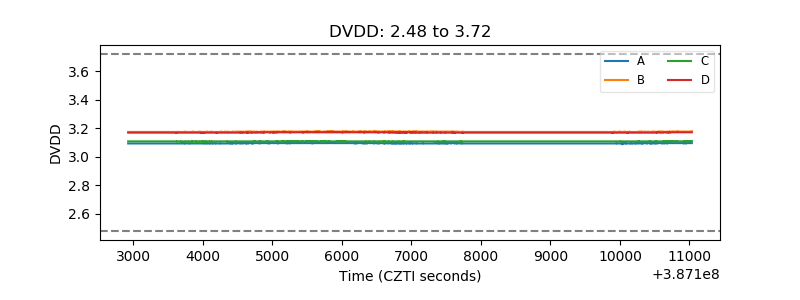 |
| Temperature 1 | 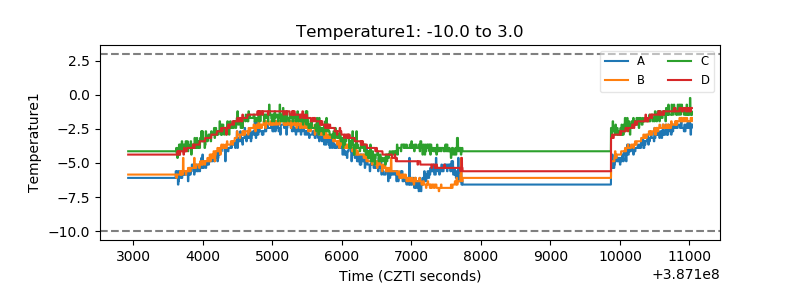 |
| Veto HV Monitor | 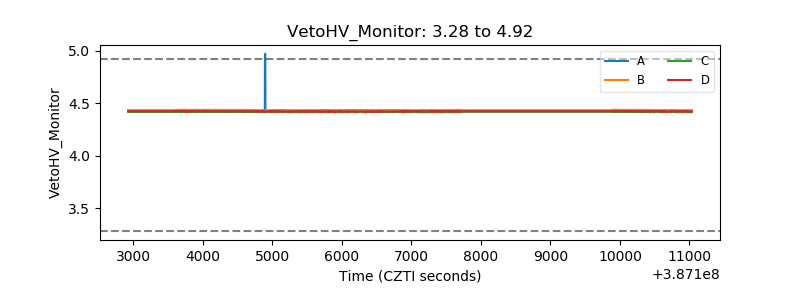 |
| Veto LLD | 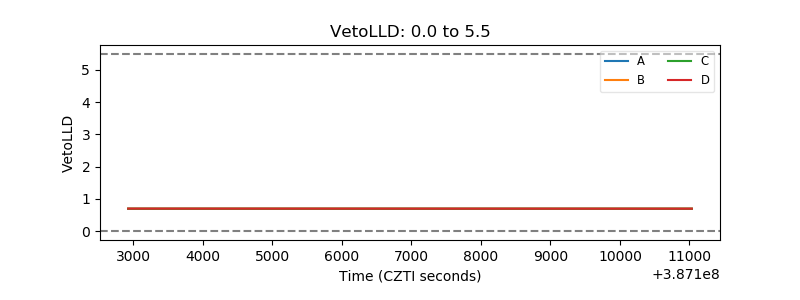 |
| Alpha Counter | 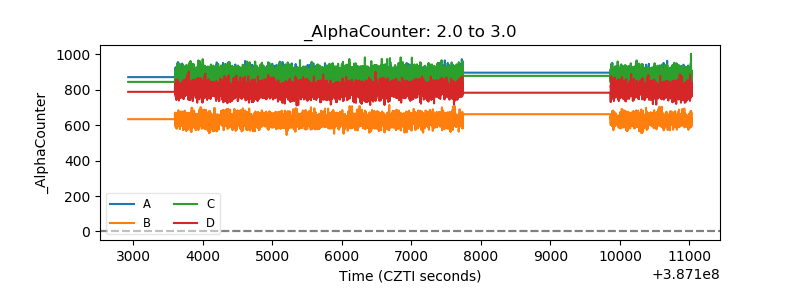 |
| _CPM_Rate | 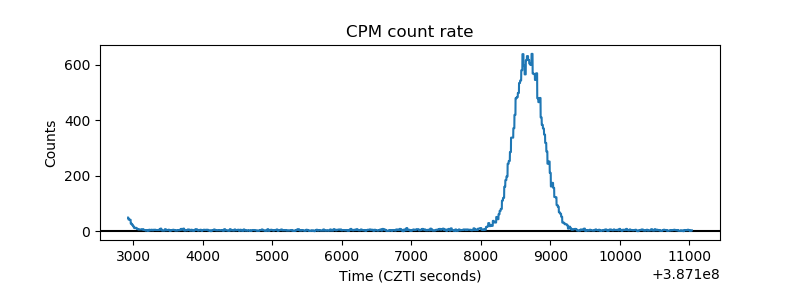 |
| CZT Counter | 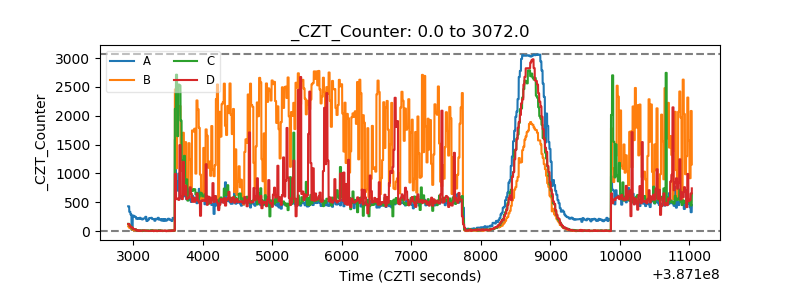 |
| +2.5 Volts monitor | 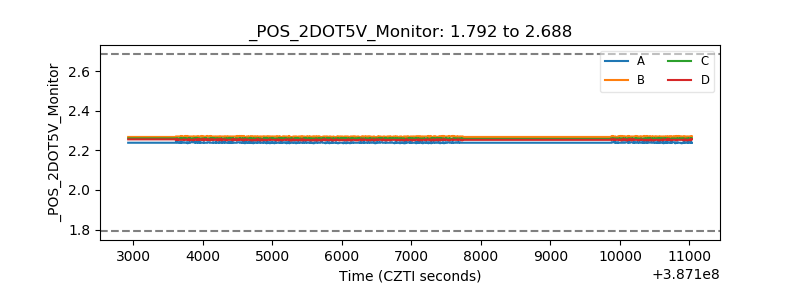 |
| +5 Volts monitor | 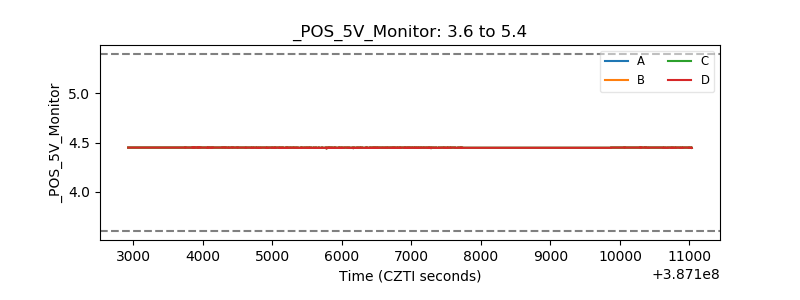 |
| _ROLL_ROT | 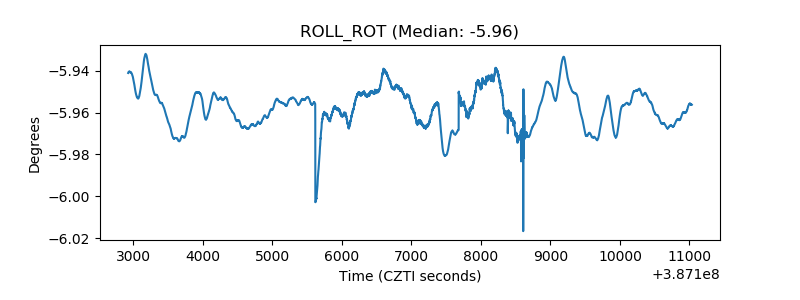 |
| _Roll_DEC | 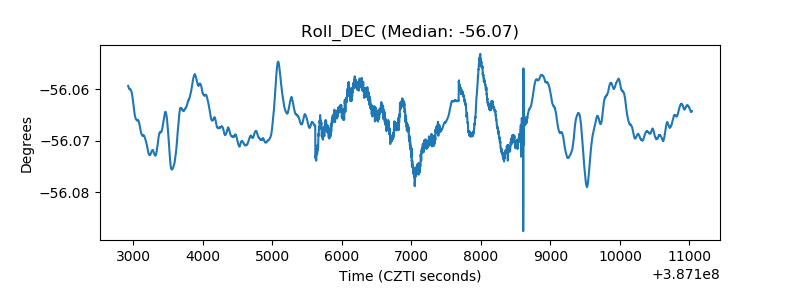 |
| _Roll_RA | 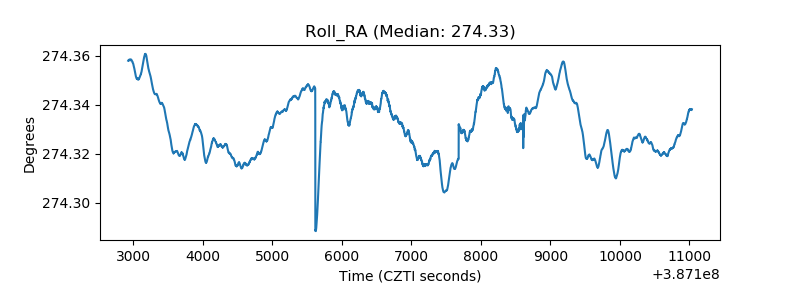 |
| Veto Counter | 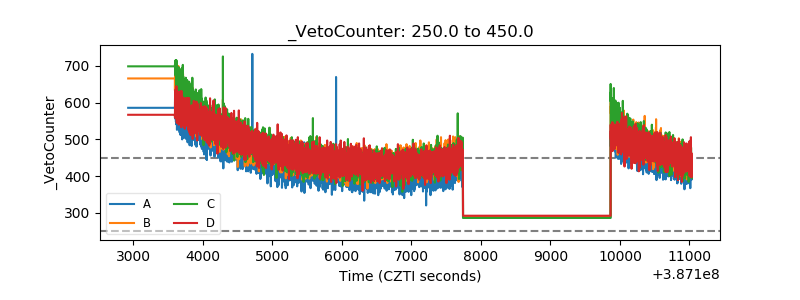 |