| Param | Original file | Final file |
|---|---|---|
| Filename | modeM0/AS1A11_082T01_9000005056_35290cztM0_level2.evt | modeM0/AS1A11_082T01_9000005056_35290cztM0_level2_quad_clean.evt |
| Size (bytes) | 589,060,800 | 71,418,240 |
| Size | 561.8 MB | 68.1 MB |
| Events in quadrant A | 2,597,092 | 484,226 |
| Events in quadrant B | 7,099,069 | 413,200 |
| Events in quadrant C | 3,971,797 | 460,003 |
| Events in quadrant D | 3,830,314 | 450,949 |
| Mode M0 | |||
|---|---|---|---|
| Quadrant | BADHDUFLAG | Total packets | Discarded packets |
| A | 0 | 10626 | 3 |
| B | 0 | 24592 | 2 |
| C | 0 | 15093 | 2 |
| D | 0 | 14682 | 2 |
| Mode SS | |||
|---|---|---|---|
| Quadrant | BADHDUFLAG | Total packets | Discarded packets |
| A | 0 | 102 | 0 |
| B | 0 | 102 | 0 |
| C | 0 | 102 | 0 |
| D | 0 | 102 | 0 |
| Mode M9 | |||
|---|---|---|---|
| Quadrant | BADHDUFLAG | Total packets | Discarded packets |
| A | 0 | 30 | 0 |
| B | 0 | 30 | 0 |
| C | 0 | 30 | 0 |
| D | 0 | 31 | 0 |
| Quadrant | Total seconds | Saturated seconds | Saturation percentage |
|---|---|---|---|
| A | 5048 | 9 | 0.178288% |
| B | 5048 | 1787 | 35.400158% |
| C | 5048 | 339 | 6.715531% |
| D | 5048 | 193 | 3.823296% |
Noise dominated data is calculated using 1-second bins in cleaned event files. If a bin has >2000 counts, and if more than 50% of those come from <1% of pixels, then it is considered to be noise-dominated and hence unusable.
| Quadrant | # 1 sec bins | Bins with >0 counts | Bins with >2000 counts | High rate bins dominated by noise | Noise dominated (total time) | Noise dominated (detector-on time) | Marked lightcurve |
|---|---|---|---|---|---|---|---|
| A | 7081 | 5049 | 0 | 0 | 0.00% | 0.00% | 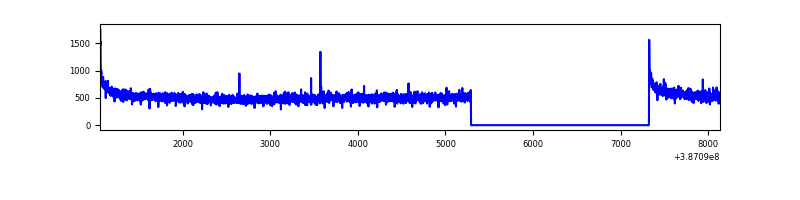 |
| B | 7081 | 5049 | 1446 | 1446 | 20.42% | 28.64% | 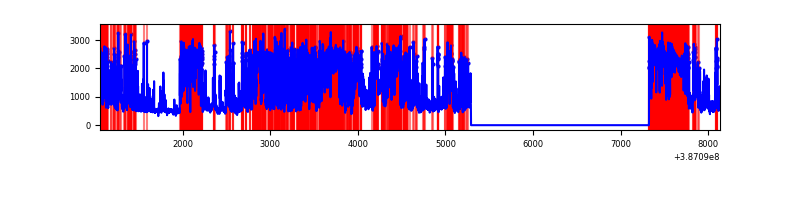 |
| C | 7081 | 5049 | 310 | 310 | 4.38% | 6.14% | 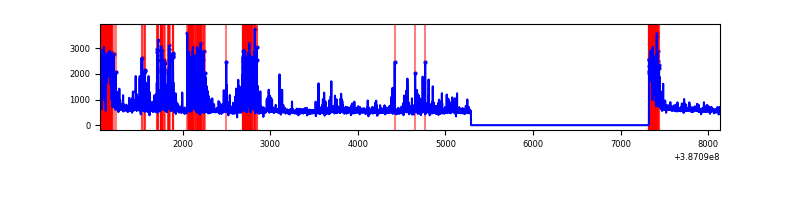 |
| D | 7081 | 5048 | 183 | 183 | 2.58% | 3.63% | 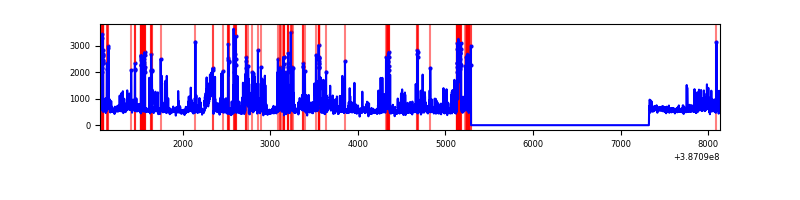 |
Top three noisy pixels from each quadrant. If the there are fewer than three noisy pixels in the level2.evt file, extra rows are filled as -1
| Pixel properties | Quadrant properties | ||||||
|---|---|---|---|---|---|---|---|
| Quadrant | DetID | PixID | Counts | Sigma | Mean | Median | Sigma |
| A | 10 | 83 | 97765 | 758.65 | 642 | 630 | 128.0 |
| A | 13 | 6 | 11263 | 83.05 | 642 | 630 | 128.0 |
| A | 13 | 254 | 8383 | 60.55 | 642 | 630 | 128.0 |
| B | 5 | 172 | 3722102 | 37369.93 | 530 | 517 | 99.6 |
| B | 5 | 236 | 1240104 | 12447.19 | 530 | 517 | 99.6 |
| B | 3 | 112 | 43514 | 431.75 | 530 | 517 | 99.6 |
| C | 0 | 10 | 1195408 | 8563.3 | 613 | 621 | 139.5 |
| C | 15 | 214 | 204623 | 1462.13 | 613 | 621 | 139.5 |
| C | 4 | 254 | 82454 | 586.51 | 613 | 621 | 139.5 |
| D | 7 | 80 | 645672 | 4290.77 | 627 | 611 | 150.3 |
| D | 13 | 249 | 145862 | 966.17 | 627 | 611 | 150.3 |
| D | 13 | 13 | 142062 | 940.89 | 627 | 611 | 150.3 |
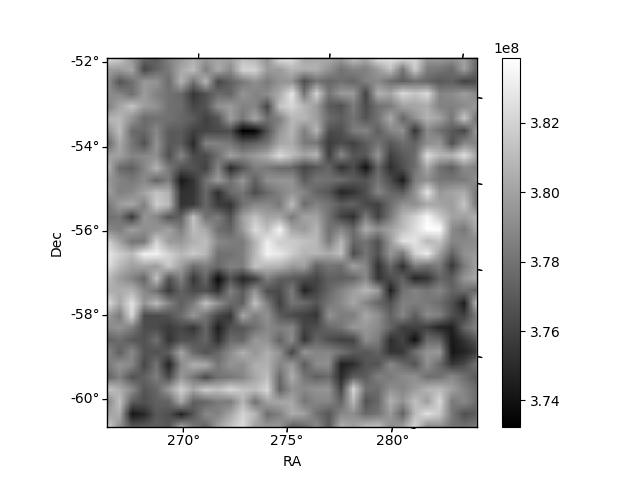
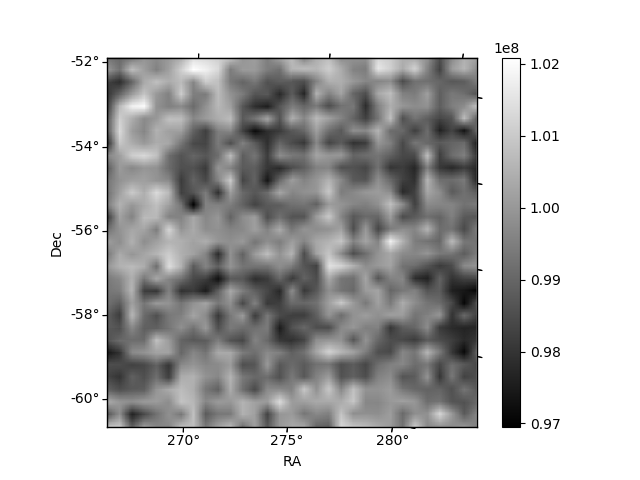
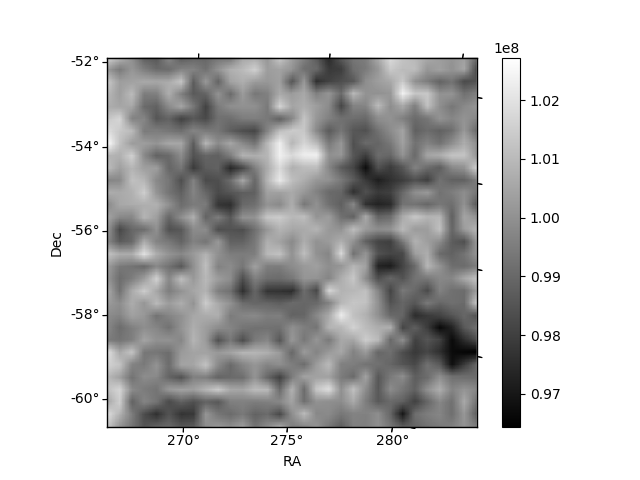
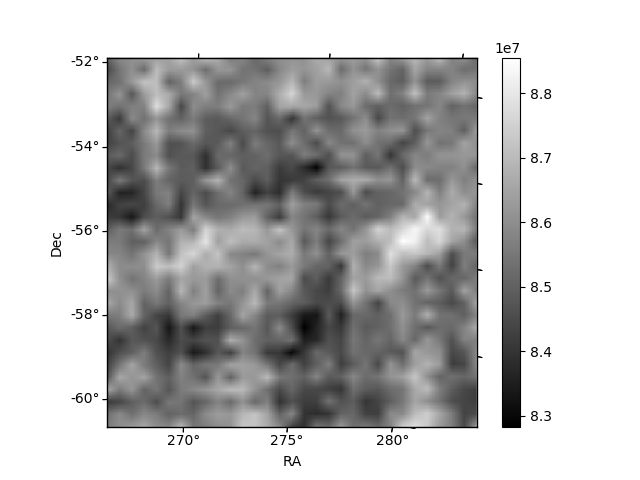
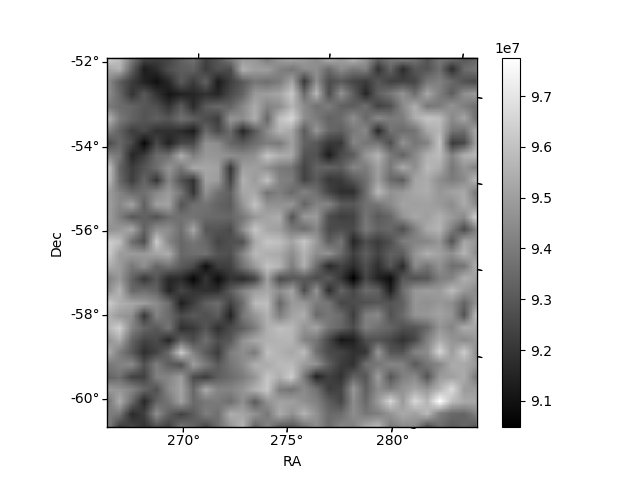
Histogram calculated using DETX and DETY for each event in the final _common_clean file
| Quadrant A | 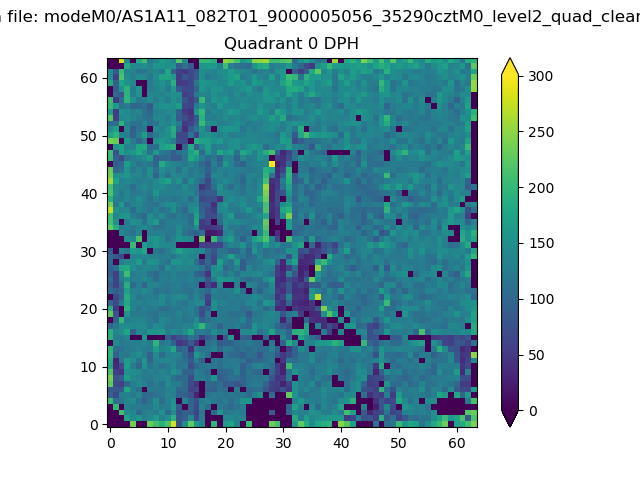 |
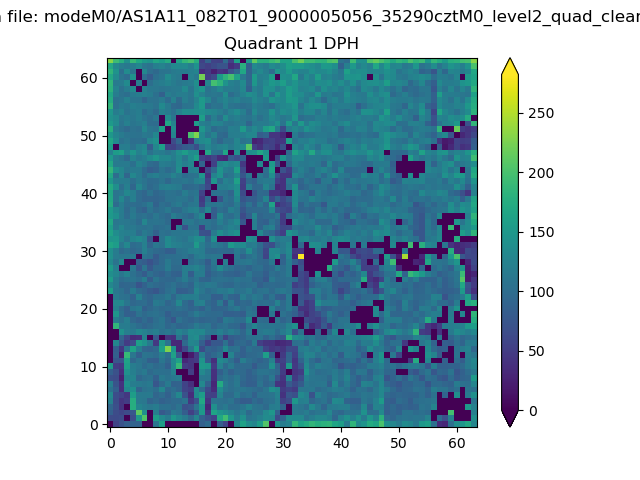 |
Quadrant B |
|---|---|---|---|
| Quadrant D | 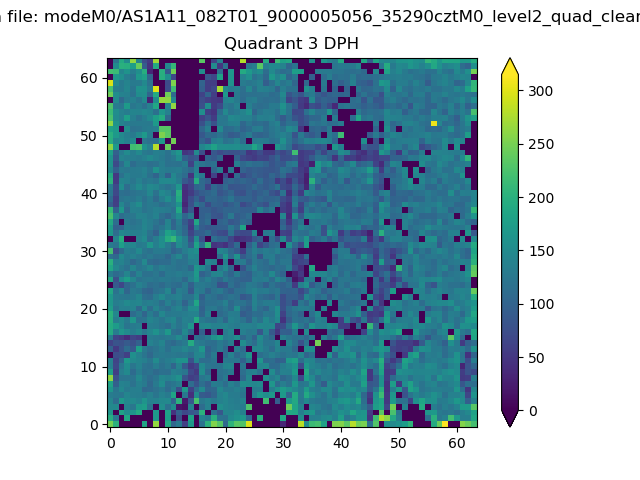 |
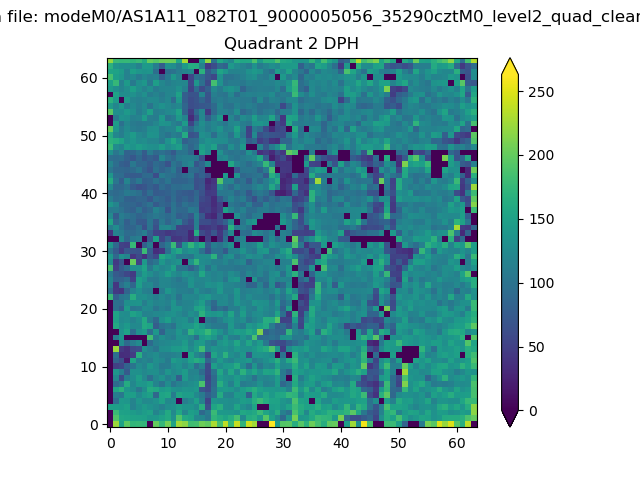 |
Quadrant C |
| Plot type | Count rate plots | Images |
|---|---|---|
| Comparison with Poisson distribution Blue bars denote a histogram of data divided into 1 sec bins. Red curve is a Poisson curve with rate = median count rate of data. |
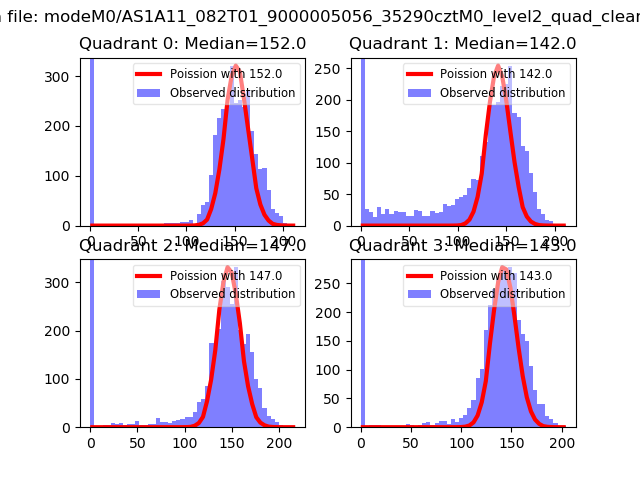 |
 |
| Quadrant-wise count rates Data is divided into 100 sec bins |
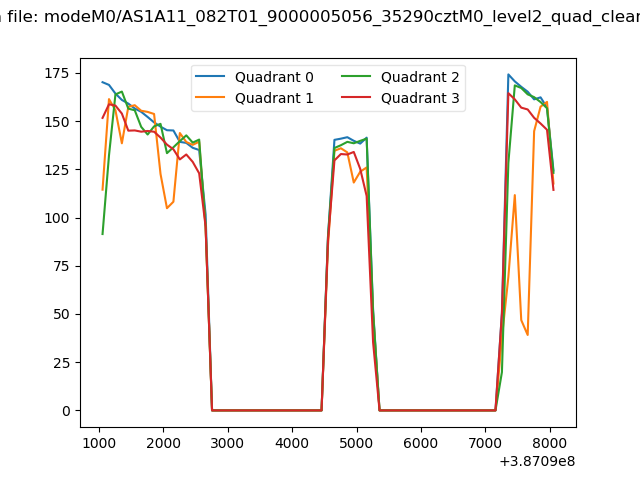 |
|
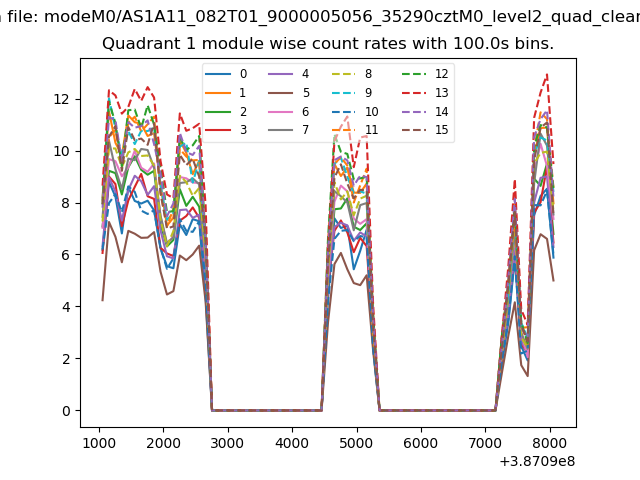
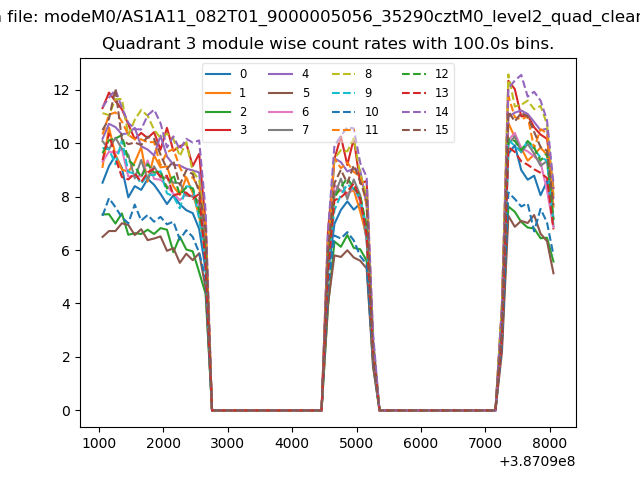
| Module-wise count rates for Quadrant A Data is divided into 100 sec bins |
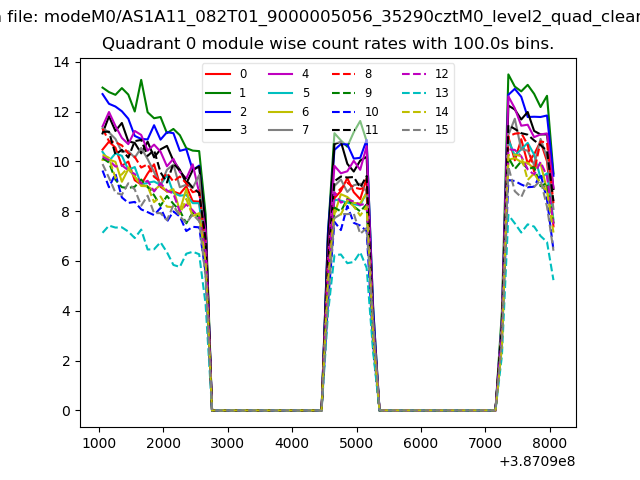 |
 |
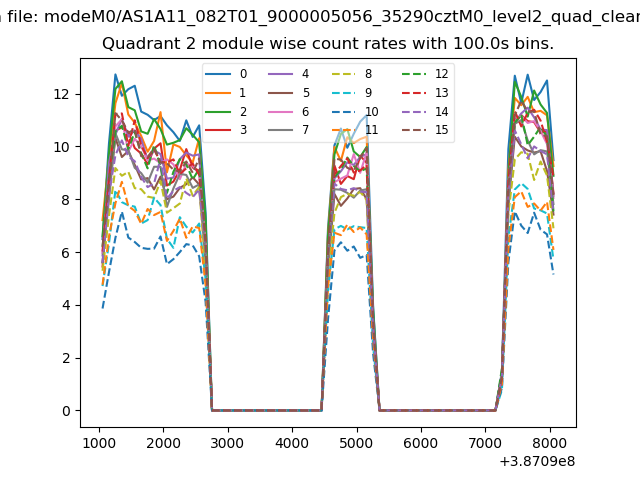
| Module-wise count rates for Quadrant B Data is divided into 100 sec bins |
 |
 |
| Module-wise count rates for Quadrant C Data is divided into 100 sec bins |
 |
 |
| Module-wise count rates for Quadrant D Data is divided into 100 sec bins |
 |
 |
| Parameter | Plot |
|---|---|
| CZT HV Monitor | 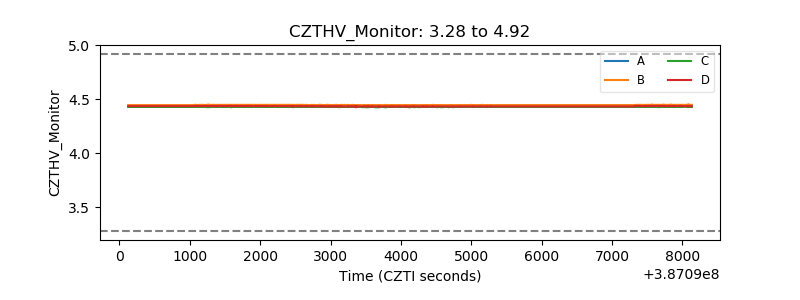 |
| D_VDD | 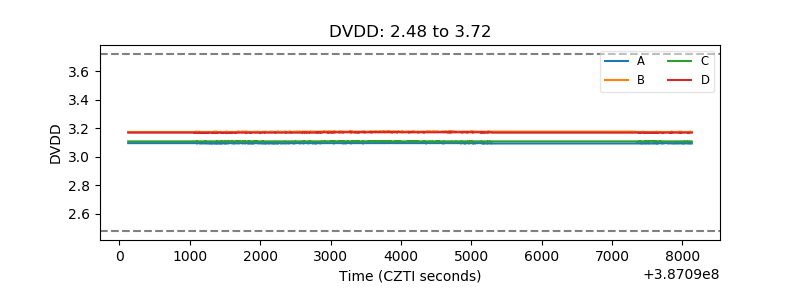 |
| Temperature 1 | 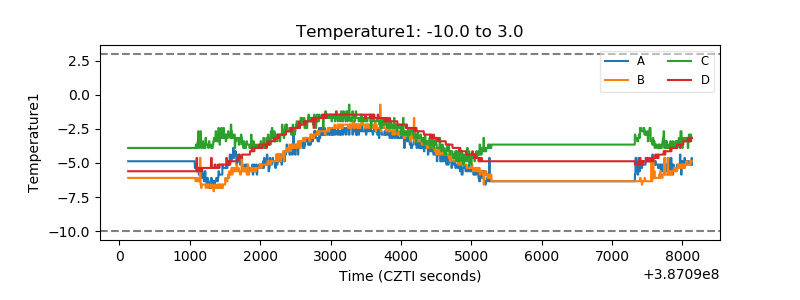 |
| Veto HV Monitor | 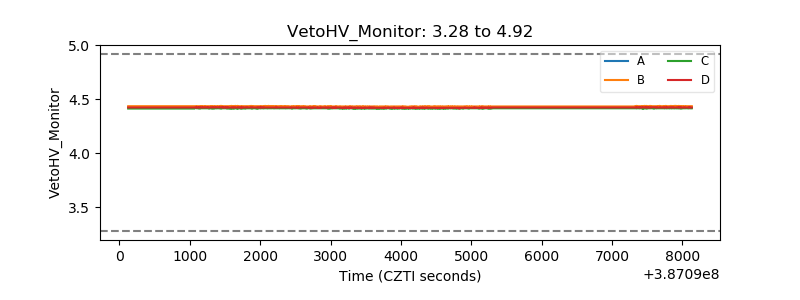 |
| Veto LLD | 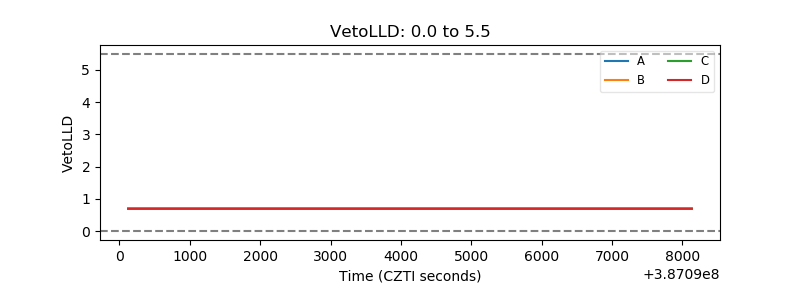 |
| Alpha Counter | 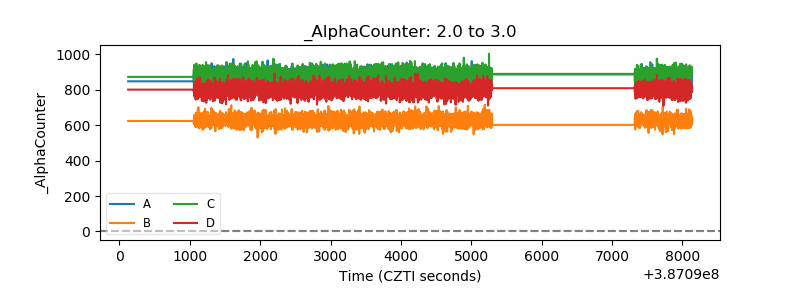 |
| _CPM_Rate | 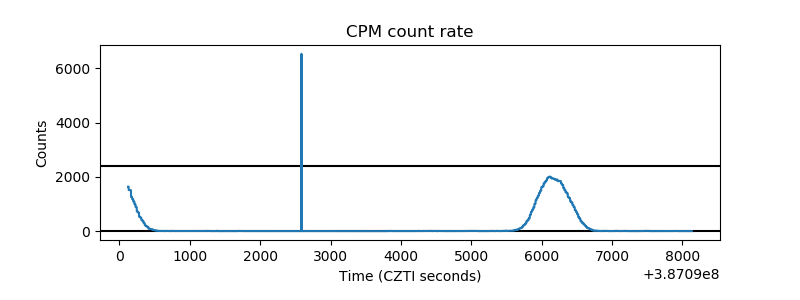 |
| CZT Counter | 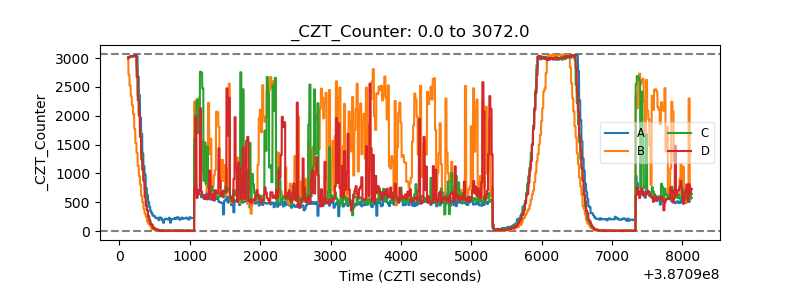 |
| +2.5 Volts monitor | 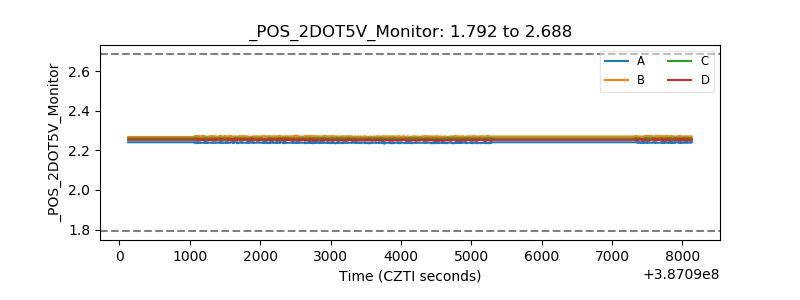 |
| +5 Volts monitor | 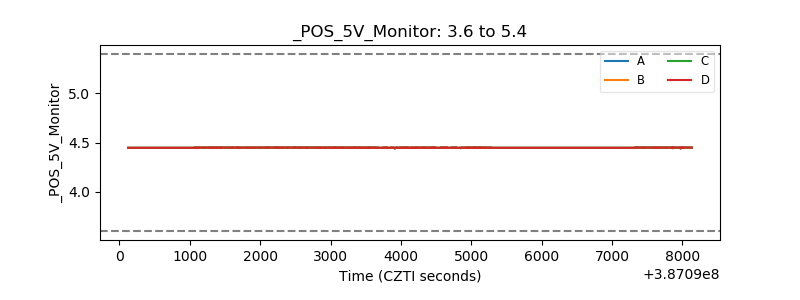 |
| _ROLL_ROT | 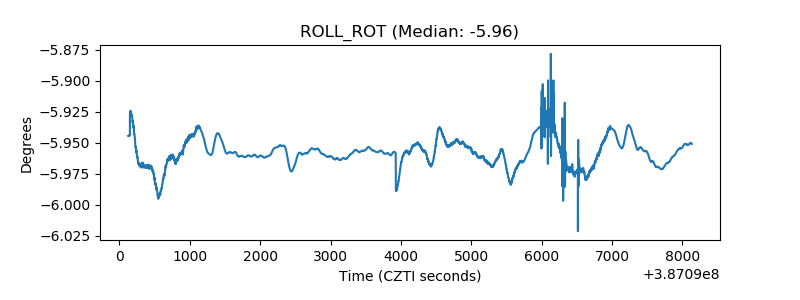 |
| _Roll_DEC | 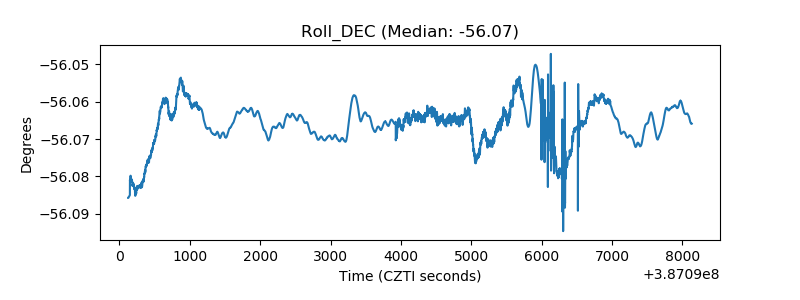 |
| _Roll_RA | 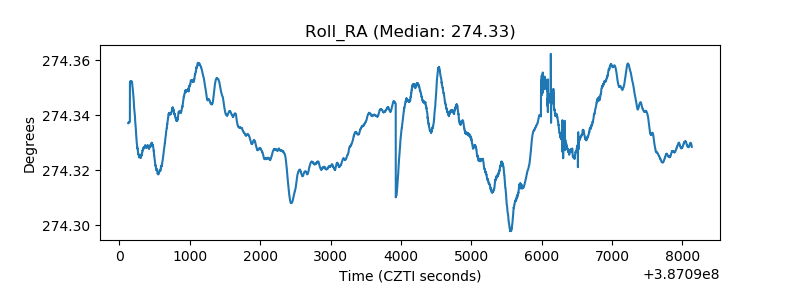 |
| Veto Counter | 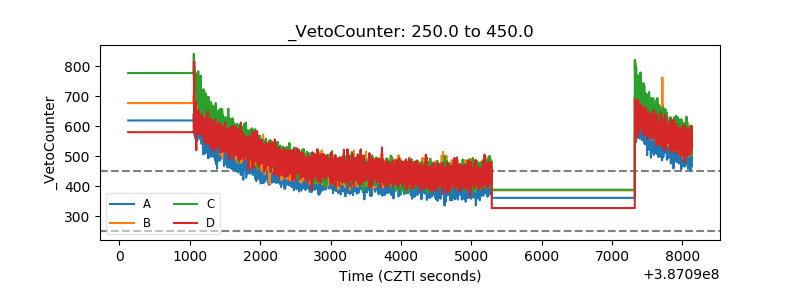 |