| Param | Original file | Final file |
|---|---|---|
| Filename | modeM0/AS1A11_082T01_9000005056_35289cztM0_level2.evt | modeM0/AS1A11_082T01_9000005056_35289cztM0_level2_quad_clean.evt |
| Size (bytes) | 607,374,720 | 70,297,920 |
| Size | 579.2 MB | 67.0 MB |
| Events in quadrant A | 2,561,717 | 472,599 |
| Events in quadrant B | 7,523,214 | 388,425 |
| Events in quadrant C | 3,876,837 | 461,814 |
| Events in quadrant D | 4,082,598 | 442,664 |
| Mode M0 | |||
|---|---|---|---|
| Quadrant | BADHDUFLAG | Total packets | Discarded packets |
| A | 0 | 10732 | 3 |
| B | 0 | 25930 | 2 |
| C | 0 | 14976 | 2 |
| D | 0 | 15557 | 2 |
| Mode SS | |||
|---|---|---|---|
| Quadrant | BADHDUFLAG | Total packets | Discarded packets |
| A | 0 | 106 | 0 |
| B | 0 | 106 | 0 |
| C | 0 | 106 | 0 |
| D | 0 | 106 | 0 |
| Mode M9 | |||
|---|---|---|---|
| Quadrant | BADHDUFLAG | Total packets | Discarded packets |
| A | 0 | 27 | 0 |
| B | 0 | 27 | 0 |
| C | 0 | 27 | 0 |
| D | 0 | 28 | 0 |
| Quadrant | Total seconds | Saturated seconds | Saturation percentage |
|---|---|---|---|
| A | 5169 | 8 | 0.154769% |
| B | 5169 | 2048 | 39.620816% |
| C | 5169 | 260 | 5.029986% |
| D | 5169 | 314 | 6.074676% |
Noise dominated data is calculated using 1-second bins in cleaned event files. If a bin has >2000 counts, and if more than 50% of those come from <1% of pixels, then it is considered to be noise-dominated and hence unusable.
| Quadrant | # 1 sec bins | Bins with >0 counts | Bins with >2000 counts | High rate bins dominated by noise | Noise dominated (total time) | Noise dominated (detector-on time) | Marked lightcurve |
|---|---|---|---|---|---|---|---|
| A | 7083 | 5170 | 0 | 0 | 0.00% | 0.00% | 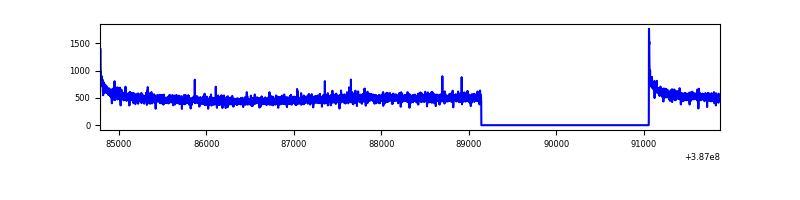 |
| B | 7083 | 5169 | 1669 | 1669 | 23.56% | 32.29% | 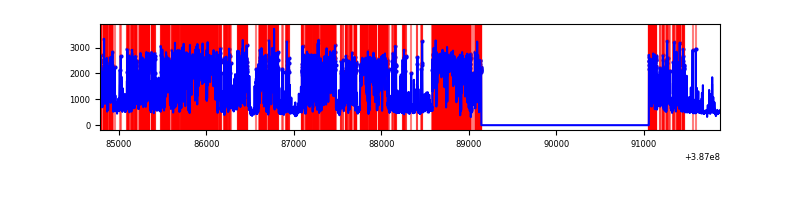 |
| C | 7083 | 5170 | 225 | 225 | 3.18% | 4.35% | 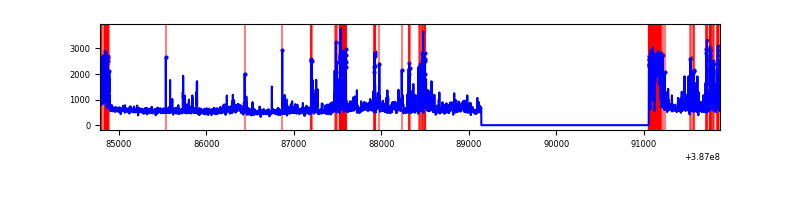 |
| D | 7083 | 5170 | 300 | 300 | 4.24% | 5.80% |  |
Top three noisy pixels from each quadrant. If the there are fewer than three noisy pixels in the level2.evt file, extra rows are filled as -1
| Pixel properties | Quadrant properties | ||||||
|---|---|---|---|---|---|---|---|
| Quadrant | DetID | PixID | Counts | Sigma | Mean | Median | Sigma |
| A | 10 | 83 | 96485 | 755.45 | 634 | 621 | 126.9 |
| A | 13 | 254 | 8880 | 65.08 | 634 | 621 | 126.9 |
| A | 13 | 6 | 7330 | 52.87 | 634 | 621 | 126.9 |
| B | 5 | 172 | 2987975 | 30349.07 | 522 | 509 | 98.4 |
| B | 5 | 236 | 2475767 | 25145.65 | 522 | 509 | 98.4 |
| B | 12 | 111 | 11602 | 112.69 | 522 | 509 | 98.4 |
| C | 0 | 10 | 1117875 | 7884.86 | 616 | 622 | 141.7 |
| C | 15 | 214 | 210793 | 1483.25 | 616 | 622 | 141.7 |
| C | 4 | 254 | 100897 | 707.68 | 616 | 622 | 141.7 |
| D | 7 | 80 | 678364 | 4554.41 | 616 | 600 | 148.8 |
| D | 2 | 249 | 345003 | 2314.3 | 616 | 600 | 148.8 |
| D | 13 | 249 | 248678 | 1667.02 | 616 | 600 | 148.8 |
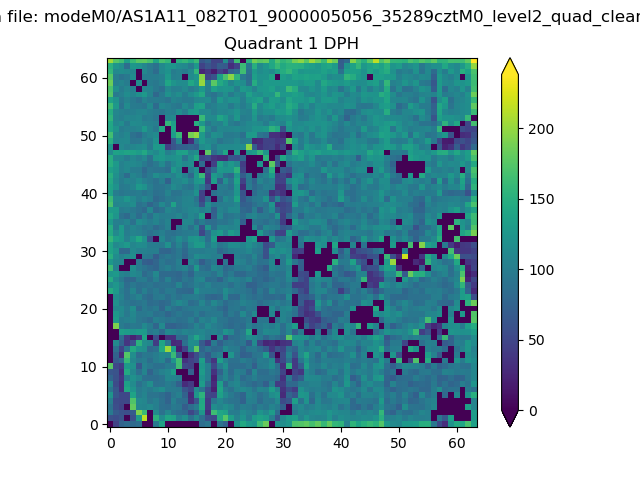
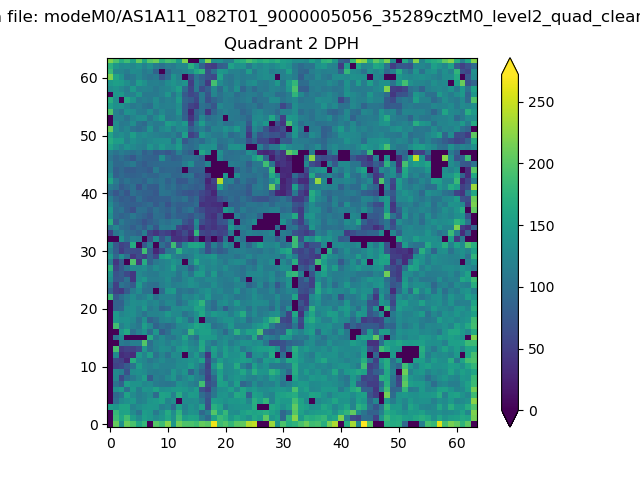
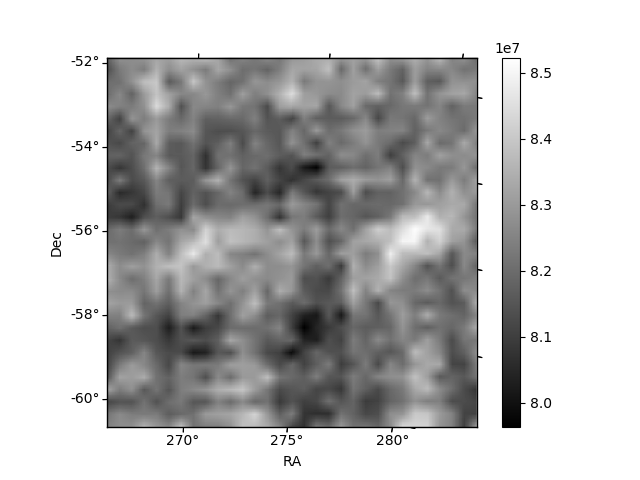
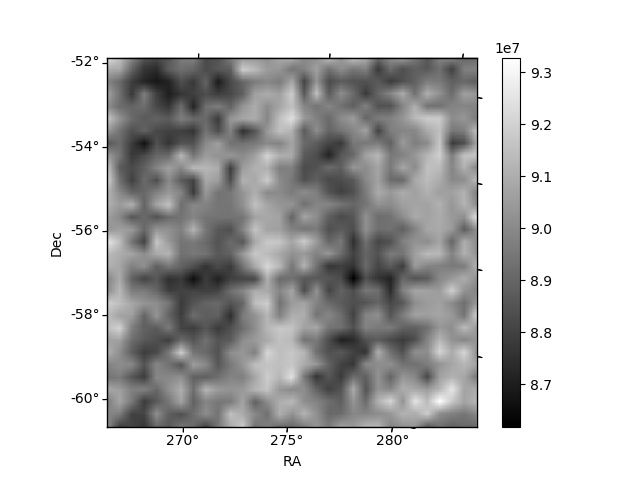
Histogram calculated using DETX and DETY for each event in the final _common_clean file
| Quadrant A | 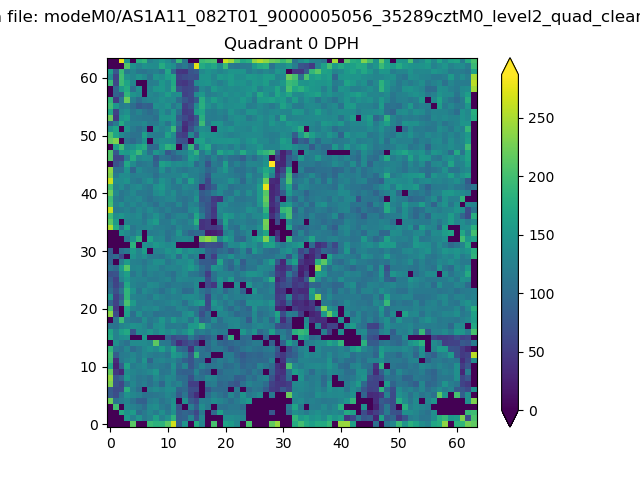 |
 |
Quadrant B |
|---|---|---|---|
| Quadrant D |  |
 |
Quadrant C |
| Plot type | Count rate plots | Images |
|---|---|---|
| Comparison with Poisson distribution Blue bars denote a histogram of data divided into 1 sec bins. Red curve is a Poisson curve with rate = median count rate of data. |
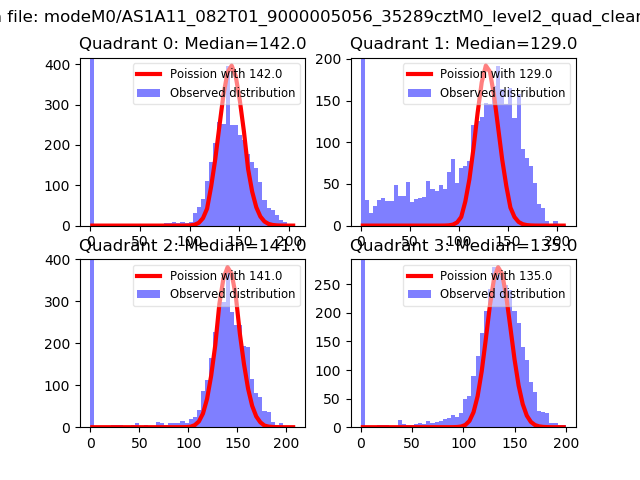 |
 |
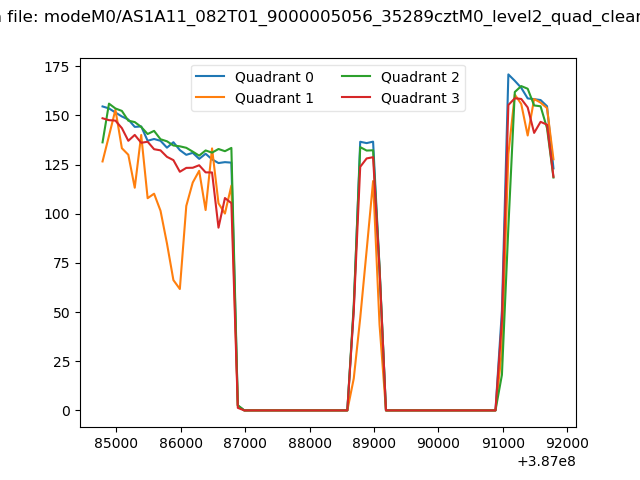
| Quadrant-wise count rates Data is divided into 100 sec bins |
 |
|
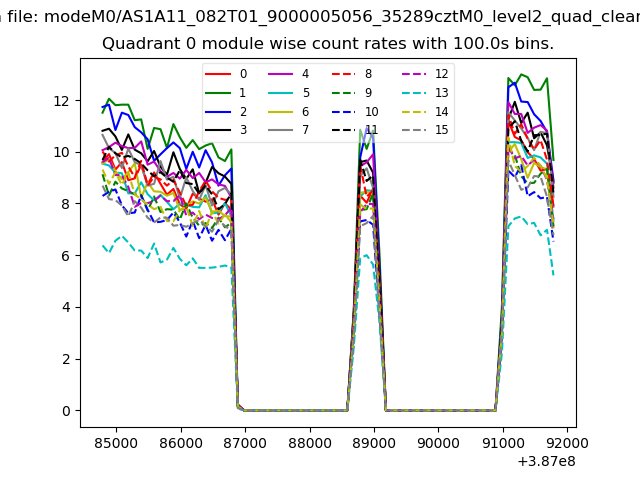
| Module-wise count rates for Quadrant A Data is divided into 100 sec bins |
 |
 |
| Module-wise count rates for Quadrant B Data is divided into 100 sec bins |
 |
 |
| Module-wise count rates for Quadrant C Data is divided into 100 sec bins |
 |
 |
| Module-wise count rates for Quadrant D Data is divided into 100 sec bins |
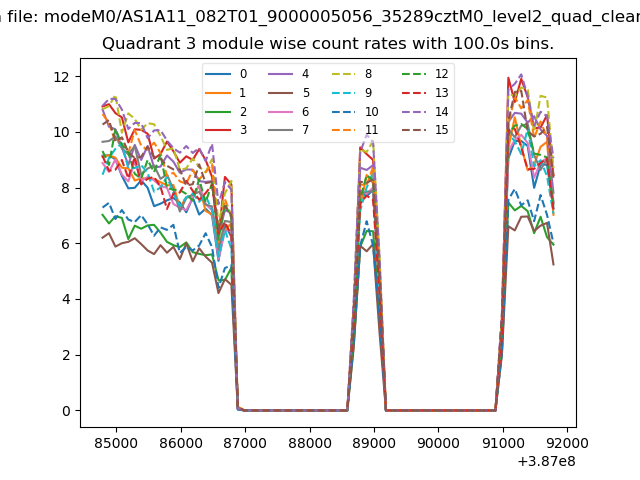 |
 |
| Parameter | Plot |
|---|---|
| CZT HV Monitor | 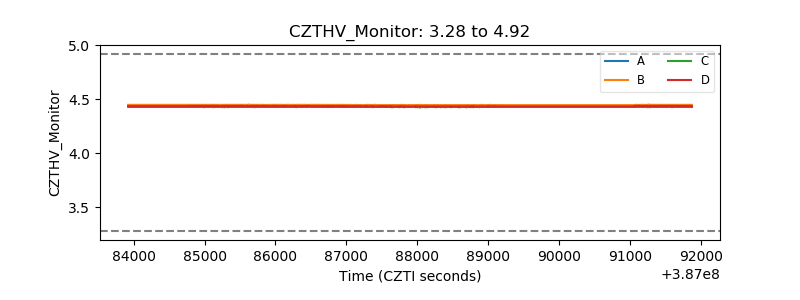 |
| D_VDD | 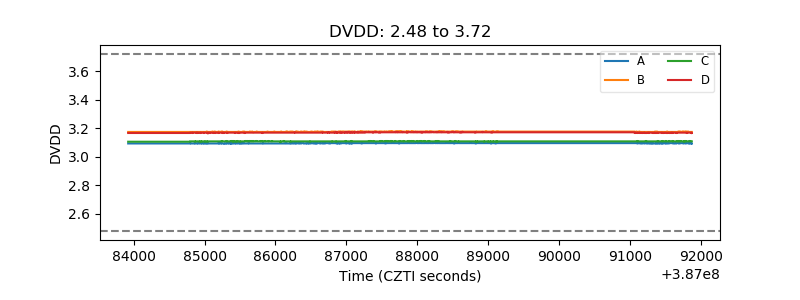 |
| Temperature 1 | 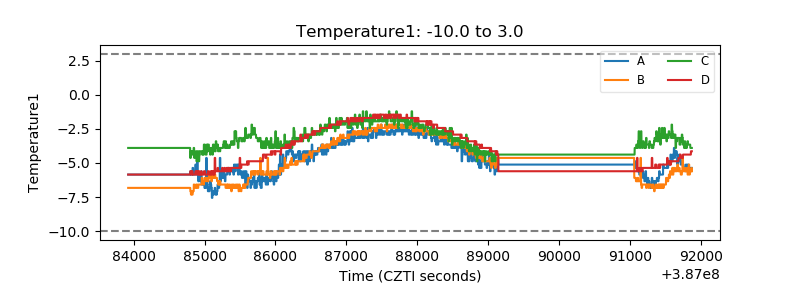 |
| Veto HV Monitor | 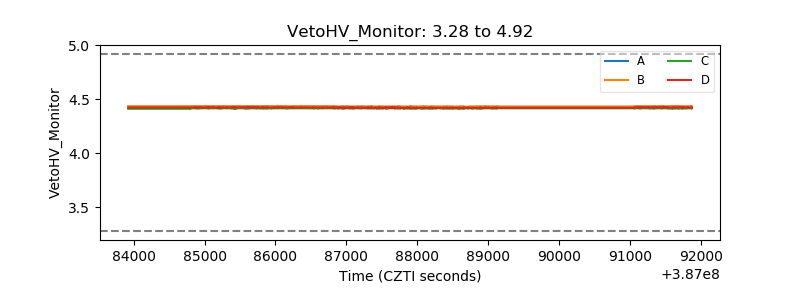 |
| Veto LLD | 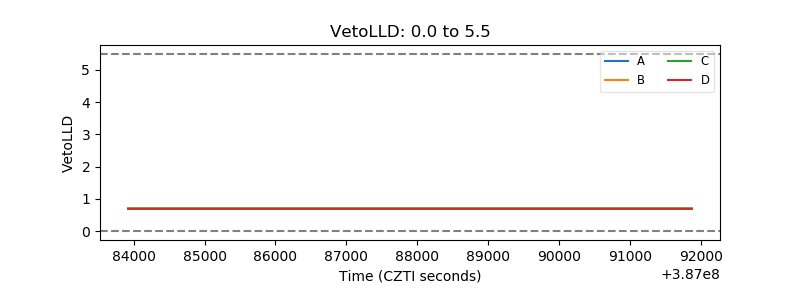 |
| Alpha Counter | 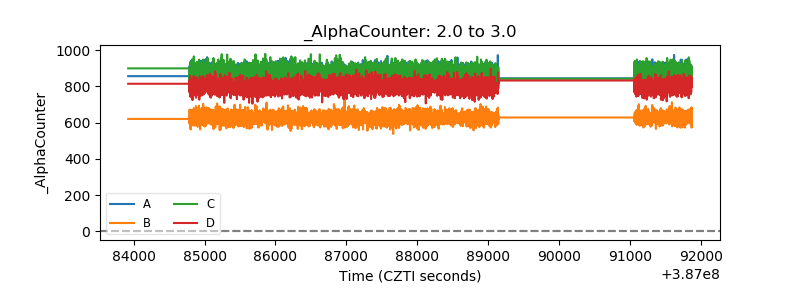 |
| _CPM_Rate | 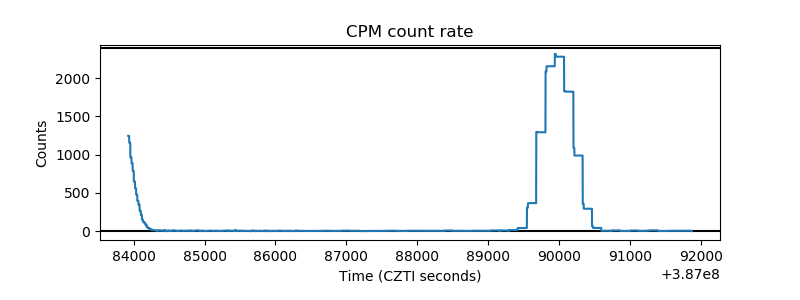 |
| CZT Counter | 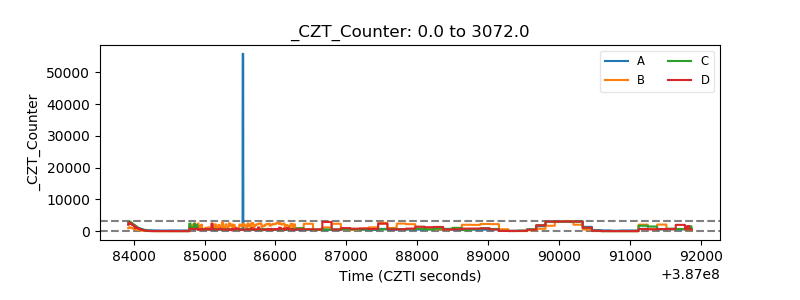 |
| +2.5 Volts monitor | 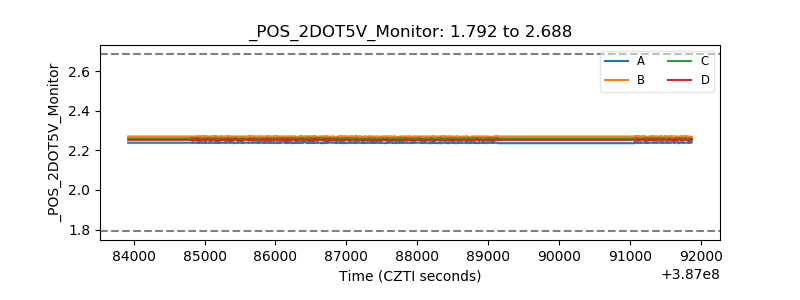 |
| +5 Volts monitor | 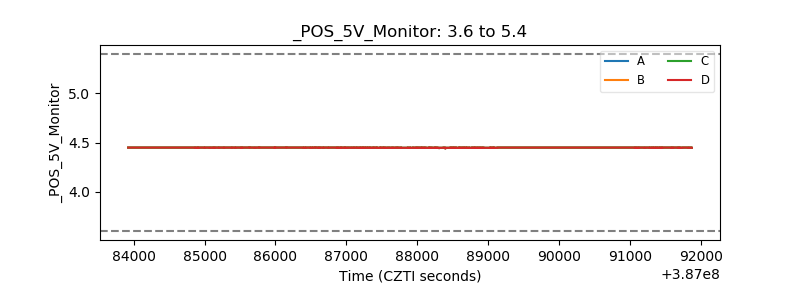 |
| _ROLL_ROT | 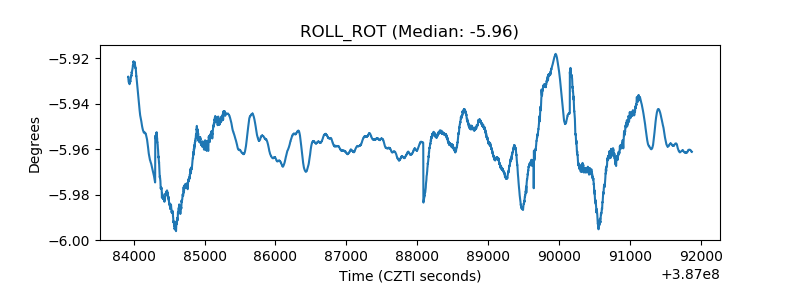 |
| _Roll_DEC | 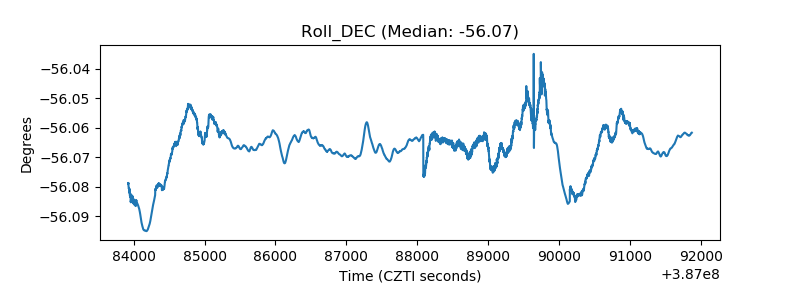 |
| _Roll_RA | 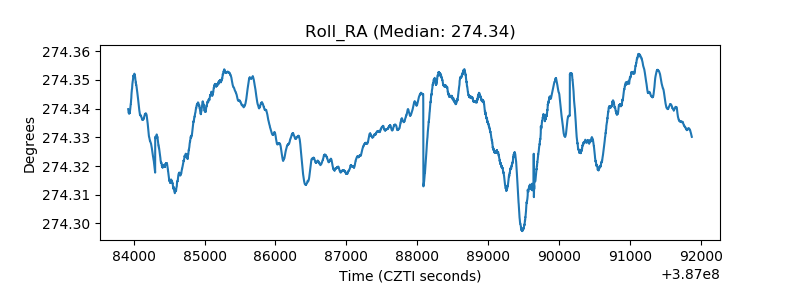 |
| Veto Counter | 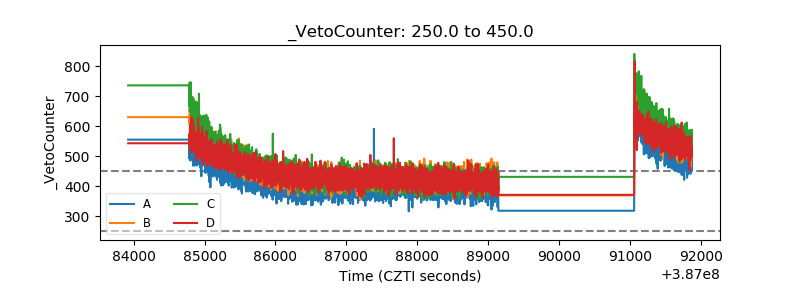 |