| Param | Original file | Final file |
|---|---|---|
| Filename | modeM0/AS1A11_082T01_9000005056_35284cztM0_level2.evt | modeM0/AS1A11_082T01_9000005056_35284cztM0_level2_quad_clean.evt |
| Size (bytes) | 910,428,480 | 118,177,920 |
| Size | 868.3 MB | 112.7 MB |
| Events in quadrant A | 3,515,036 | 830,514 |
| Events in quadrant B | 9,480,361 | 720,631 |
| Events in quadrant C | 5,601,088 | 798,345 |
| Events in quadrant D | 8,457,837 | 693,539 |
| Mode M0 | |||
|---|---|---|---|
| Quadrant | BADHDUFLAG | Total packets | Discarded packets |
| A | 0 | 15689 | 3 |
| B | 0 | 33441 | 2 |
| C | 0 | 21771 | 2 |
| D | 0 | 30422 | 2 |
| Mode SS | |||
|---|---|---|---|
| Quadrant | BADHDUFLAG | Total packets | Discarded packets |
| A | 0 | 156 | 0 |
| B | 0 | 156 | 0 |
| C | 0 | 156 | 0 |
| D | 0 | 156 | 0 |
| Mode M9 | |||
|---|---|---|---|
| Quadrant | BADHDUFLAG | Total packets | Discarded packets |
| A | 0 | 23 | 0 |
| B | 0 | 23 | 0 |
| C | 0 | 23 | 0 |
| D | 0 | 24 | 0 |
| Quadrant | Total seconds | Saturated seconds | Saturation percentage |
|---|---|---|---|
| A | 7687 | 13 | 0.169117% |
| B | 7687 | 2082 | 27.084688% |
| C | 7687 | 229 | 2.979056% |
| D | 7687 | 1477 | 19.214258% |
Noise dominated data is calculated using 1-second bins in cleaned event files. If a bin has >2000 counts, and if more than 50% of those come from <1% of pixels, then it is considered to be noise-dominated and hence unusable.
| Quadrant | # 1 sec bins | Bins with >0 counts | Bins with >2000 counts | High rate bins dominated by noise | Noise dominated (total time) | Noise dominated (detector-on time) | Marked lightcurve |
|---|---|---|---|---|---|---|---|
| A | 9000 | 7688 | 0 | 0 | 0.00% | 0.00% | 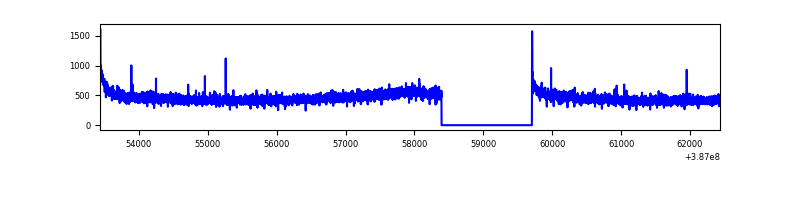 |
| B | 8999 | 7687 | 1677 | 1677 | 18.64% | 21.82% | 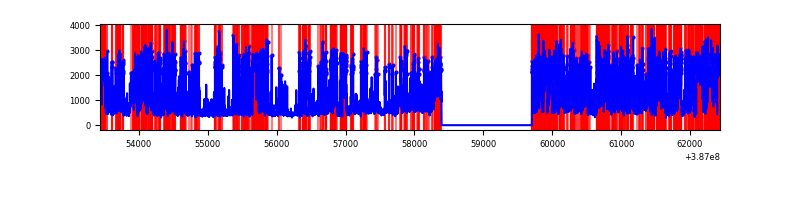 |
| C | 9000 | 7688 | 220 | 220 | 2.44% | 2.86% | 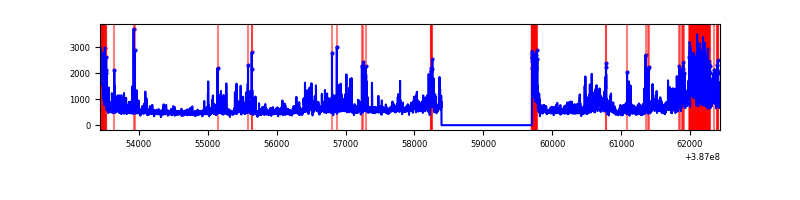 |
| D | 9000 | 7688 | 1294 | 1294 | 14.38% | 16.83% | 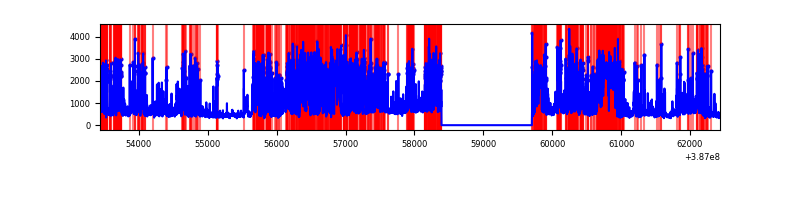 |
Top three noisy pixels from each quadrant. If the there are fewer than three noisy pixels in the level2.evt file, extra rows are filled as -1
| Pixel properties | Quadrant properties | ||||||
|---|---|---|---|---|---|---|---|
| Quadrant | DetID | PixID | Counts | Sigma | Mean | Median | Sigma |
| A | 10 | 83 | 112814 | 638.95 | 872 | 854 | 175.2 |
| A | 13 | 6 | 13932 | 74.63 | 872 | 854 | 175.2 |
| A | 13 | 254 | 13209 | 70.51 | 872 | 854 | 175.2 |
| B | 5 | 172 | 3864136 | 26010.68 | 771 | 751 | 148.5 |
| B | 5 | 236 | 2373838 | 15977.08 | 771 | 751 | 148.5 |
| B | 3 | 112 | 127543 | 853.64 | 771 | 751 | 148.5 |
| C | 15 | 159 | 664480 | 3343.16 | 845 | 849 | 198.5 |
| C | 0 | 10 | 587109 | 2953.39 | 845 | 849 | 198.5 |
| C | 4 | 254 | 581729 | 2926.29 | 845 | 849 | 198.5 |
| D | 7 | 80 | 2918996 | 15337.29 | 775 | 753 | 190.3 |
| D | 2 | 249 | 758019 | 3979.93 | 775 | 753 | 190.3 |
| D | 13 | 249 | 704017 | 3696.12 | 775 | 753 | 190.3 |
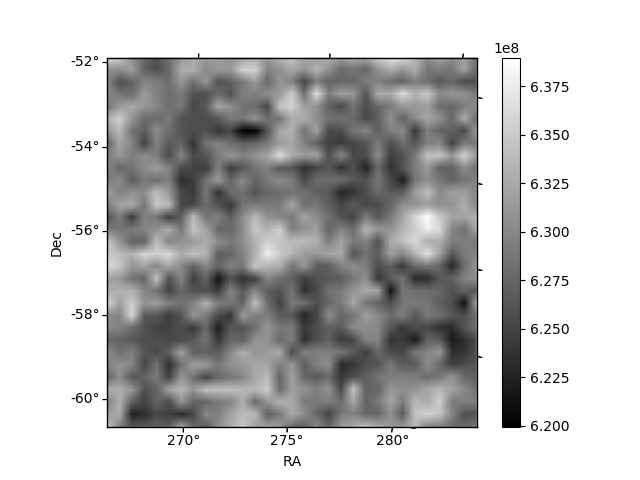
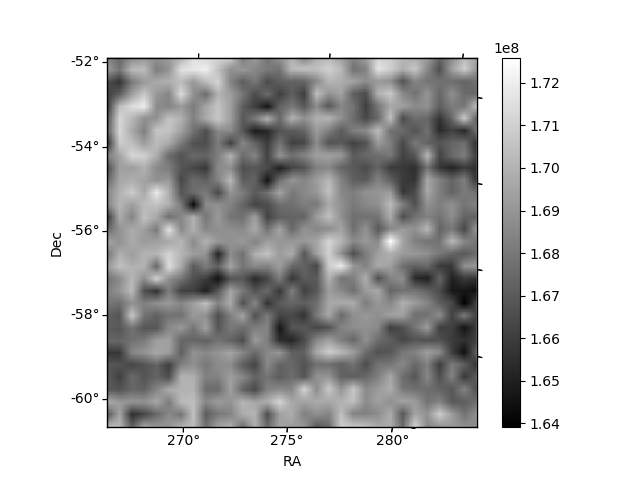
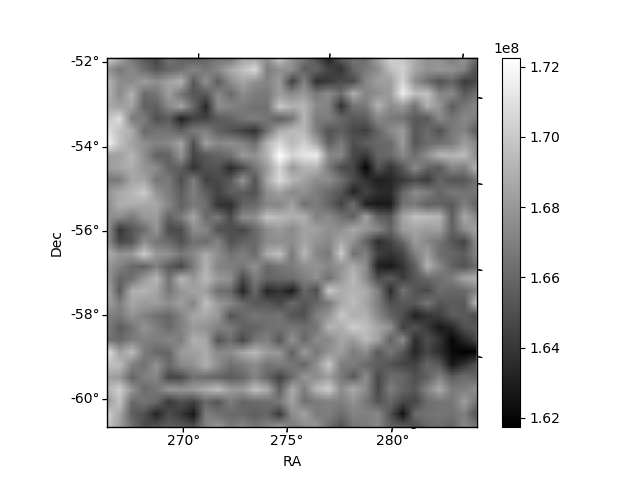
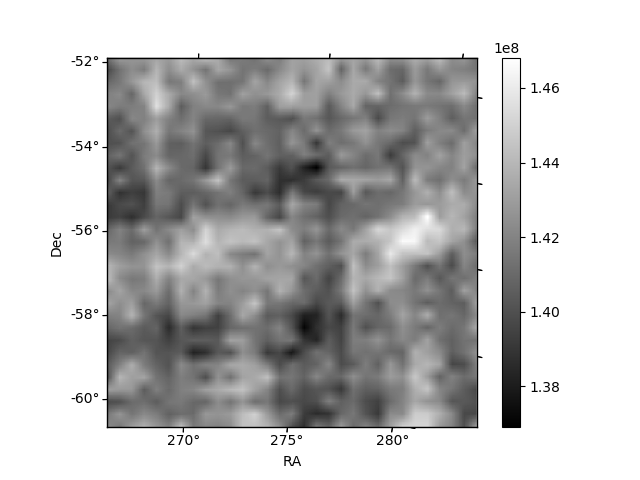
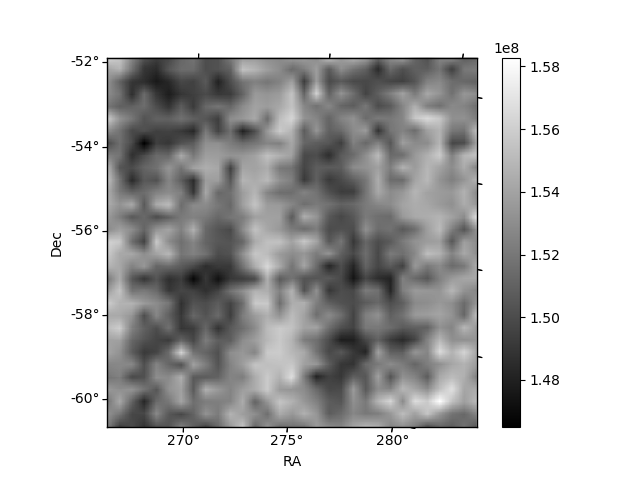
Histogram calculated using DETX and DETY for each event in the final _common_clean file
| Quadrant A | 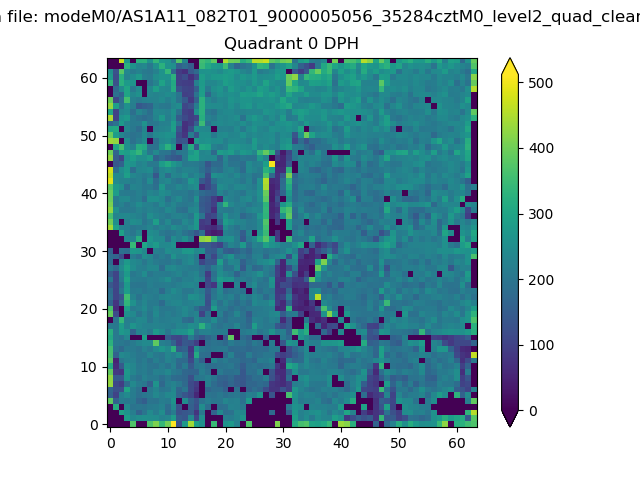 |
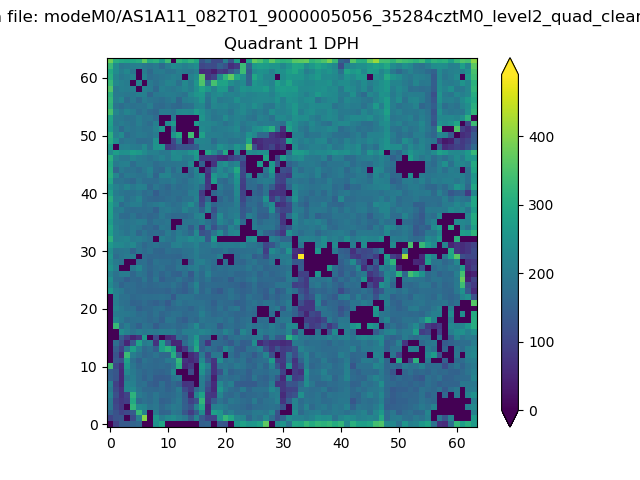 |
Quadrant B |
|---|---|---|---|
| Quadrant D | 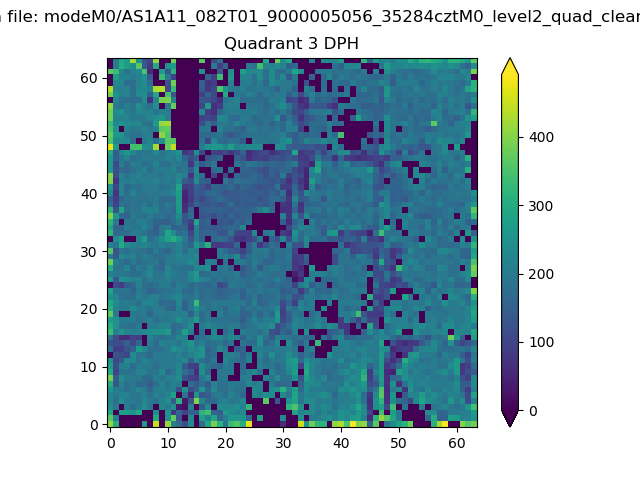 |
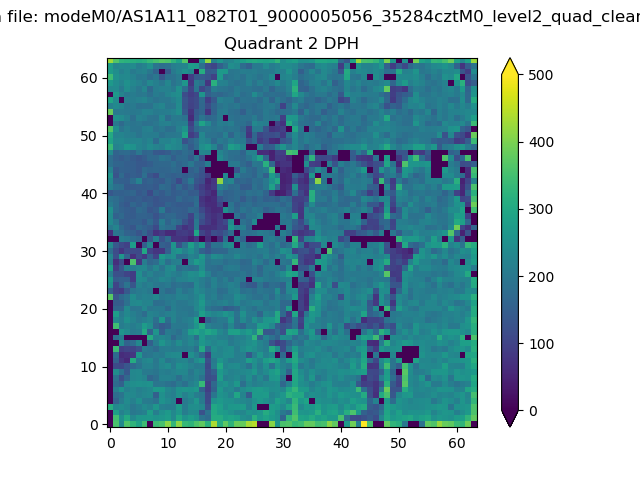 |
Quadrant C |
| Plot type | Count rate plots | Images |
|---|---|---|
| Comparison with Poisson distribution Blue bars denote a histogram of data divided into 1 sec bins. Red curve is a Poisson curve with rate = median count rate of data. |
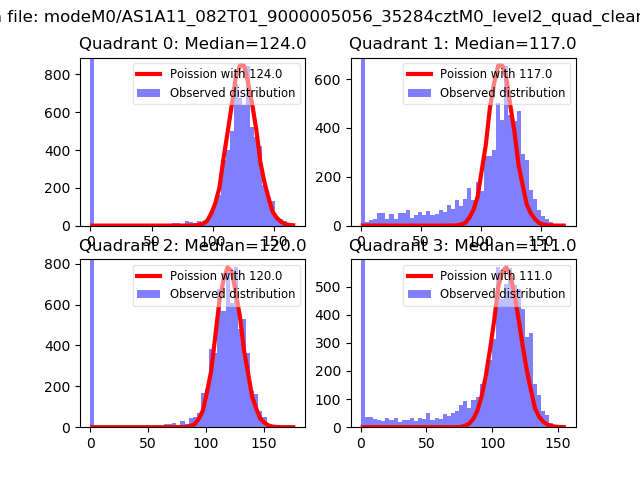 |
 |
| Quadrant-wise count rates Data is divided into 100 sec bins |
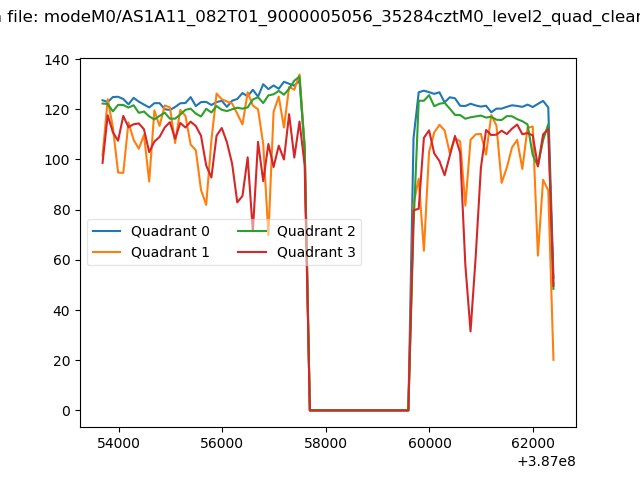 |
|
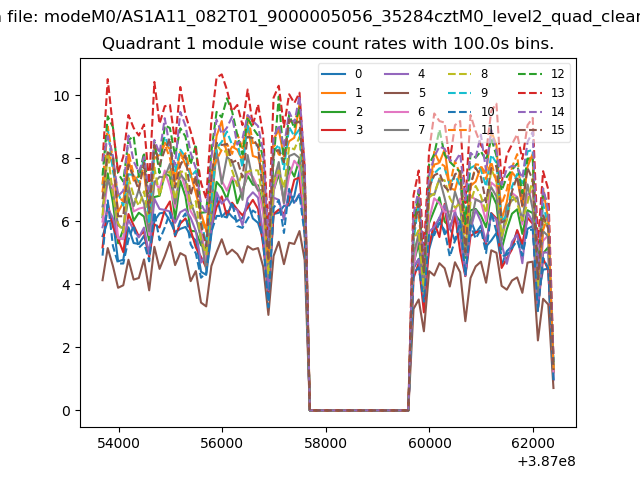
| Module-wise count rates for Quadrant A Data is divided into 100 sec bins |
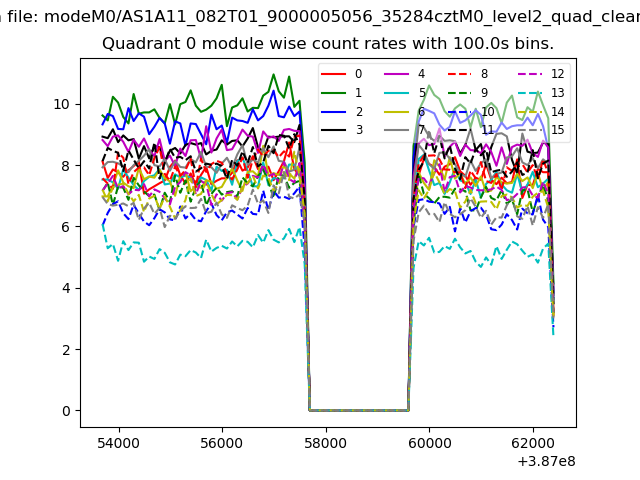 |
 |
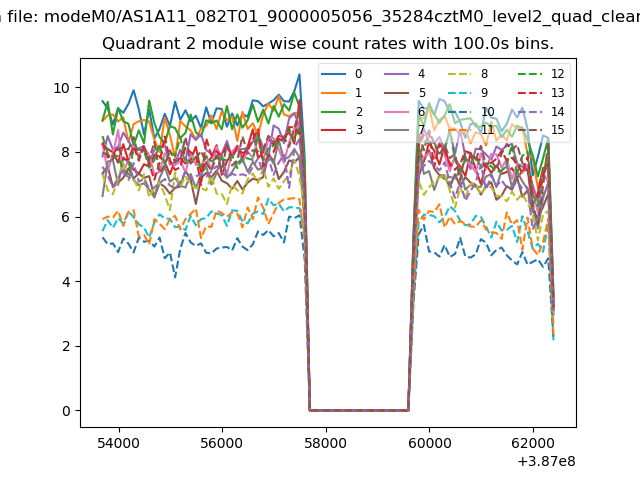
| Module-wise count rates for Quadrant B Data is divided into 100 sec bins |
 |
 |
| Module-wise count rates for Quadrant C Data is divided into 100 sec bins |
 |
 |
| Module-wise count rates for Quadrant D Data is divided into 100 sec bins |
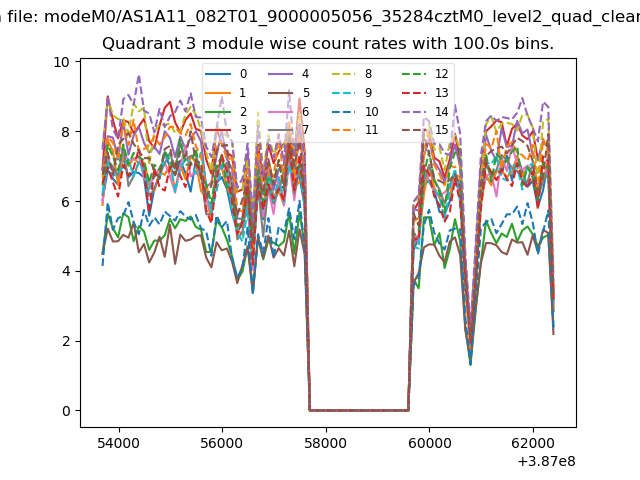 |
 |
| Parameter | Plot |
|---|---|
| CZT HV Monitor | 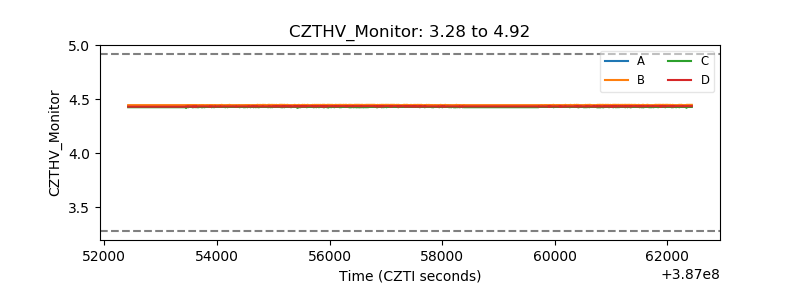 |
| D_VDD | 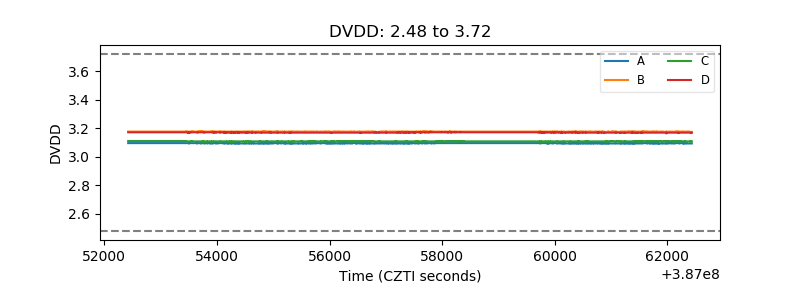 |
| Temperature 1 | 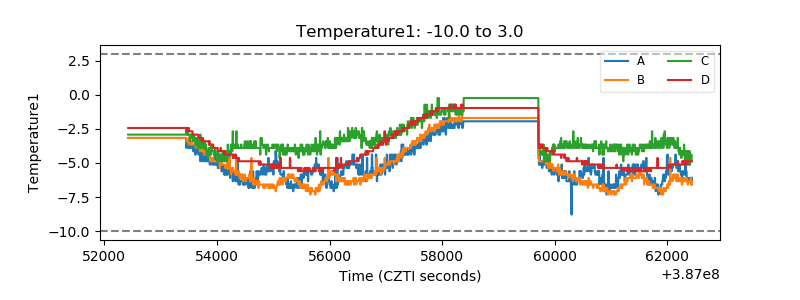 |
| Veto HV Monitor | 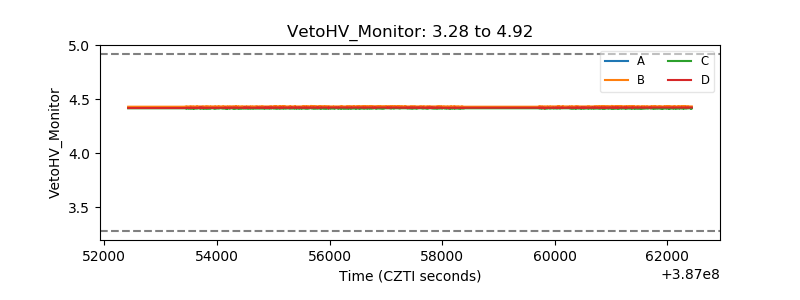 |
| Veto LLD | 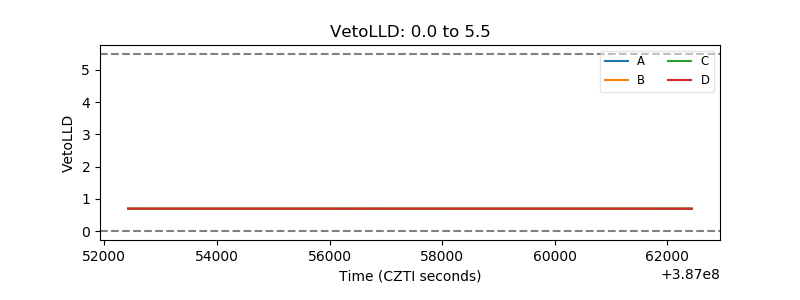 |
| Alpha Counter | 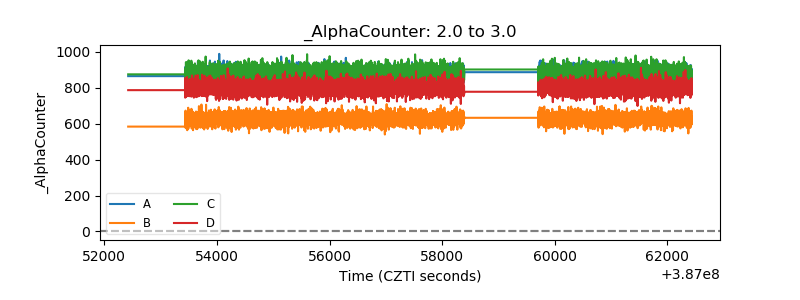 |
| _CPM_Rate | 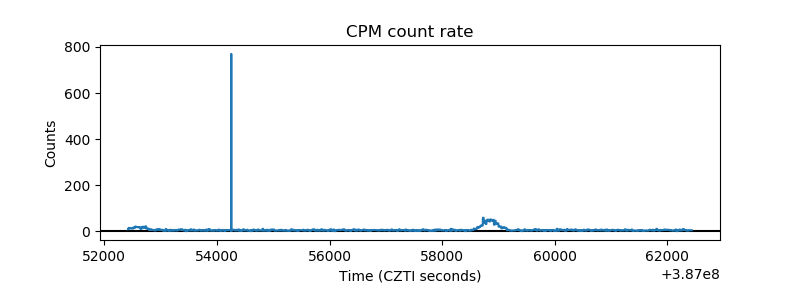 |
| CZT Counter | 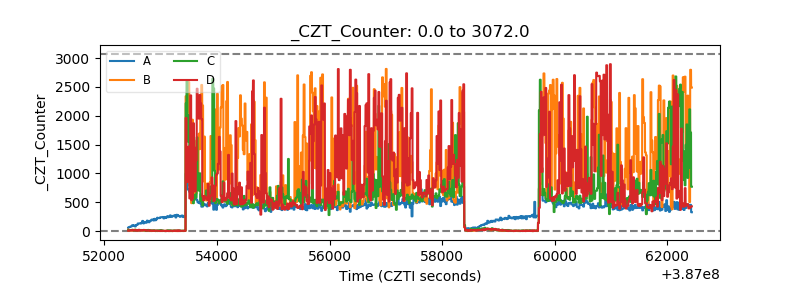 |
| +2.5 Volts monitor | 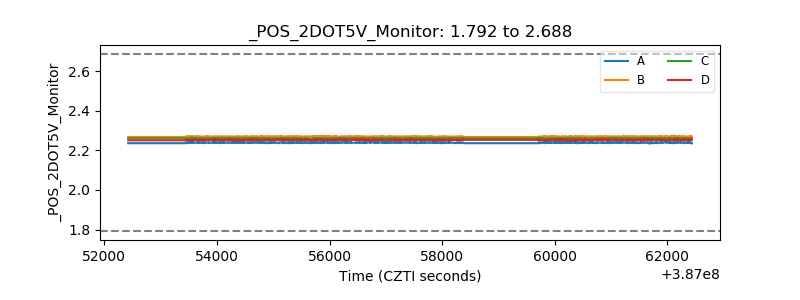 |
| +5 Volts monitor | 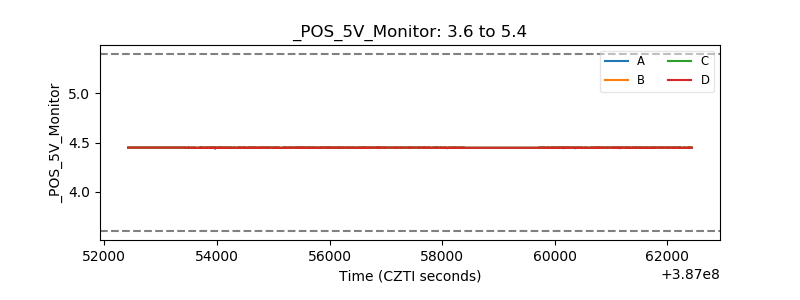 |
| _ROLL_ROT | 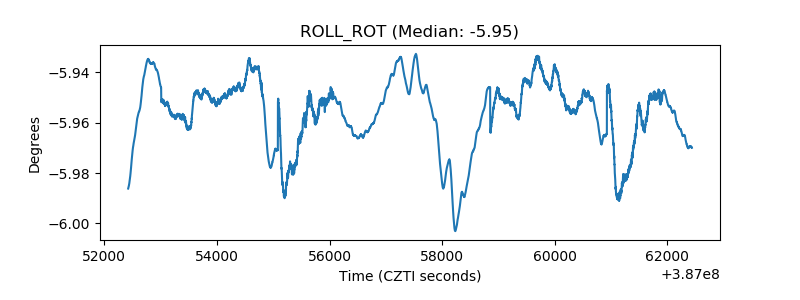 |
| _Roll_DEC | 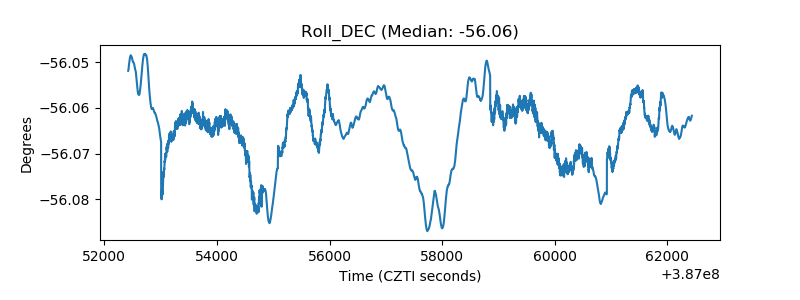 |
| _Roll_RA | 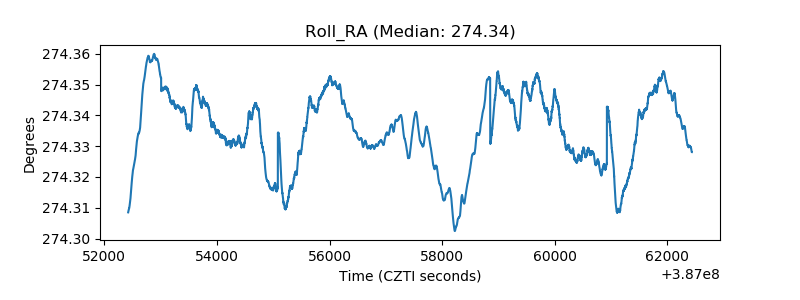 |
| Veto Counter | 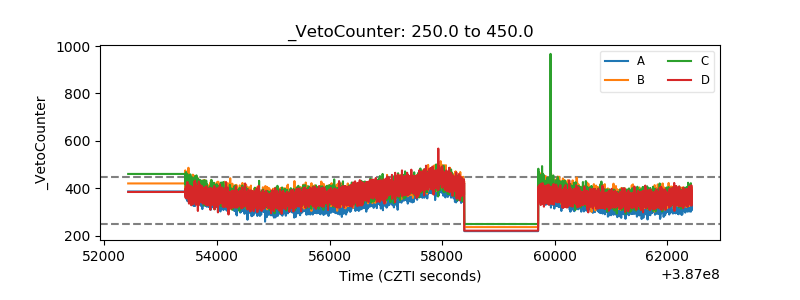 |