| Param | Original file | Final file |
|---|---|---|
| Filename | modeM0/AS1A11_082T01_9000005056_35281cztM0_level2.evt | modeM0/AS1A11_082T01_9000005056_35281cztM0_level2_quad_clean.evt |
| Size (bytes) | 690,949,440 | 75,830,400 |
| Size | 658.9 MB | 72.3 MB |
| Events in quadrant A | 2,706,317 | 511,060 |
| Events in quadrant B | 8,843,901 | 415,025 |
| Events in quadrant C | 4,831,475 | 492,639 |
| Events in quadrant D | 4,151,929 | 471,582 |
| Mode M0 | |||
|---|---|---|---|
| Quadrant | BADHDUFLAG | Total packets | Discarded packets |
| A | 0 | 11824 | 3 |
| B | 0 | 30234 | 2 |
| C | 0 | 18406 | 2 |
| D | 0 | 16040 | 2 |
| Mode SS | |||
|---|---|---|---|
| Quadrant | BADHDUFLAG | Total packets | Discarded packets |
| A | 0 | 118 | 0 |
| B | 0 | 118 | 0 |
| C | 0 | 118 | 0 |
| D | 0 | 118 | 0 |
| Mode M9 | |||
|---|---|---|---|
| Quadrant | BADHDUFLAG | Total packets | Discarded packets |
| A | 0 | 13 | 0 |
| B | 0 | 13 | 0 |
| C | 0 | 13 | 0 |
| D | 0 | 13 | 0 |
| Quadrant | Total seconds | Saturated seconds | Saturation percentage |
|---|---|---|---|
| A | 5791 | 6 | 0.103609% |
| B | 5791 | 2451 | 42.324296% |
| C | 5791 | 241 | 4.161630% |
| D | 5792 | 382 | 6.595304% |
Noise dominated data is calculated using 1-second bins in cleaned event files. If a bin has >2000 counts, and if more than 50% of those come from <1% of pixels, then it is considered to be noise-dominated and hence unusable.
| Quadrant | # 1 sec bins | Bins with >0 counts | Bins with >2000 counts | High rate bins dominated by noise | Noise dominated (total time) | Noise dominated (detector-on time) | Marked lightcurve |
|---|---|---|---|---|---|---|---|
| A | 7134 | 5792 | 0 | 0 | 0.00% | 0.00% | 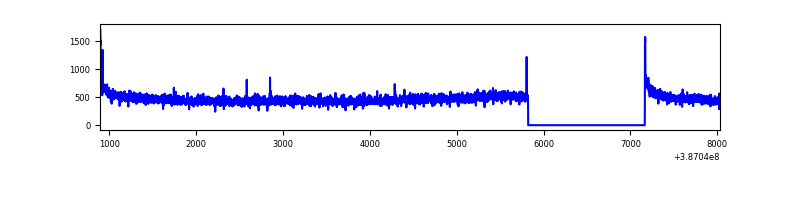 |
| B | 7133 | 5791 | 2013 | 2013 | 28.22% | 34.76% | 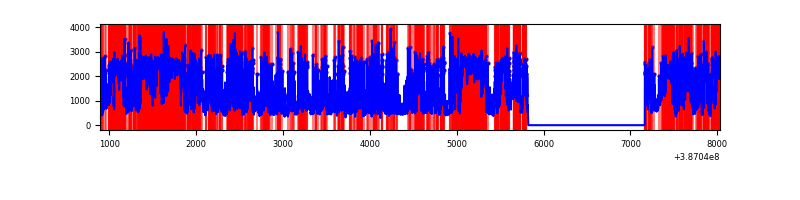 |
| C | 7134 | 5792 | 214 | 214 | 3.00% | 3.69% | 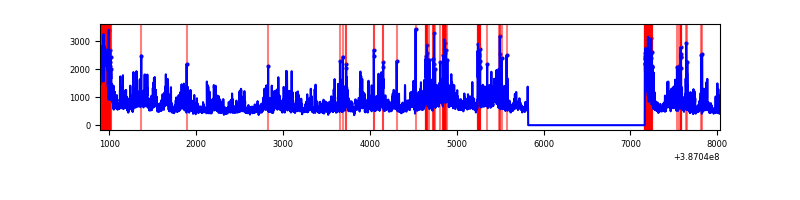 |
| D | 7135 | 5793 | 358 | 358 | 5.02% | 6.18% | 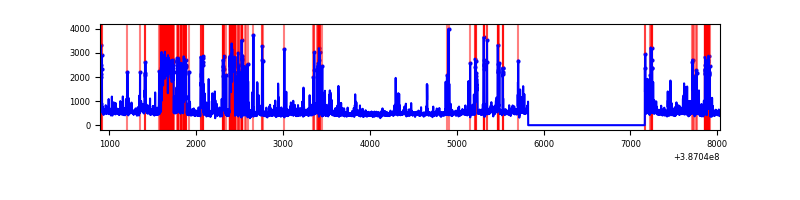 |
Top three noisy pixels from each quadrant. If the there are fewer than three noisy pixels in the level2.evt file, extra rows are filled as -1
| Pixel properties | Quadrant properties | ||||||
|---|---|---|---|---|---|---|---|
| Quadrant | DetID | PixID | Counts | Sigma | Mean | Median | Sigma |
| A | 10 | 83 | 105161 | 775.76 | 666 | 651 | 134.7 |
| A | 13 | 6 | 15797 | 112.43 | 666 | 651 | 134.7 |
| A | 13 | 254 | 9526 | 65.88 | 666 | 651 | 134.7 |
| B | 5 | 172 | 3528326 | 34768.22 | 529 | 517 | 101.5 |
| B | 5 | 236 | 3191259 | 31446.27 | 529 | 517 | 101.5 |
| B | 4 | 232 | 15678 | 149.42 | 529 | 517 | 101.5 |
| C | 4 | 254 | 1515883 | 10263.66 | 635 | 638 | 147.6 |
| C | 0 | 10 | 571572 | 3867.28 | 635 | 638 | 147.6 |
| C | 15 | 214 | 234627 | 1584.95 | 635 | 638 | 147.6 |
| D | 12 | 227 | 456762 | 2962.82 | 634 | 616 | 154.0 |
| D | 2 | 250 | 302582 | 1961.37 | 634 | 616 | 154.0 |
| D | 7 | 80 | 212569 | 1376.71 | 634 | 616 | 154.0 |
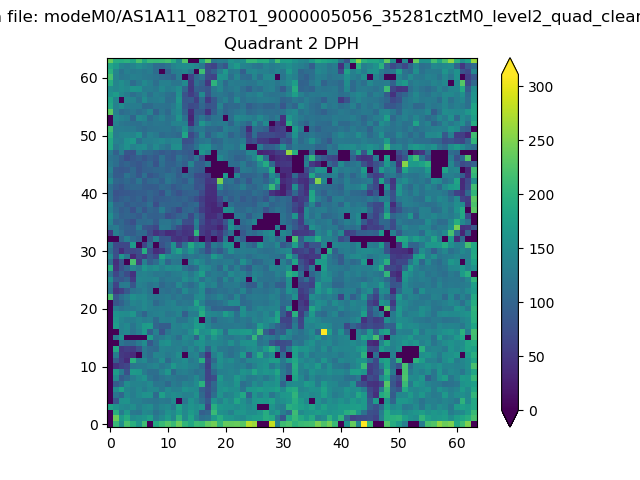
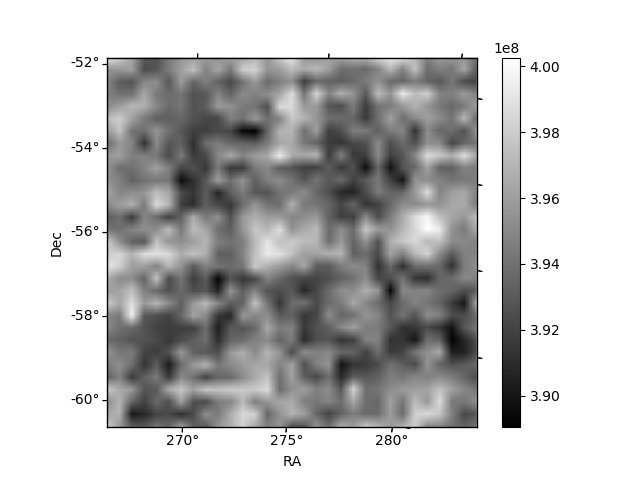
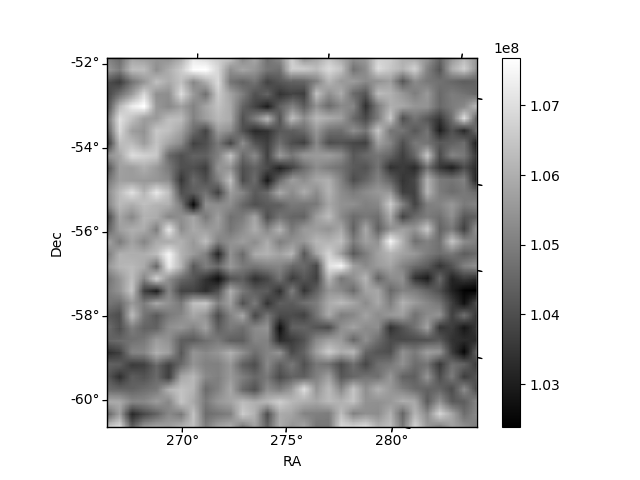
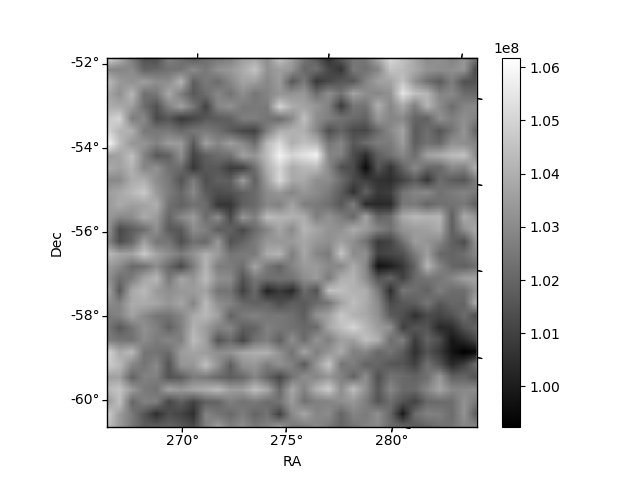
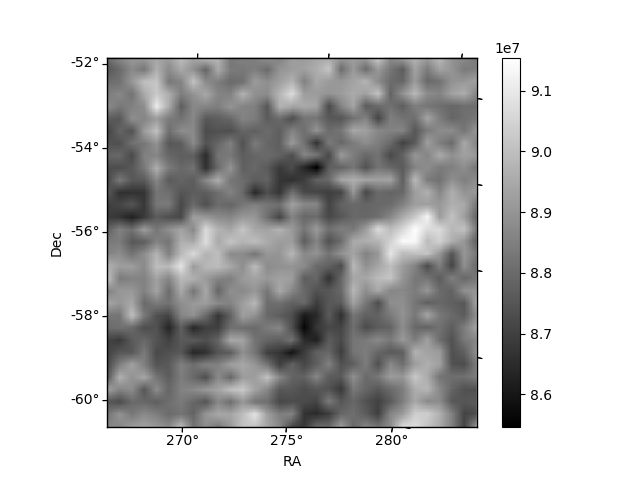
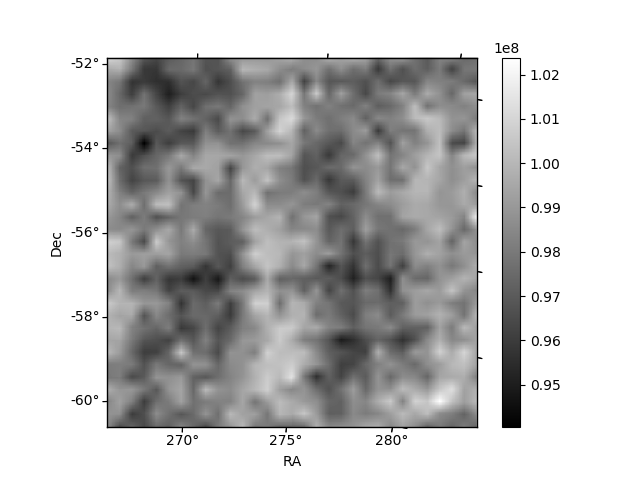
Histogram calculated using DETX and DETY for each event in the final _common_clean file
| Quadrant A | 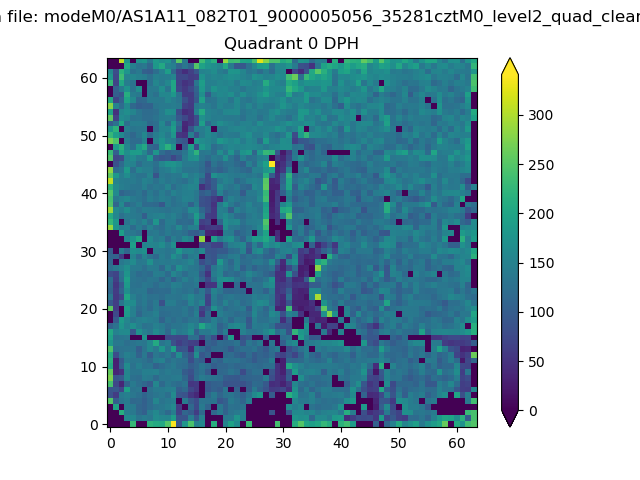 |
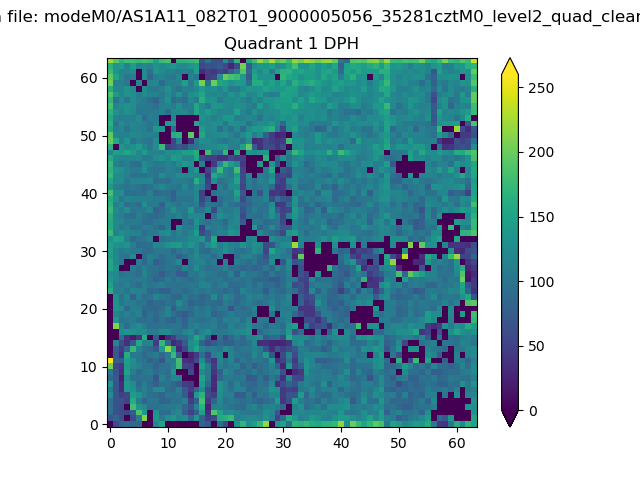 |
Quadrant B |
|---|---|---|---|
| Quadrant D | 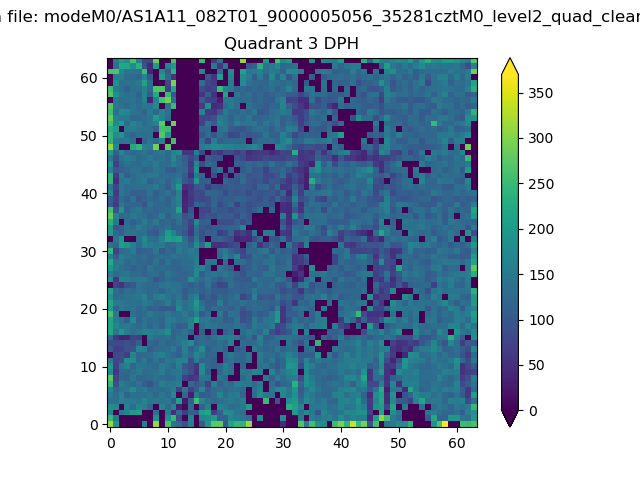 |
 |
Quadrant C |
| Plot type | Count rate plots | Images |
|---|---|---|
| Comparison with Poisson distribution Blue bars denote a histogram of data divided into 1 sec bins. Red curve is a Poisson curve with rate = median count rate of data. |
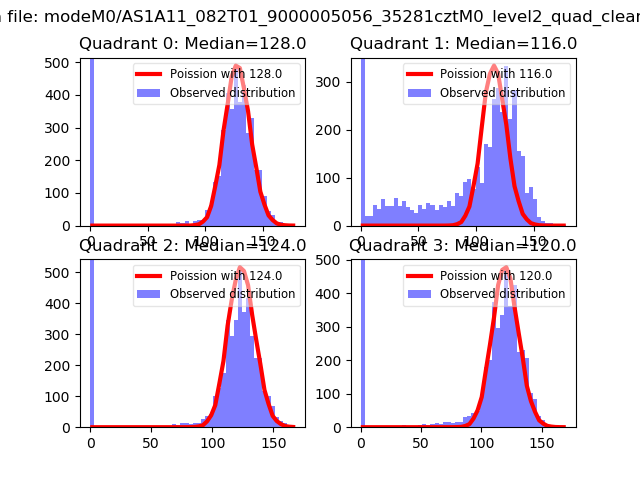 |
 |
| Quadrant-wise count rates Data is divided into 100 sec bins |
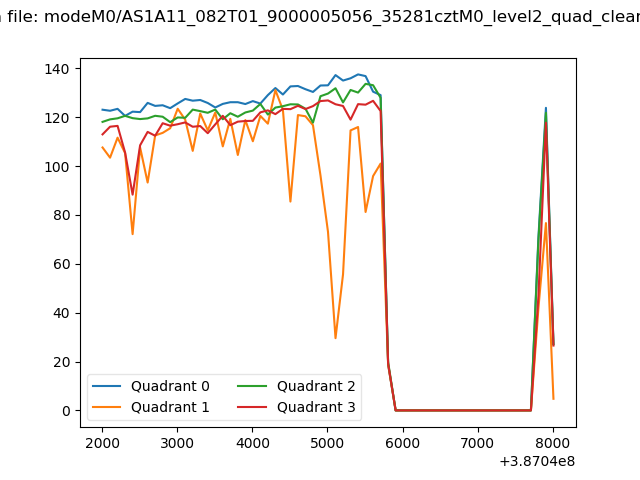 |
|
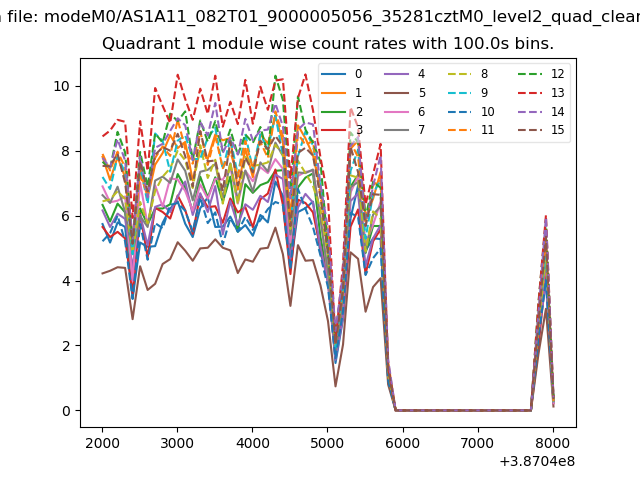
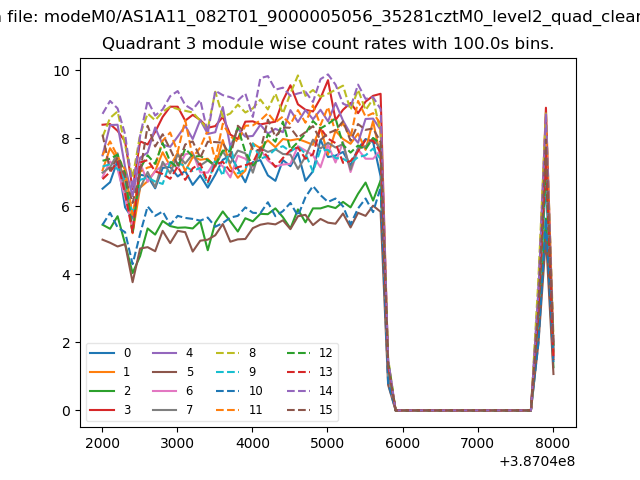
| Module-wise count rates for Quadrant A Data is divided into 100 sec bins |
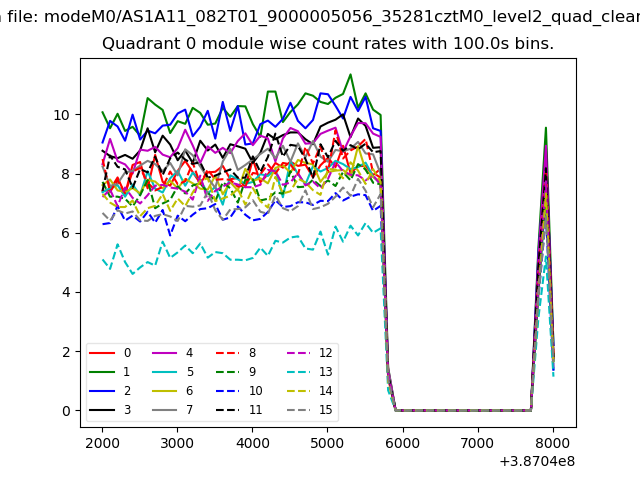 |
 |
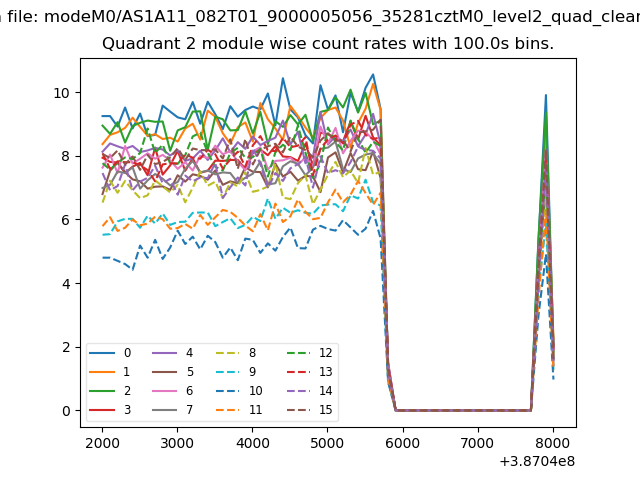
| Module-wise count rates for Quadrant B Data is divided into 100 sec bins |
 |
 |
| Module-wise count rates for Quadrant C Data is divided into 100 sec bins |
 |
 |
| Module-wise count rates for Quadrant D Data is divided into 100 sec bins |
 |
 |
| Parameter | Plot |
|---|---|
| CZT HV Monitor | 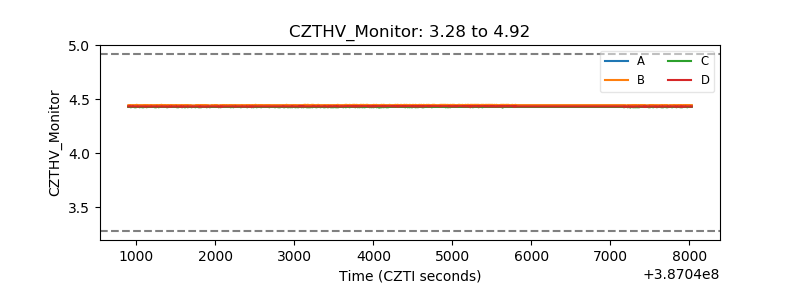 |
| D_VDD | 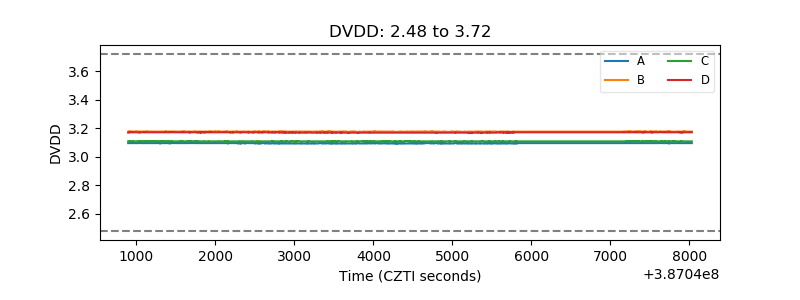 |
| Temperature 1 | 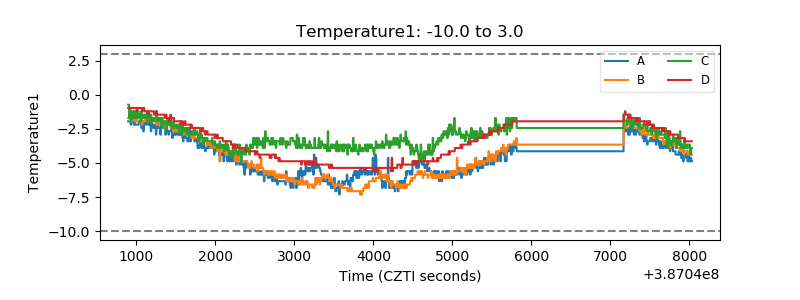 |
| Veto HV Monitor | 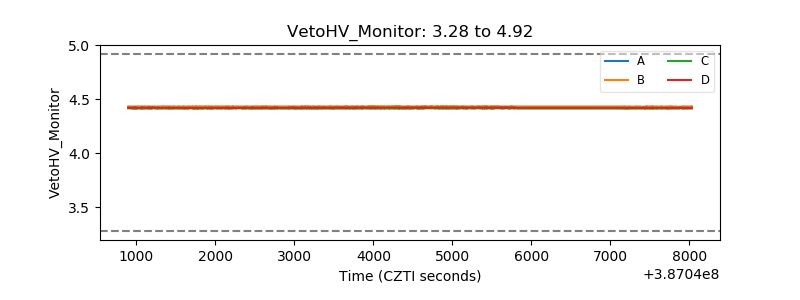 |
| Veto LLD | 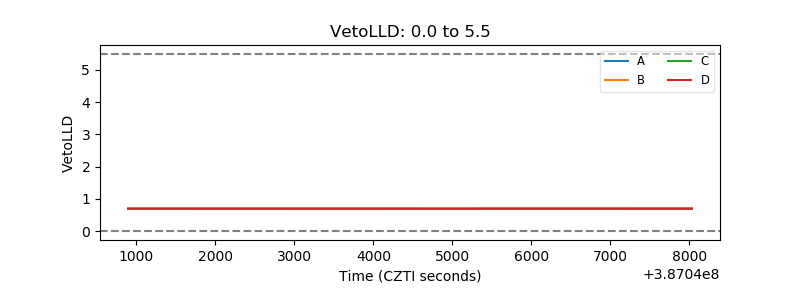 |
| Alpha Counter | 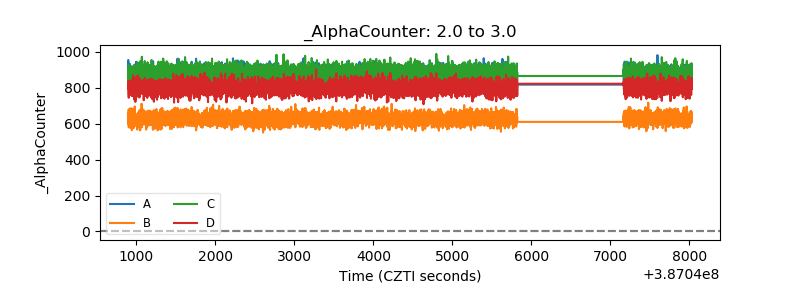 |
| _CPM_Rate | 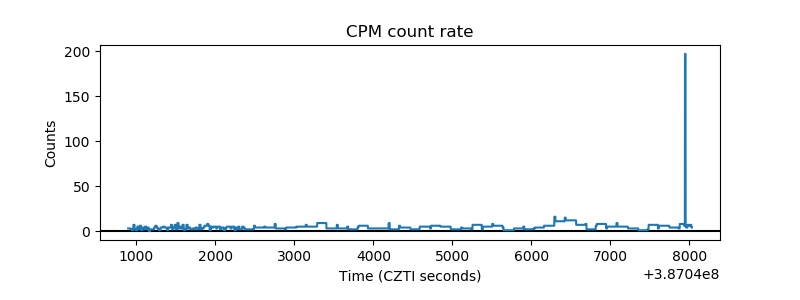 |
| CZT Counter | 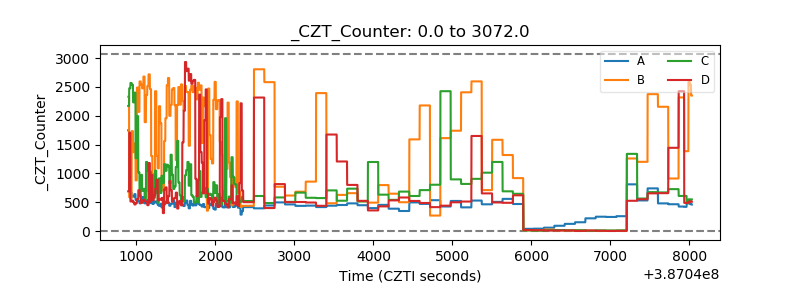 |
| +2.5 Volts monitor | 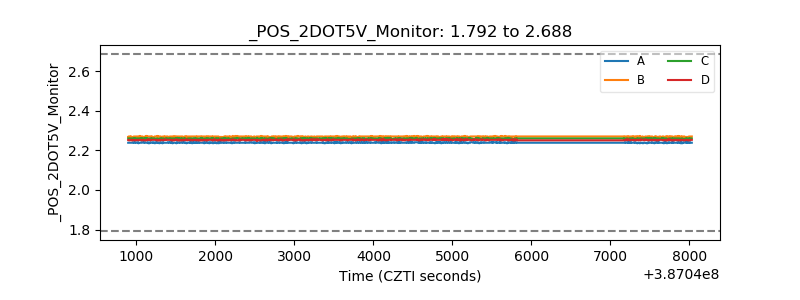 |
| +5 Volts monitor | 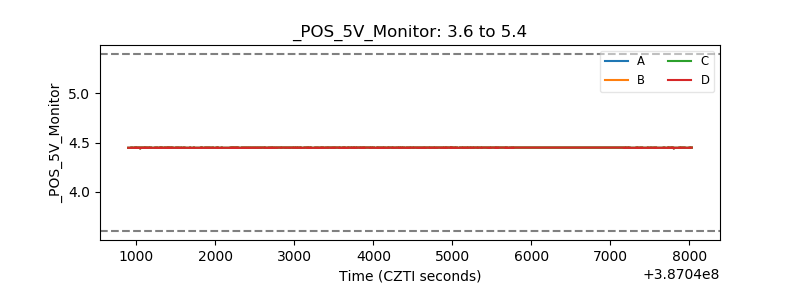 |
| _ROLL_ROT | 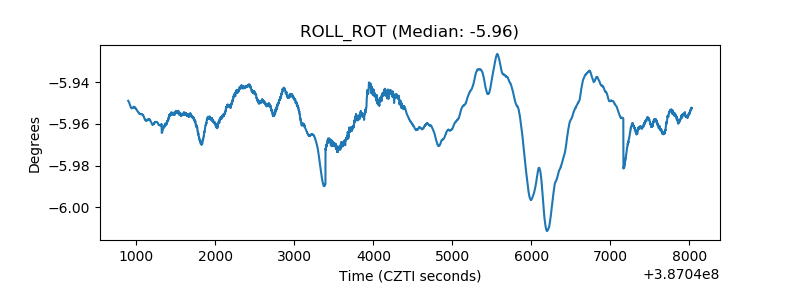 |
| _Roll_DEC | 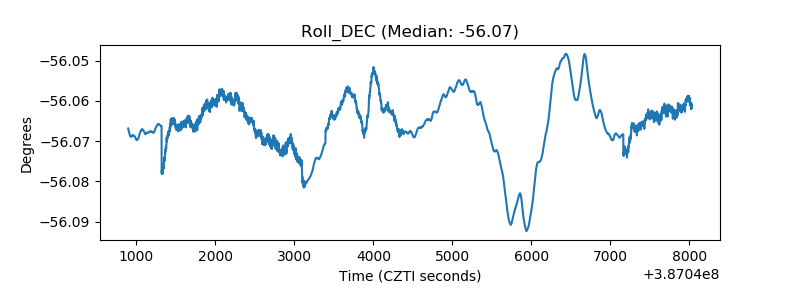 |
| _Roll_RA | 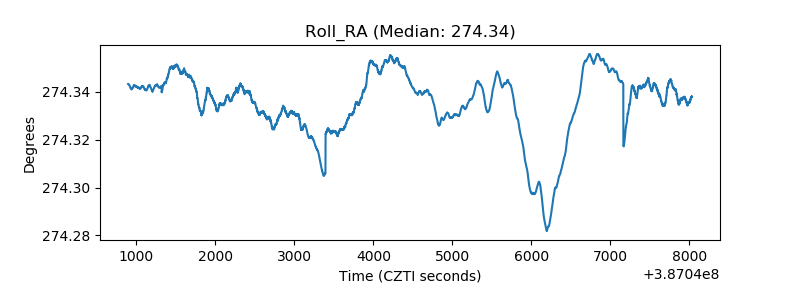 |
| Veto Counter | 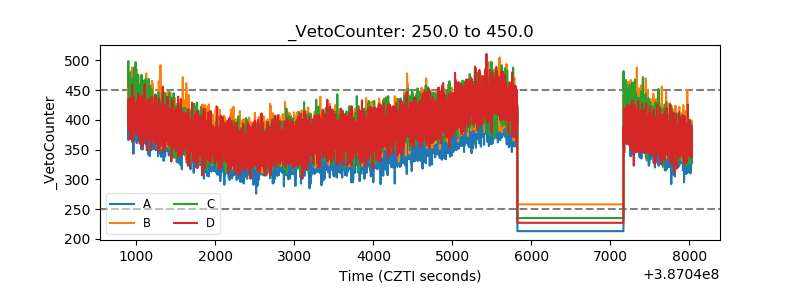 |