| Param | Original file | Final file |
|---|---|---|
| Filename | modeM0/AS1A11_082T01_9000005056_35280cztM0_level2.evt | modeM0/AS1A11_082T01_9000005056_35280cztM0_level2_quad_clean.evt |
| Size (bytes) | 708,716,160 | 64,010,880 |
| Size | 675.9 MB | 61.0 MB |
| Events in quadrant A | 2,685,858 | 410,519 |
| Events in quadrant B | 8,165,610 | 375,322 |
| Events in quadrant C | 6,037,082 | 372,043 |
| Events in quadrant D | 4,191,781 | 382,916 |
| Mode M0 | |||
|---|---|---|---|
| Quadrant | BADHDUFLAG | Total packets | Discarded packets |
| A | 0 | 11651 | 3 |
| B | 0 | 28191 | 2 |
| C | 0 | 21936 | 2 |
| D | 0 | 16021 | 2 |
| Mode SS | |||
|---|---|---|---|
| Quadrant | BADHDUFLAG | Total packets | Discarded packets |
| A | 0 | 114 | 0 |
| B | 0 | 114 | 0 |
| C | 0 | 114 | 0 |
| D | 0 | 114 | 0 |
| Mode M9 | |||
|---|---|---|---|
| Quadrant | BADHDUFLAG | Total packets | Discarded packets |
| A | 0 | 20 | 0 |
| B | 0 | 20 | 0 |
| C | 0 | 20 | 0 |
| D | 0 | 21 | 0 |
| Quadrant | Total seconds | Saturated seconds | Saturation percentage |
|---|---|---|---|
| A | 5680 | 10 | 0.176056% |
| B | 5680 | 2027 | 35.686620% |
| C | 5680 | 670 | 11.795775% |
| D | 5680 | 464 | 8.169014% |
Noise dominated data is calculated using 1-second bins in cleaned event files. If a bin has >2000 counts, and if more than 50% of those come from <1% of pixels, then it is considered to be noise-dominated and hence unusable.
| Quadrant | # 1 sec bins | Bins with >0 counts | Bins with >2000 counts | High rate bins dominated by noise | Noise dominated (total time) | Noise dominated (detector-on time) | Marked lightcurve |
|---|---|---|---|---|---|---|---|
| A | 7263 | 5681 | 2 | 2 | 0.03% | 0.04% | 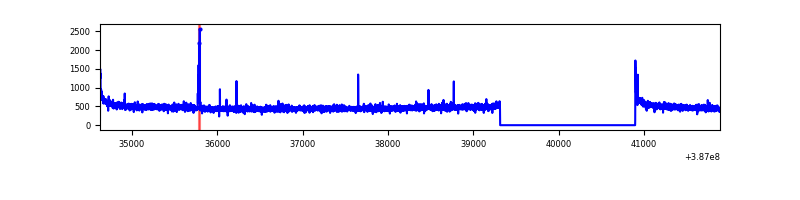 |
| B | 7263 | 5681 | 1651 | 1651 | 22.73% | 29.06% | 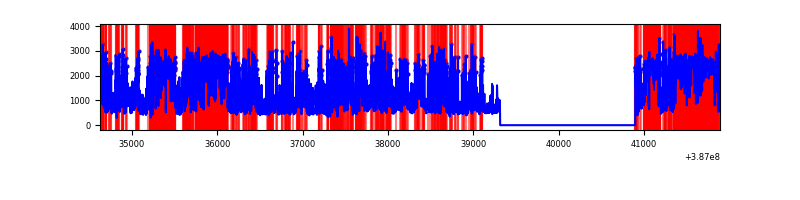 |
| C | 7263 | 5681 | 610 | 610 | 8.40% | 10.74% | 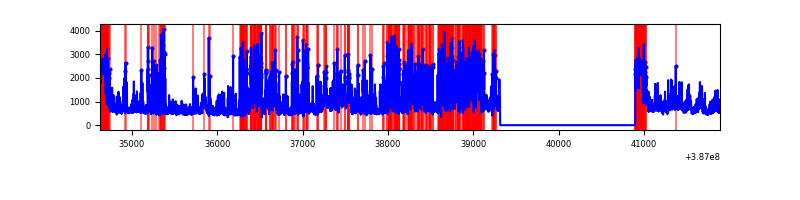 |
| D | 7263 | 5681 | 448 | 448 | 6.17% | 7.89% | 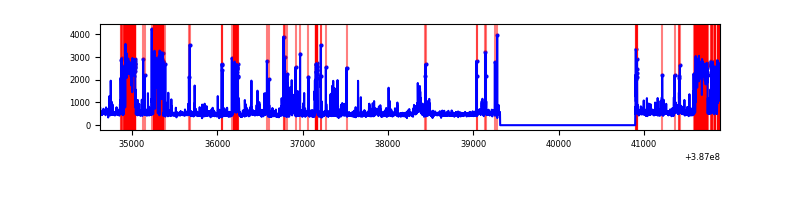 |
Top three noisy pixels from each quadrant. If the there are fewer than three noisy pixels in the level2.evt file, extra rows are filled as -1
| Pixel properties | Quadrant properties | ||||||
|---|---|---|---|---|---|---|---|
| Quadrant | DetID | PixID | Counts | Sigma | Mean | Median | Sigma |
| A | 10 | 83 | 104093 | 772.13 | 658 | 644 | 134.0 |
| A | 7 | 191 | 20892 | 151.13 | 658 | 644 | 134.0 |
| A | 13 | 6 | 10911 | 76.63 | 658 | 644 | 134.0 |
| B | 5 | 236 | 3347598 | 31747.98 | 553 | 539 | 105.4 |
| B | 5 | 172 | 2583015 | 24495.66 | 553 | 539 | 105.4 |
| B | 0 | 189 | 25356 | 235.4 | 553 | 539 | 105.4 |
| C | 0 | 10 | 1721136 | 12195.59 | 607 | 611 | 141.1 |
| C | 4 | 254 | 1631494 | 11560.18 | 607 | 611 | 141.1 |
| C | 15 | 214 | 226634 | 1602.12 | 607 | 611 | 141.1 |
| D | 14 | 52 | 505547 | 3348.48 | 618 | 600 | 150.8 |
| D | 12 | 227 | 263076 | 1740.57 | 618 | 600 | 150.8 |
| D | 2 | 250 | 240355 | 1589.9 | 618 | 600 | 150.8 |
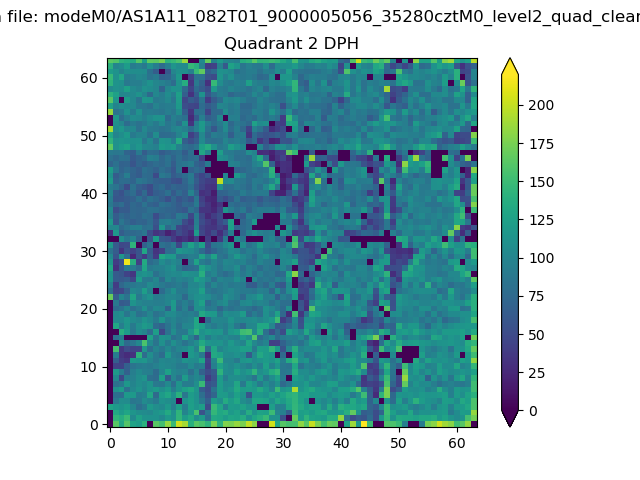
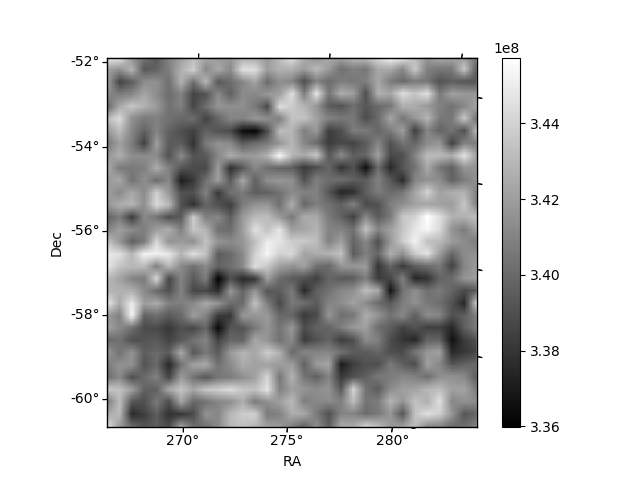
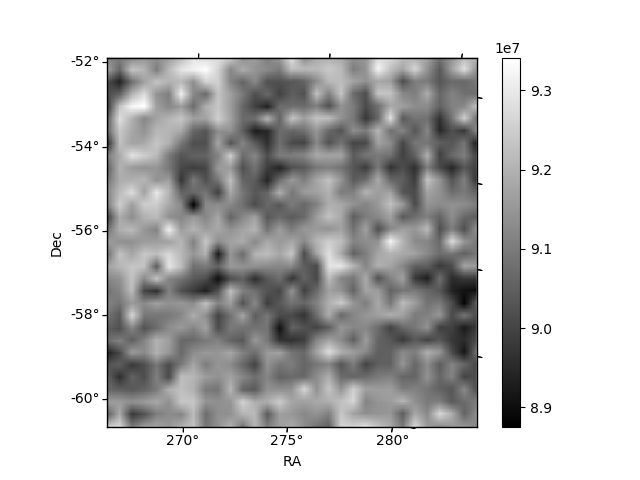
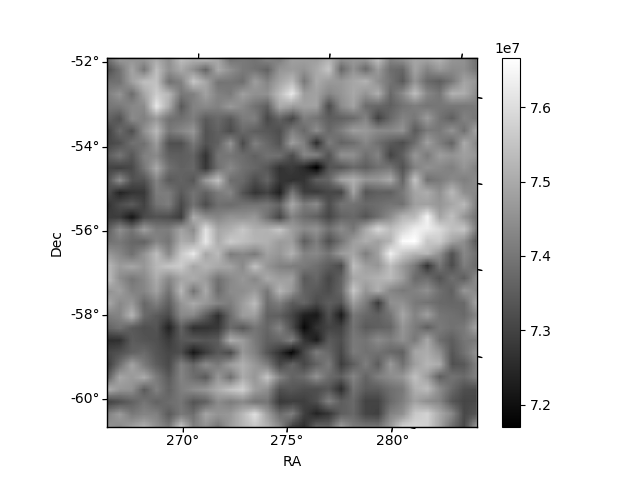
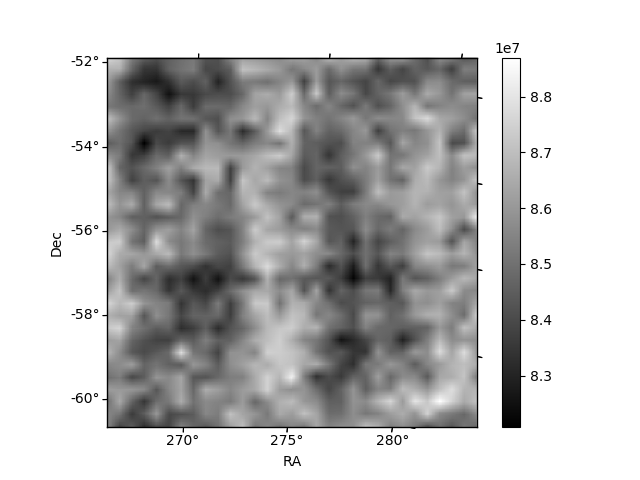
Histogram calculated using DETX and DETY for each event in the final _common_clean file
| Quadrant A | 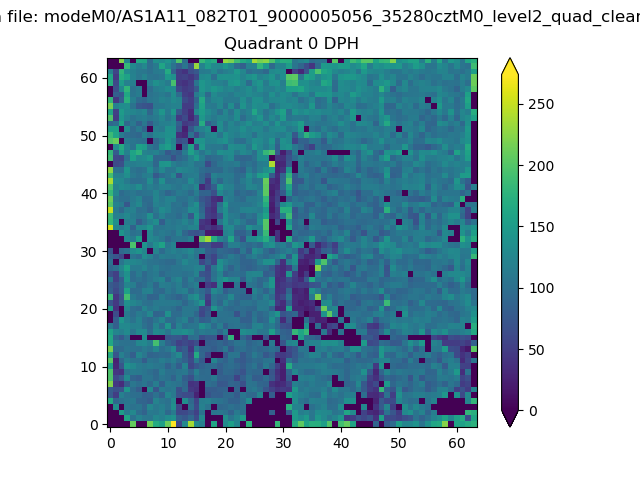 |
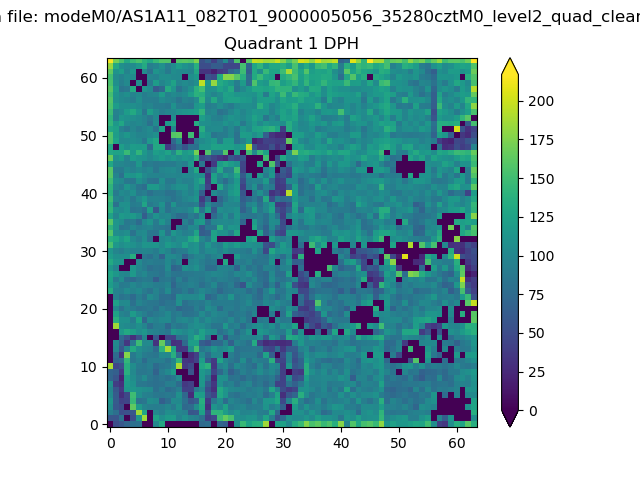 |
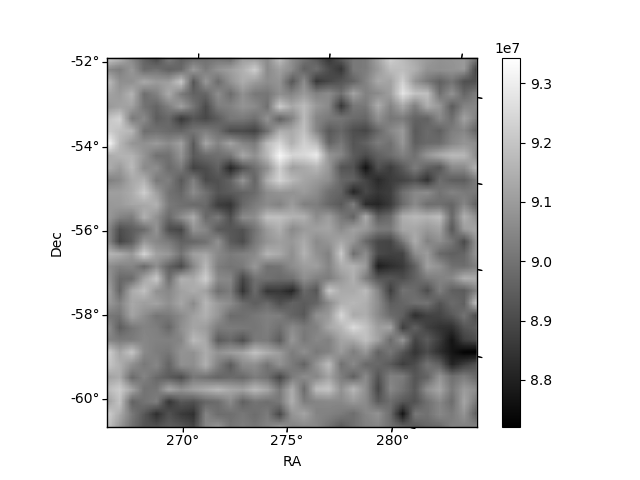
Quadrant B |
|---|---|---|---|
| Quadrant D | 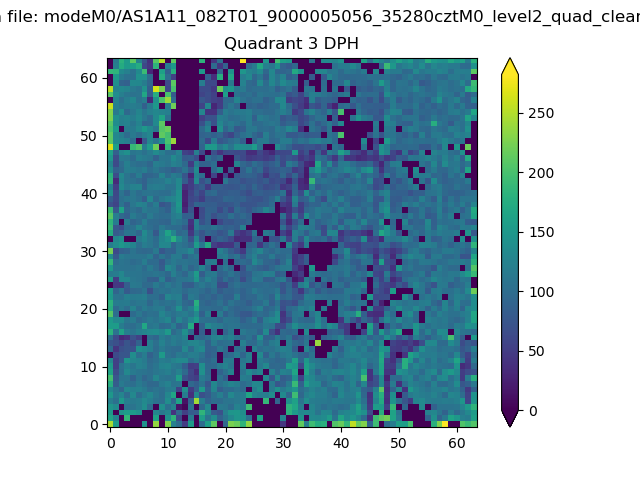 |
 |
Quadrant C |
| Plot type | Count rate plots | Images |
|---|---|---|
| Comparison with Poisson distribution Blue bars denote a histogram of data divided into 1 sec bins. Red curve is a Poisson curve with rate = median count rate of data. |
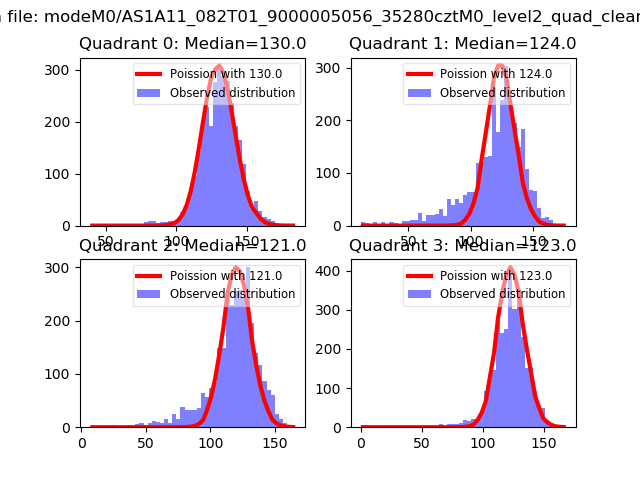 |
 |
| Quadrant-wise count rates Data is divided into 100 sec bins |
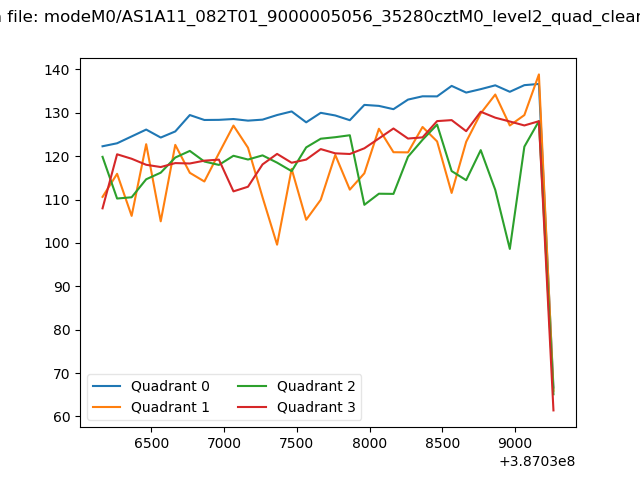 |
|
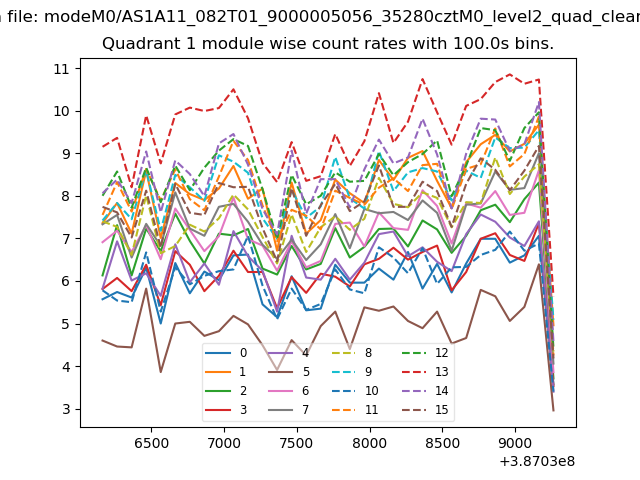
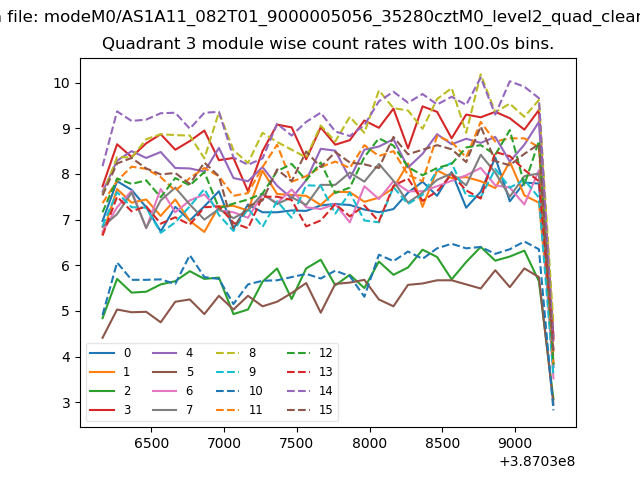
| Module-wise count rates for Quadrant A Data is divided into 100 sec bins |
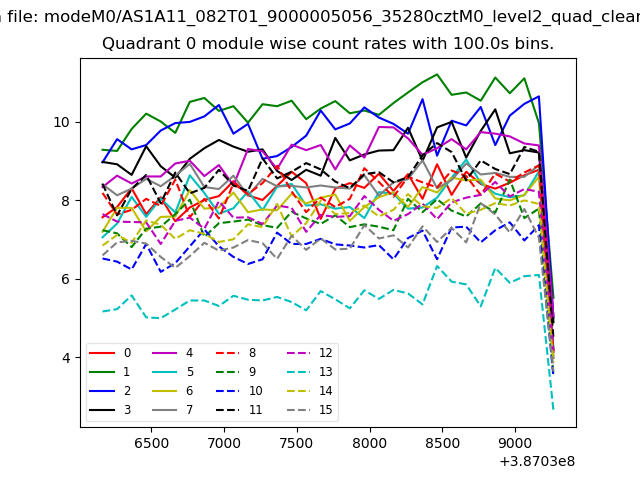 |
 |
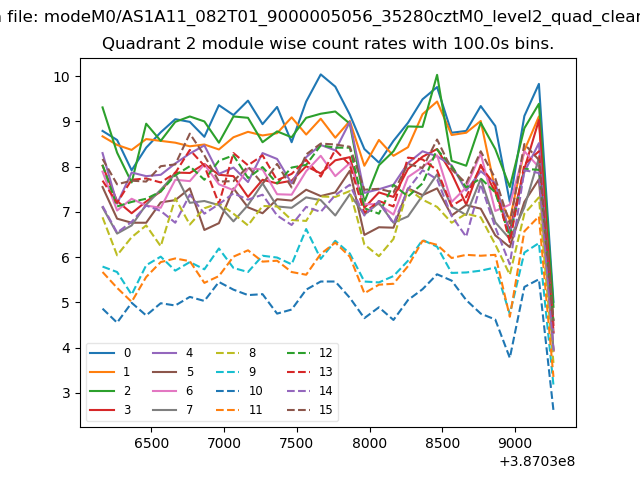
| Module-wise count rates for Quadrant B Data is divided into 100 sec bins |
 |
 |
| Module-wise count rates for Quadrant C Data is divided into 100 sec bins |
 |
 |
| Module-wise count rates for Quadrant D Data is divided into 100 sec bins |
 |
 |
| Parameter | Plot |
|---|---|
| CZT HV Monitor | 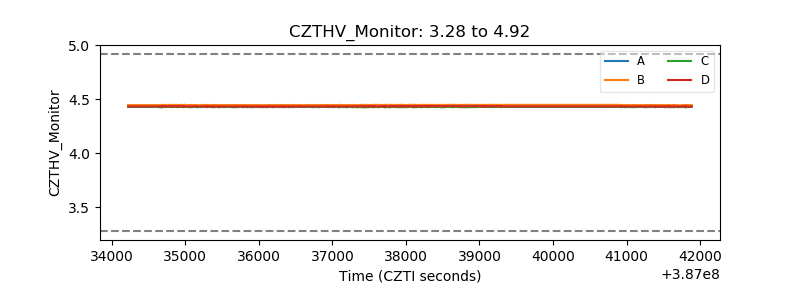 |
| D_VDD | 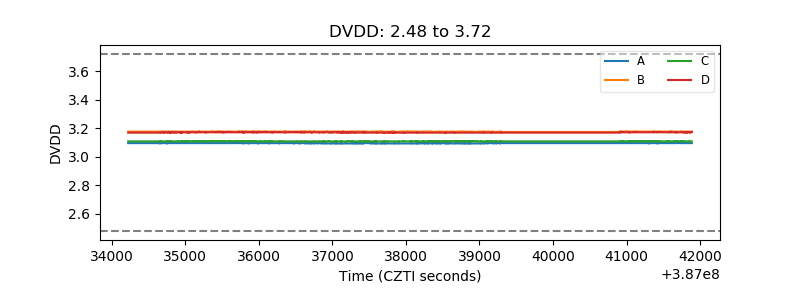 |
| Temperature 1 | 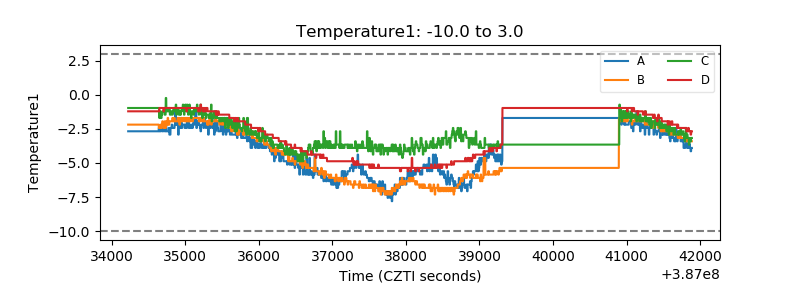 |
| Veto HV Monitor | 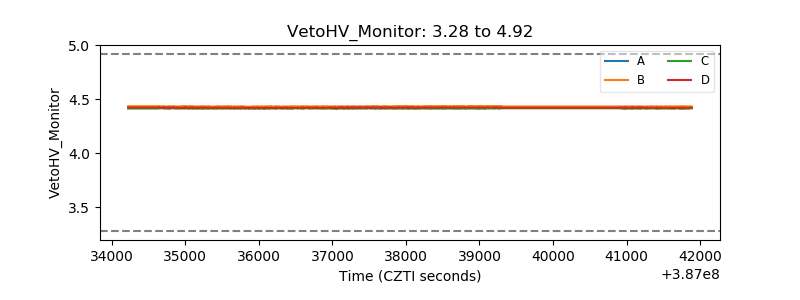 |
| Veto LLD | 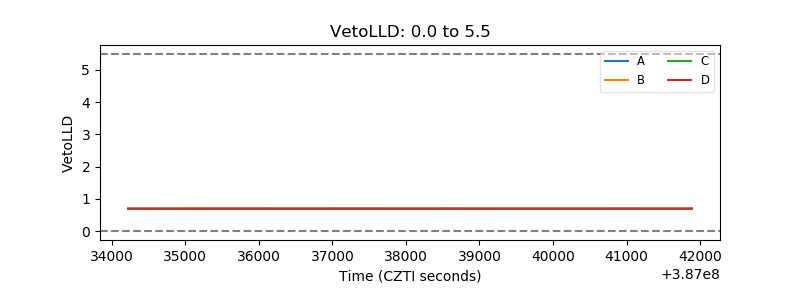 |
| Alpha Counter | 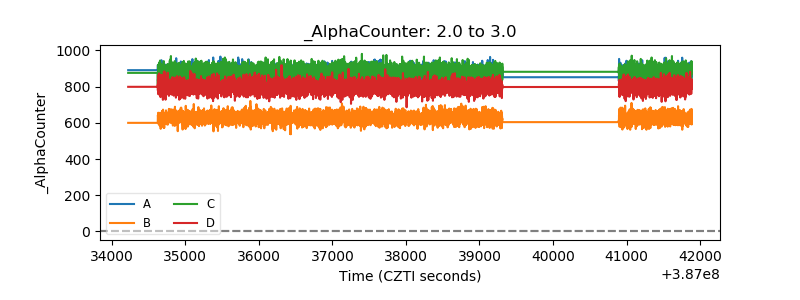 |
| _CPM_Rate | 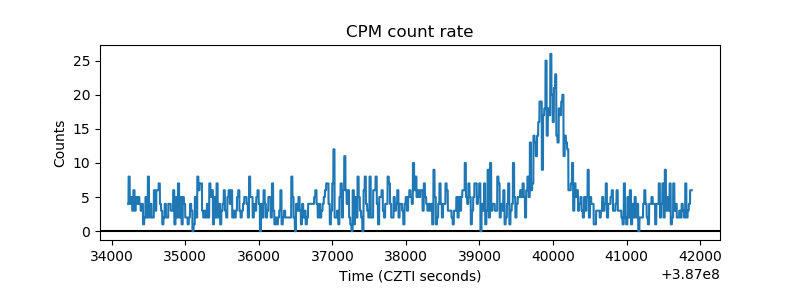 |
| CZT Counter | 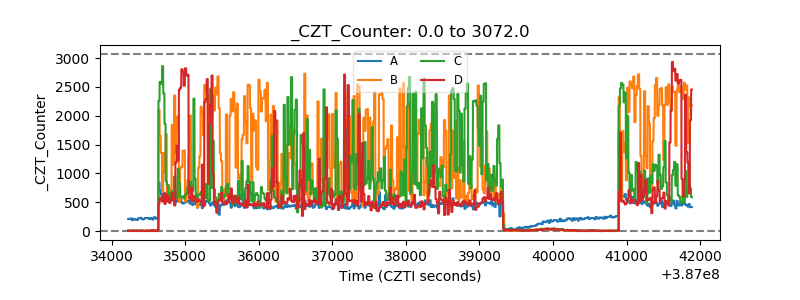 |
| +2.5 Volts monitor | 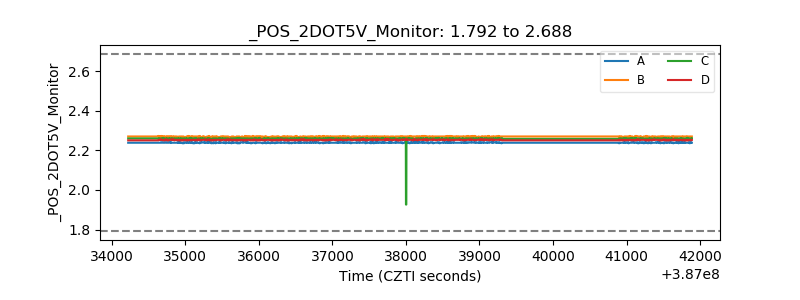 |
| +5 Volts monitor | 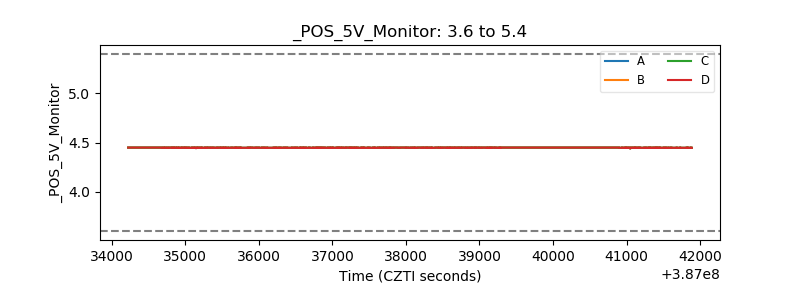 |
| _ROLL_ROT | 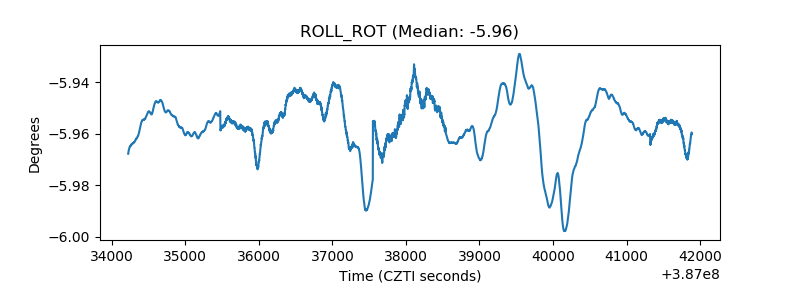 |
| _Roll_DEC | 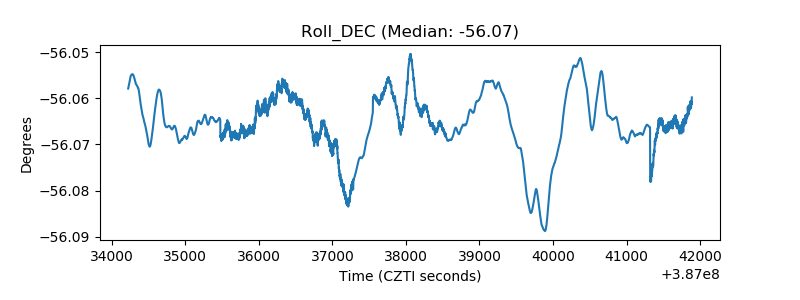 |
| _Roll_RA | 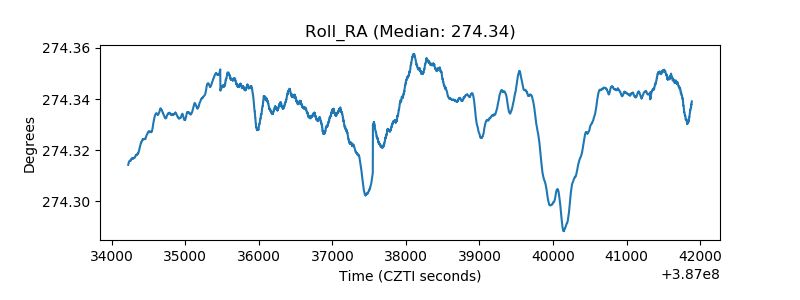 |
| Veto Counter | 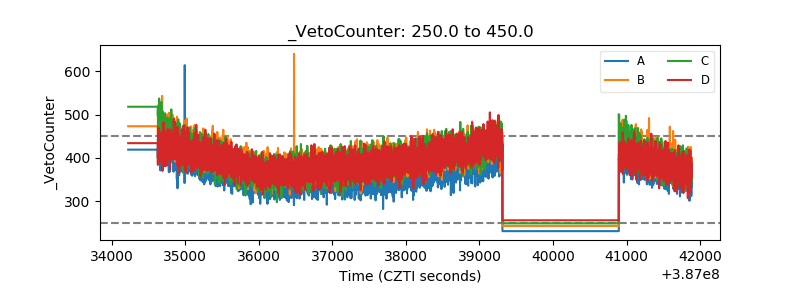 |