| Param | Original file | Final file |
|---|---|---|
| Filename | modeM0/AS1A11_082T01_9000005056_35277cztM0_level2.evt | modeM0/AS1A11_082T01_9000005056_35277cztM0_level2_quad_clean.evt |
| Size (bytes) | 517,443,840 | 64,393,920 |
| Size | 493.5 MB | 61.4 MB |
| Events in quadrant A | 2,495,963 | 421,410 |
| Events in quadrant B | 4,838,422 | 409,764 |
| Events in quadrant C | 3,177,757 | 399,221 |
| Events in quadrant D | 4,832,522 | 381,281 |
| Mode M0 | |||
|---|---|---|---|
| Quadrant | BADHDUFLAG | Total packets | Discarded packets |
| A | 0 | 10134 | 3 |
| B | 0 | 17611 | 2 |
| C | 0 | 12420 | 2 |
| D | 0 | 17512 | 2 |
| Mode SS | |||
|---|---|---|---|
| Quadrant | BADHDUFLAG | Total packets | Discarded packets |
| A | 0 | 100 | 0 |
| B | 0 | 100 | 0 |
| C | 0 | 100 | 0 |
| D | 0 | 100 | 0 |
| Mode M9 | |||
|---|---|---|---|
| Quadrant | BADHDUFLAG | Total packets | Discarded packets |
| A | 0 | 25 | 0 |
| B | 0 | 25 | 0 |
| C | 0 | 25 | 0 |
| D | 0 | 26 | 0 |
| Quadrant | Total seconds | Saturated seconds | Saturation percentage |
|---|---|---|---|
| A | 4806 | 4 | 0.083229% |
| B | 4806 | 812 | 16.895547% |
| C | 4806 | 166 | 3.454016% |
| D | 4806 | 759 | 15.792759% |
Noise dominated data is calculated using 1-second bins in cleaned event files. If a bin has >2000 counts, and if more than 50% of those come from <1% of pixels, then it is considered to be noise-dominated and hence unusable.
| Quadrant | # 1 sec bins | Bins with >0 counts | Bins with >2000 counts | High rate bins dominated by noise | Noise dominated (total time) | Noise dominated (detector-on time) | Marked lightcurve |
|---|---|---|---|---|---|---|---|
| A | 6959 | 4807 | 0 | 0 | 0.00% | 0.00% | 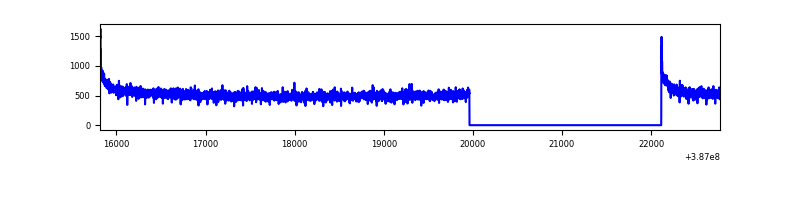 |
| B | 6959 | 4807 | 549 | 549 | 7.89% | 11.42% | 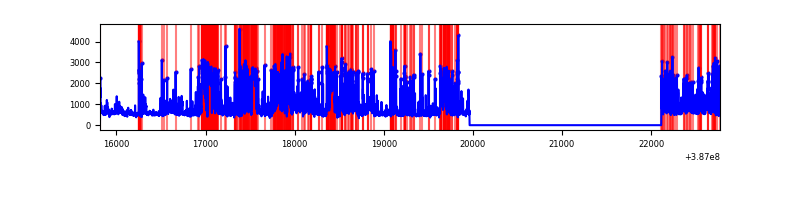 |
| C | 6959 | 4807 | 137 | 137 | 1.97% | 2.85% | 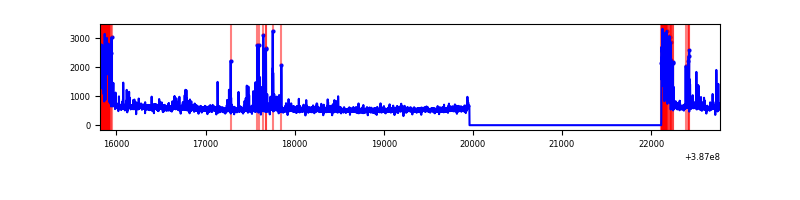 |
| D | 6959 | 4807 | 725 | 725 | 10.42% | 15.08% | 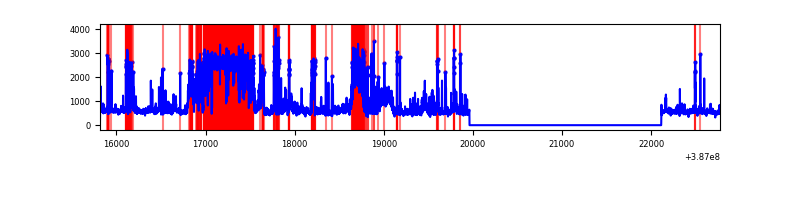 |
Top three noisy pixels from each quadrant. If the there are fewer than three noisy pixels in the level2.evt file, extra rows are filled as -1
| Pixel properties | Quadrant properties | ||||||
|---|---|---|---|---|---|---|---|
| Quadrant | DetID | PixID | Counts | Sigma | Mean | Median | Sigma |
| A | 10 | 83 | 92855 | 753.04 | 616 | 605 | 122.5 |
| A | 13 | 6 | 14140 | 110.49 | 616 | 605 | 122.5 |
| A | 13 | 254 | 8770 | 66.65 | 616 | 605 | 122.5 |
| B | 5 | 236 | 1565901 | 14875.77 | 560 | 547 | 105.2 |
| B | 5 | 172 | 1001533 | 9512.51 | 560 | 547 | 105.2 |
| B | 4 | 232 | 29459 | 274.75 | 560 | 547 | 105.2 |
| C | 0 | 10 | 565596 | 4240.71 | 586 | 593 | 133.2 |
| C | 15 | 214 | 202011 | 1511.77 | 586 | 593 | 133.2 |
| C | 4 | 254 | 64655 | 480.83 | 586 | 593 | 133.2 |
| D | 8 | 230 | 1274129 | 9345.66 | 563 | 548 | 136.3 |
| D | 12 | 227 | 513775 | 3766.11 | 563 | 548 | 136.3 |
| D | 10 | 118 | 226687 | 1659.43 | 563 | 548 | 136.3 |
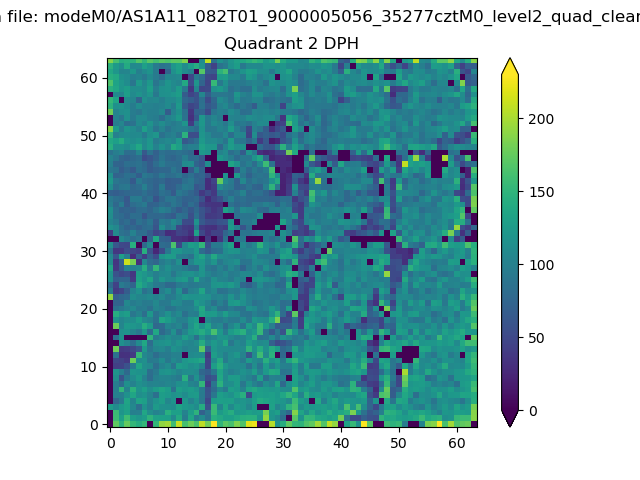
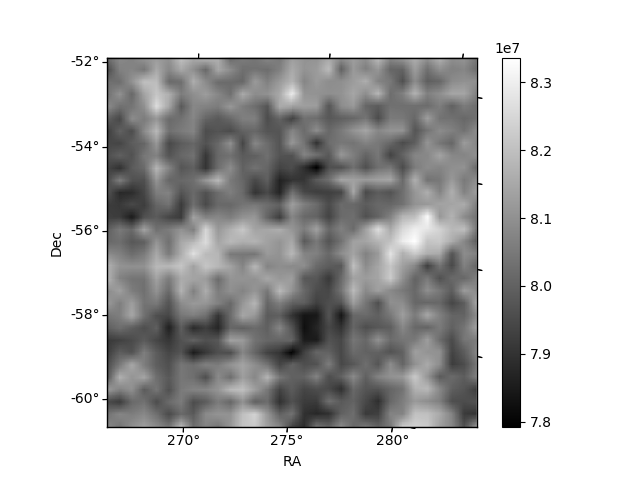
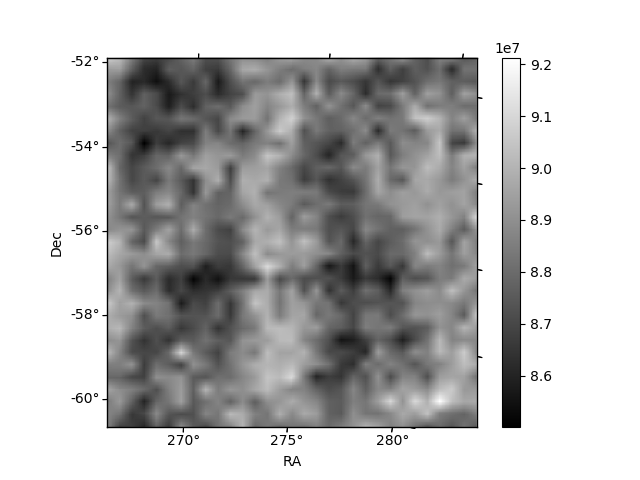
Histogram calculated using DETX and DETY for each event in the final _common_clean file
| Quadrant A | 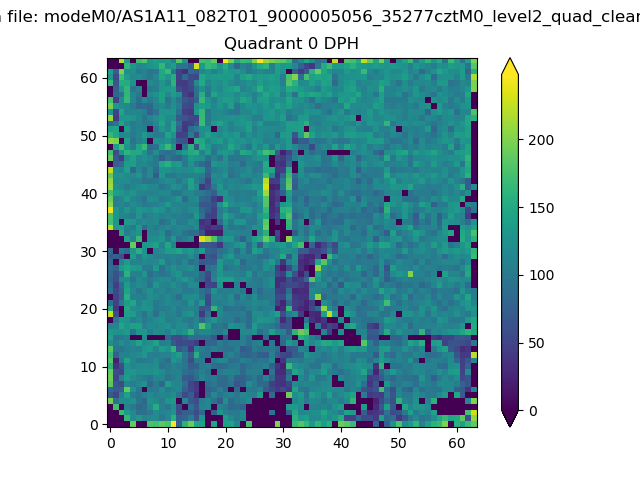 |
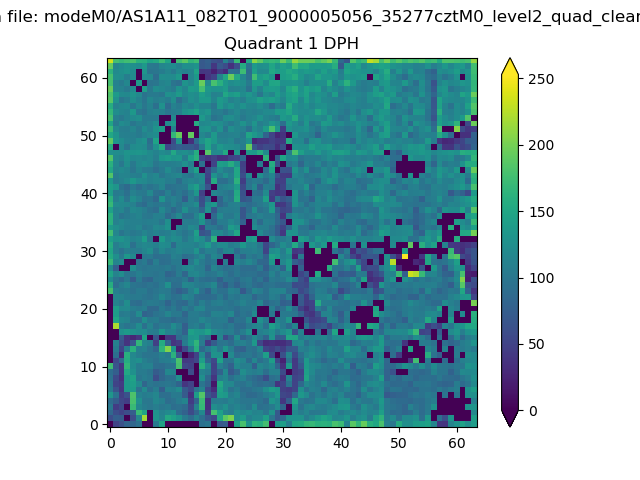 |
Quadrant B |
|---|---|---|---|
| Quadrant D | 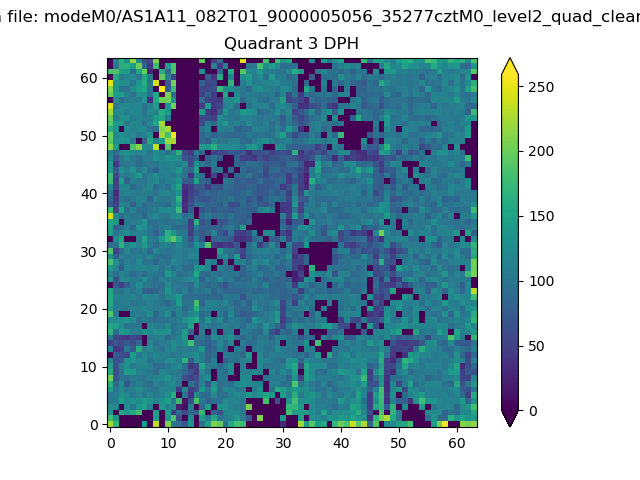 |
 |
Quadrant C |
| Plot type | Count rate plots | Images |
|---|---|---|
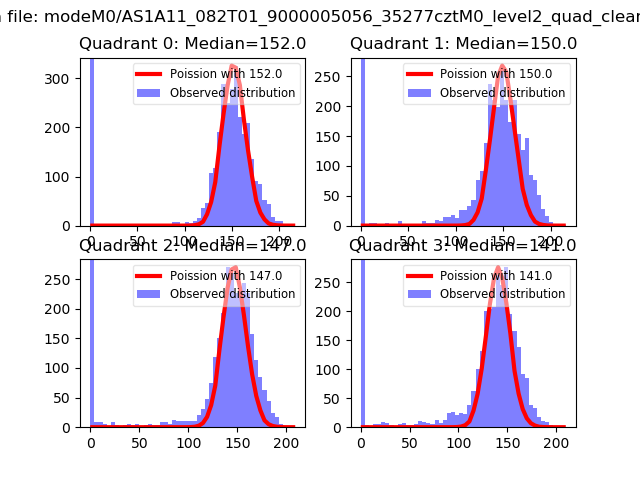
| Comparison with Poisson distribution Blue bars denote a histogram of data divided into 1 sec bins. Red curve is a Poisson curve with rate = median count rate of data. |
 |
 |
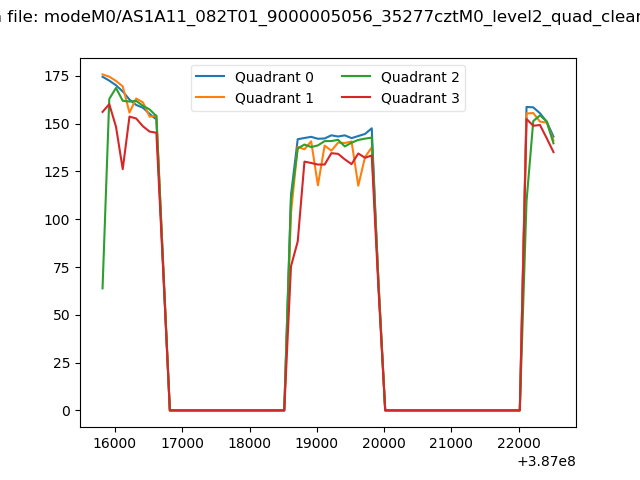
| Quadrant-wise count rates Data is divided into 100 sec bins |
 |
|
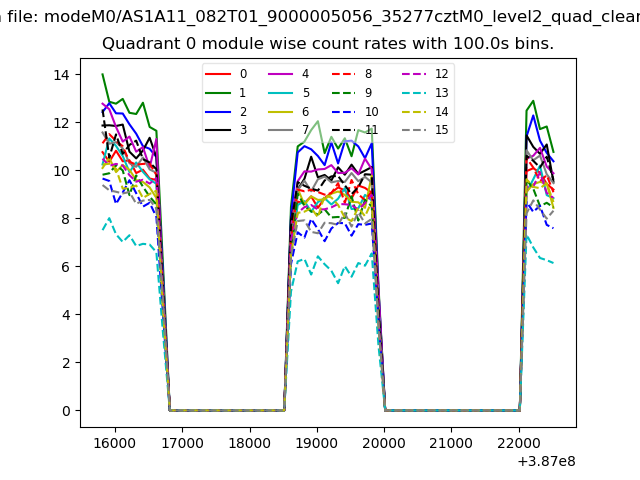
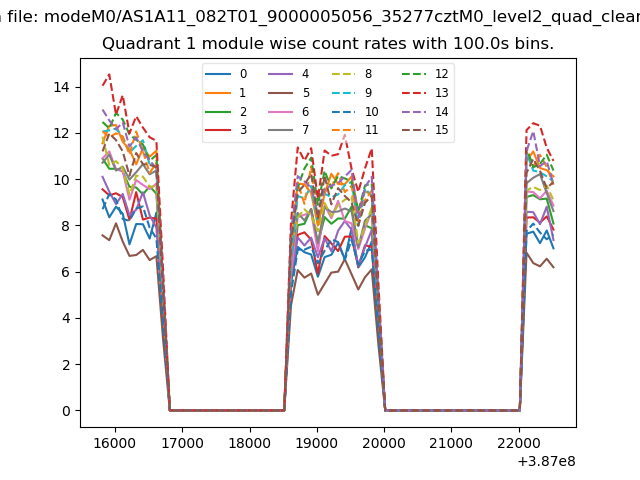
| Module-wise count rates for Quadrant A Data is divided into 100 sec bins |
 |
 |
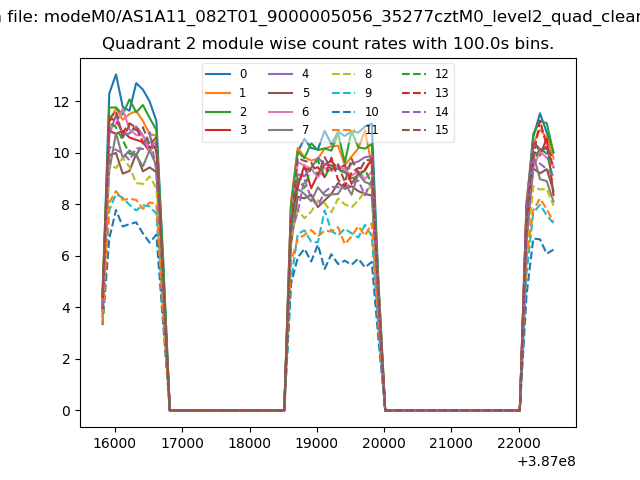
| Module-wise count rates for Quadrant B Data is divided into 100 sec bins |
 |
 |
| Module-wise count rates for Quadrant C Data is divided into 100 sec bins |
 |
 |
| Module-wise count rates for Quadrant D Data is divided into 100 sec bins |
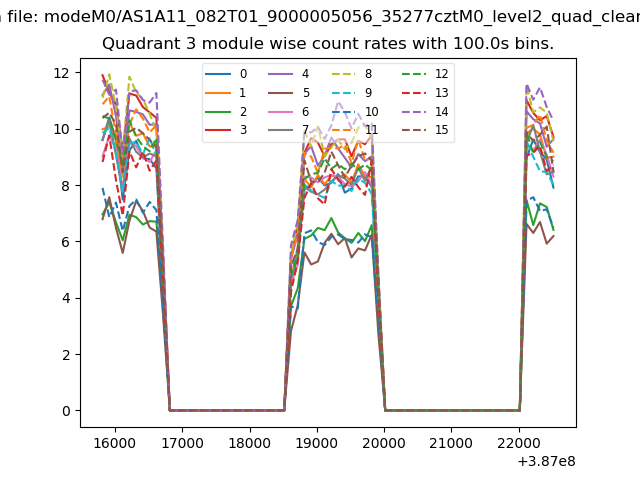 |
 |
| Parameter | Plot |
|---|---|
| CZT HV Monitor | 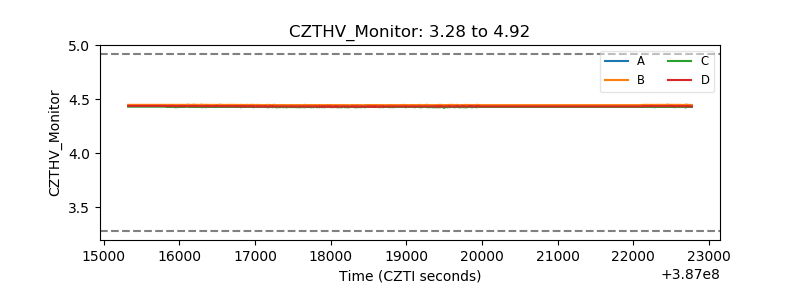 |
| D_VDD | 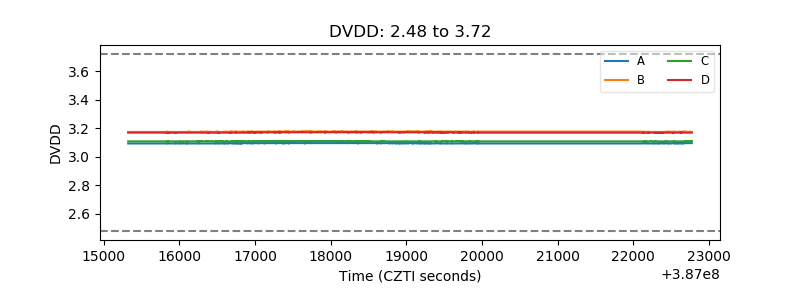 |
| Temperature 1 | 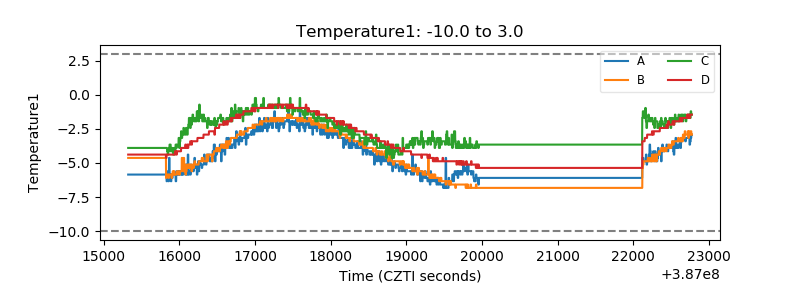 |
| Veto HV Monitor | 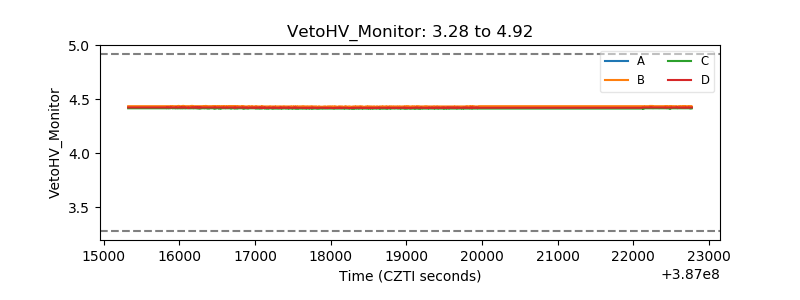 |
| Veto LLD | 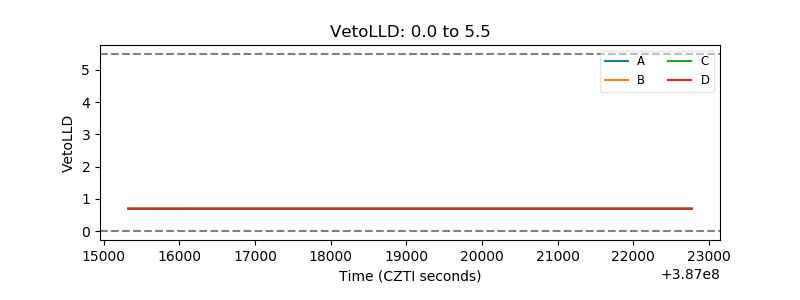 |
| Alpha Counter | 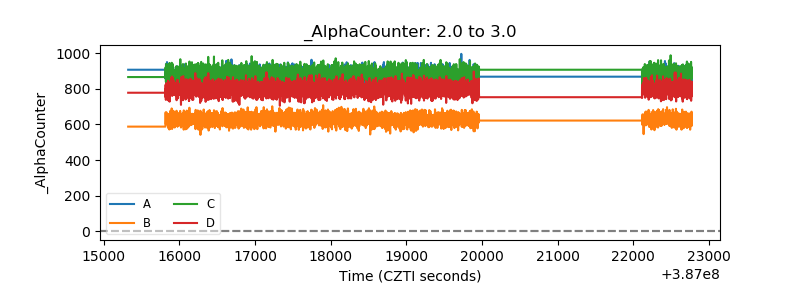 |
| _CPM_Rate | 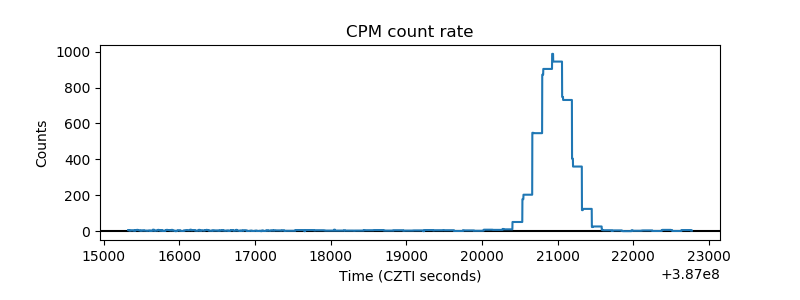 |
| CZT Counter | 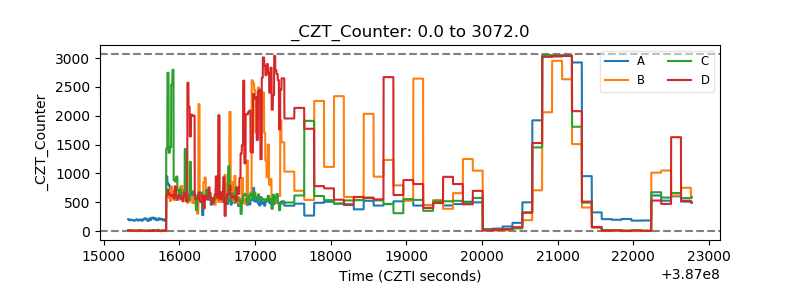 |
| +2.5 Volts monitor | 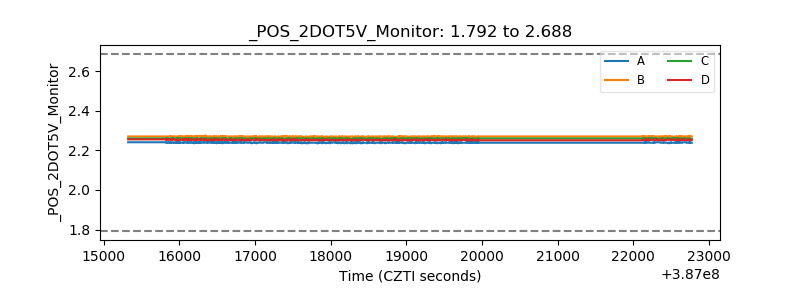 |
| +5 Volts monitor | 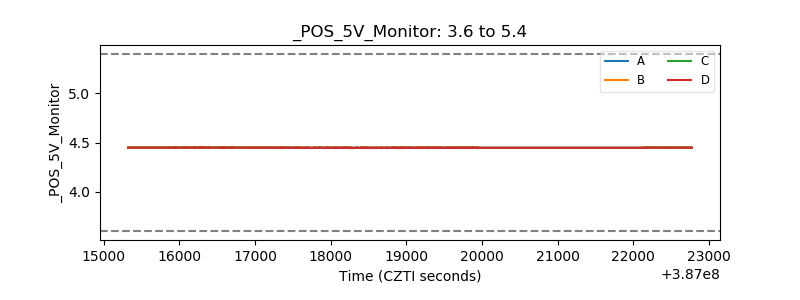 |
| _ROLL_ROT | 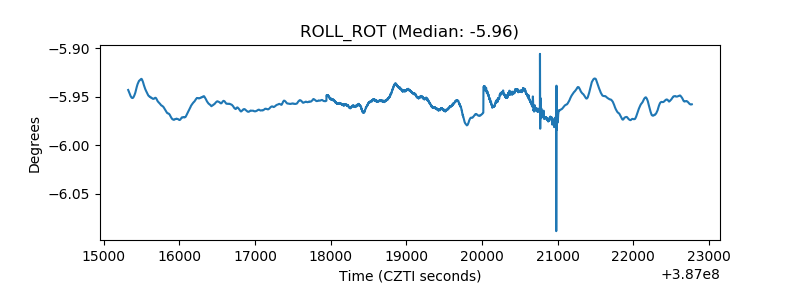 |
| _Roll_DEC | 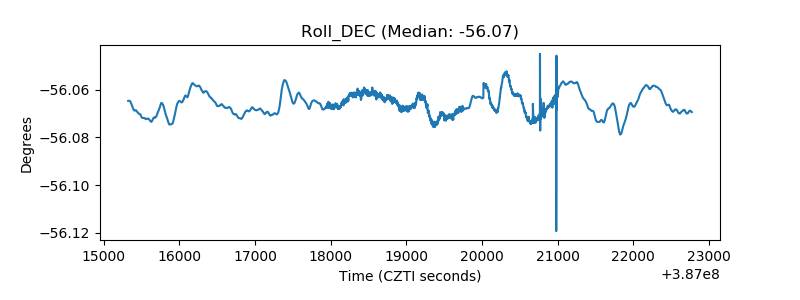 |
| _Roll_RA | 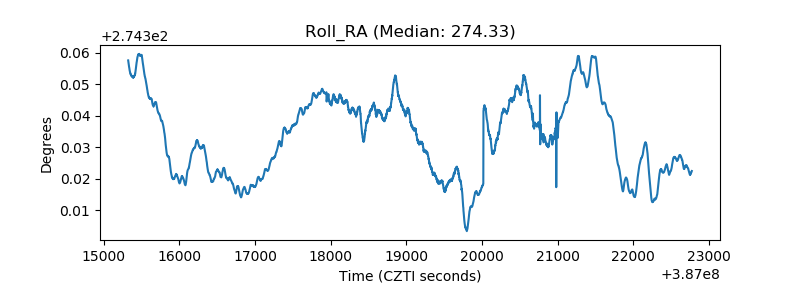 |
| Veto Counter | 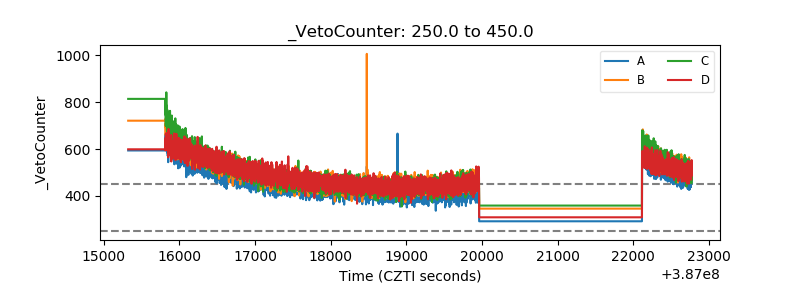 |