| Param | Original file | Final file |
|---|---|---|
| Filename | modeM0/AS1A11_082T01_9000005056_35276cztM0_level2.evt | modeM0/AS1A11_082T01_9000005056_35276cztM0_level2_quad_clean.evt |
| Size (bytes) | 489,643,200 | 73,408,320 |
| Size | 467.0 MB | 70.0 MB |
| Events in quadrant A | 2,687,536 | 487,714 |
| Events in quadrant B | 4,362,431 | 467,364 |
| Events in quadrant C | 3,679,996 | 465,576 |
| Events in quadrant D | 3,759,372 | 450,615 |
| Mode M0 | |||
|---|---|---|---|
| Quadrant | BADHDUFLAG | Total packets | Discarded packets |
| A | 0 | 10816 | 3 |
| B | 0 | 16243 | 2 |
| C | 0 | 14348 | 2 |
| D | 0 | 14572 | 2 |
| Mode SS | |||
|---|---|---|---|
| Quadrant | BADHDUFLAG | Total packets | Discarded packets |
| A | 0 | 102 | 0 |
| B | 0 | 102 | 0 |
| C | 0 | 102 | 0 |
| D | 0 | 102 | 0 |
| Mode M9 | |||
|---|---|---|---|
| Quadrant | BADHDUFLAG | Total packets | Discarded packets |
| A | 0 | 27 | 0 |
| B | 0 | 27 | 0 |
| C | 0 | 27 | 0 |
| D | 0 | 28 | 0 |
| Quadrant | Total seconds | Saturated seconds | Saturation percentage |
|---|---|---|---|
| A | 5011 | 16 | 0.319298% |
| B | 5011 | 499 | 9.958092% |
| C | 5011 | 185 | 3.691878% |
| D | 5011 | 215 | 4.290561% |
Noise dominated data is calculated using 1-second bins in cleaned event files. If a bin has >2000 counts, and if more than 50% of those come from <1% of pixels, then it is considered to be noise-dominated and hence unusable.
| Quadrant | # 1 sec bins | Bins with >0 counts | Bins with >2000 counts | High rate bins dominated by noise | Noise dominated (total time) | Noise dominated (detector-on time) | Marked lightcurve |
|---|---|---|---|---|---|---|---|
| A | 7074 | 5012 | 5 | 5 | 0.07% | 0.10% | 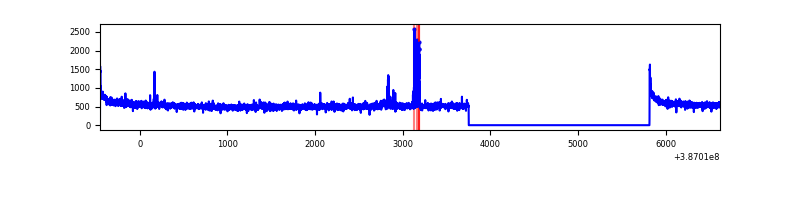 |
| B | 7074 | 5012 | 364 | 364 | 5.15% | 7.26% | 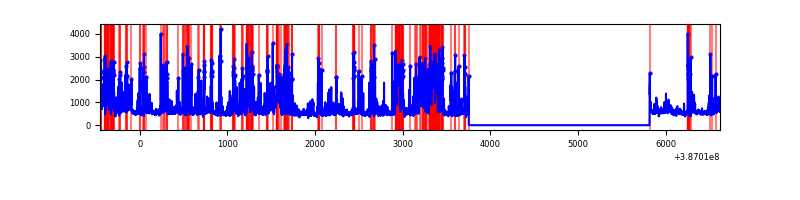 |
| C | 7074 | 5012 | 157 | 157 | 2.22% | 3.13% | 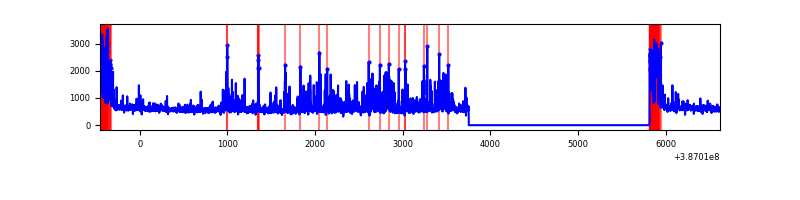 |
| D | 7074 | 5012 | 174 | 174 | 2.46% | 3.47% | 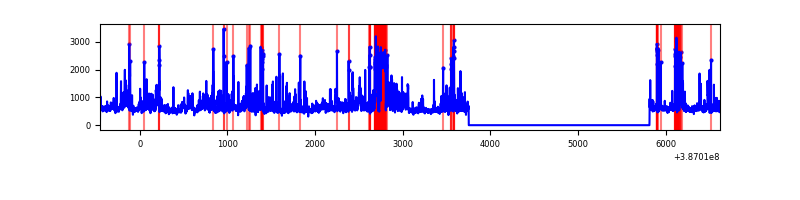 |
Top three noisy pixels from each quadrant. If the there are fewer than three noisy pixels in the level2.evt file, extra rows are filled as -1
| Pixel properties | Quadrant properties | ||||||
|---|---|---|---|---|---|---|---|
| Quadrant | DetID | PixID | Counts | Sigma | Mean | Median | Sigma |
| A | 10 | 83 | 93446 | 712.64 | 651 | 638 | 130.2 |
| A | 15 | 174 | 58526 | 444.5 | 651 | 638 | 130.2 |
| A | 13 | 6 | 11666 | 84.68 | 651 | 638 | 130.2 |
| B | 5 | 236 | 1161343 | 10028.04 | 616 | 602 | 115.7 |
| B | 5 | 172 | 533119 | 4600.59 | 616 | 602 | 115.7 |
| B | 14 | 207 | 176564 | 1520.2 | 616 | 602 | 115.7 |
| C | 0 | 10 | 930888 | 6506.13 | 621 | 627 | 143.0 |
| C | 15 | 214 | 208862 | 1456.37 | 621 | 627 | 143.0 |
| C | 0 | 207 | 65671 | 454.91 | 621 | 627 | 143.0 |
| D | 8 | 230 | 307467 | 2032.69 | 624 | 609 | 151.0 |
| D | 10 | 118 | 243629 | 1609.81 | 624 | 609 | 151.0 |
| D | 13 | 249 | 185756 | 1226.45 | 624 | 609 | 151.0 |
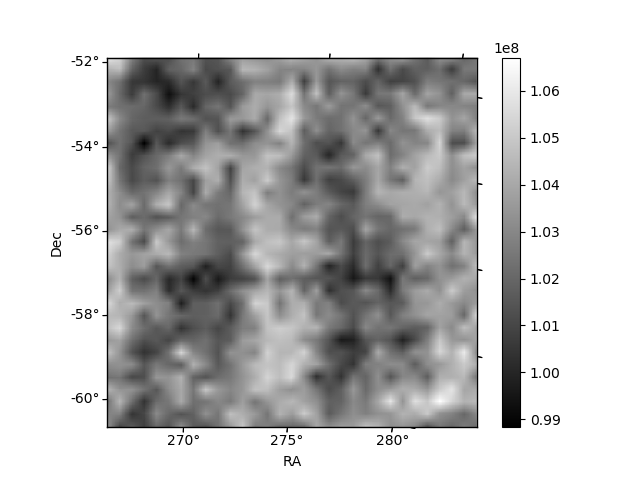
Histogram calculated using DETX and DETY for each event in the final _common_clean file
| Quadrant A | 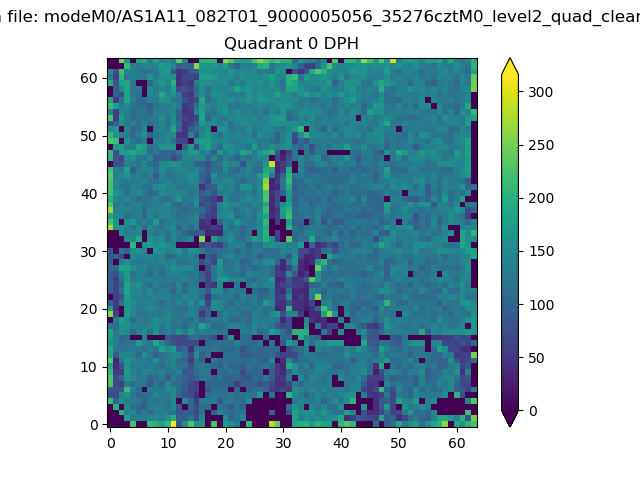 |
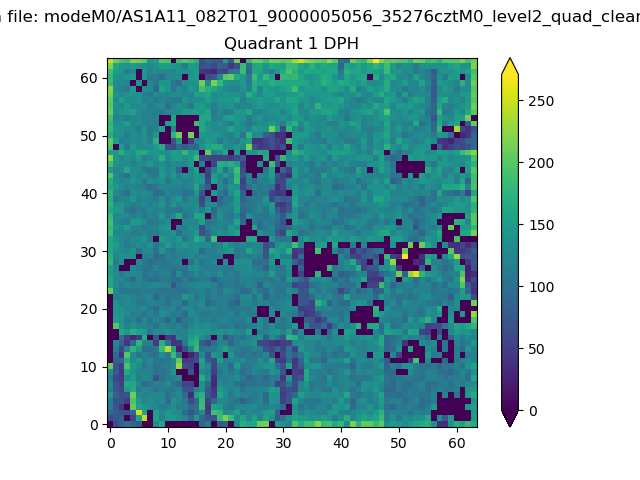 |
Quadrant B |
|---|---|---|---|
| Quadrant D | 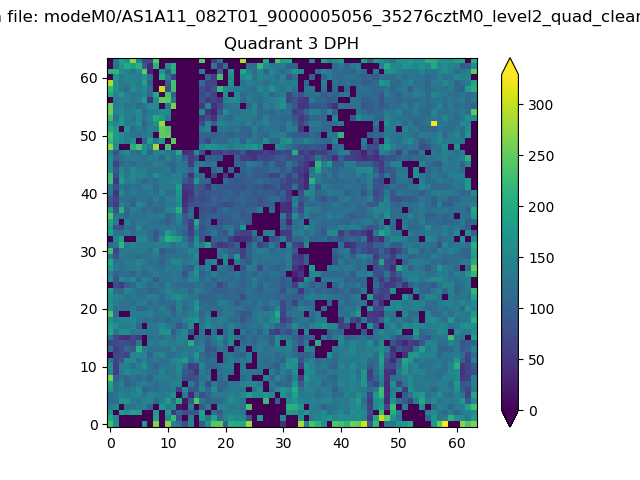 |
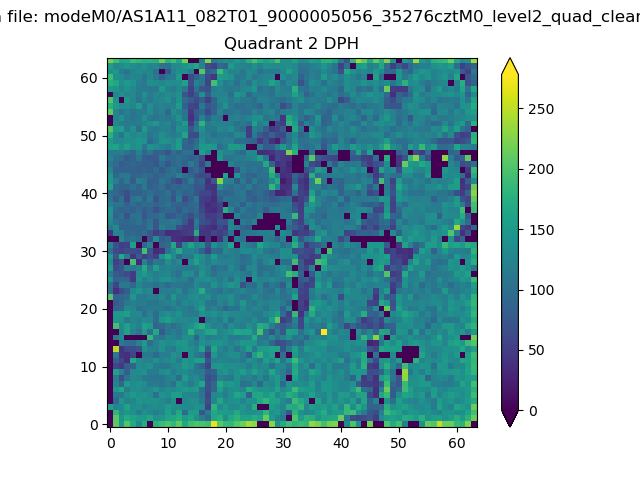 |
Quadrant C |
| Plot type | Count rate plots | Images |
|---|---|---|
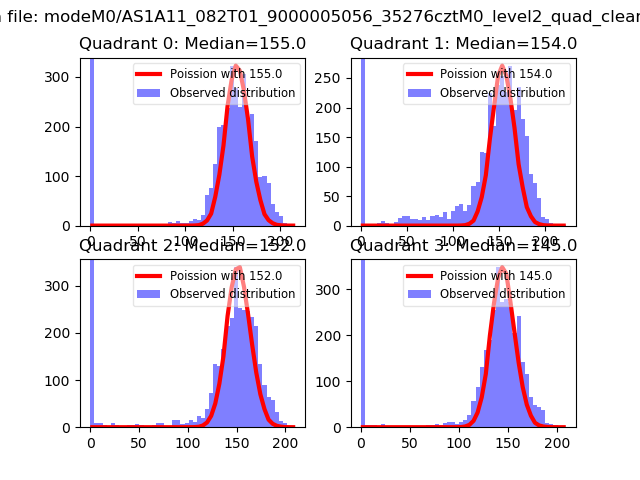
| Comparison with Poisson distribution Blue bars denote a histogram of data divided into 1 sec bins. Red curve is a Poisson curve with rate = median count rate of data. |
 |
 |
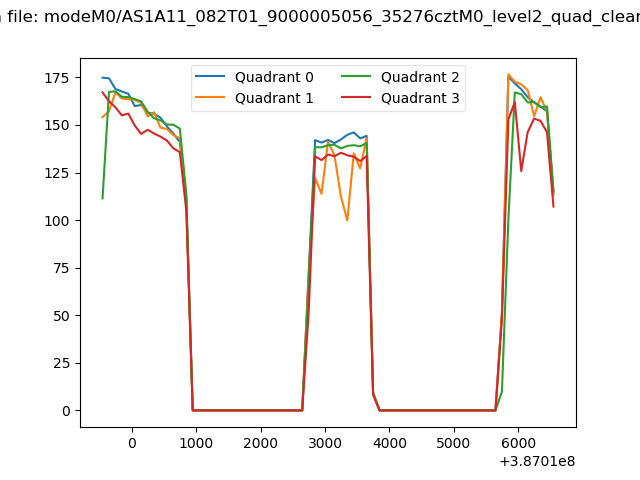
| Quadrant-wise count rates Data is divided into 100 sec bins |
 |
|
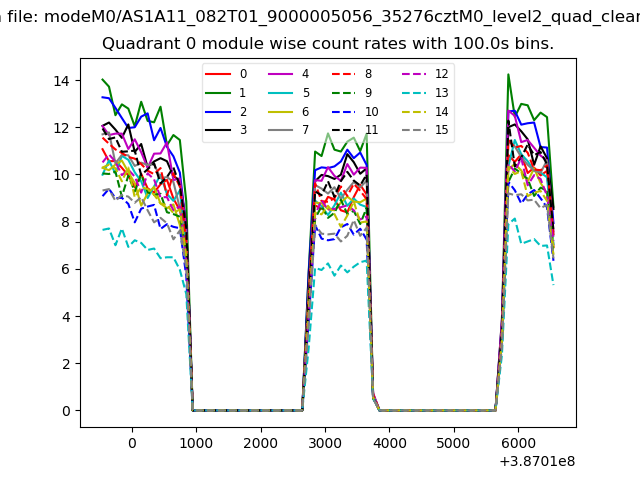
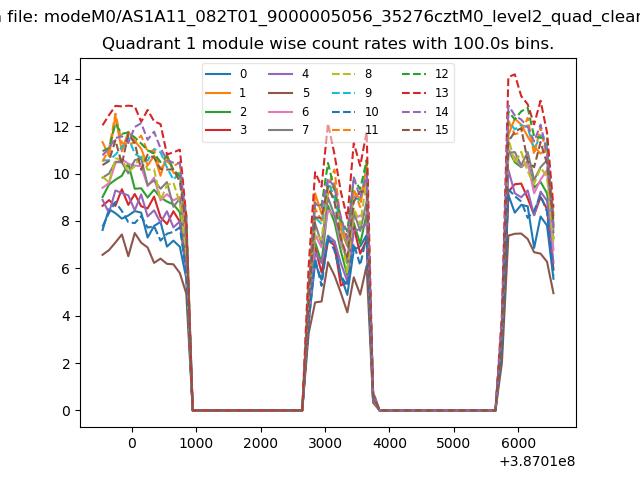
| Module-wise count rates for Quadrant A Data is divided into 100 sec bins |
 |
 |
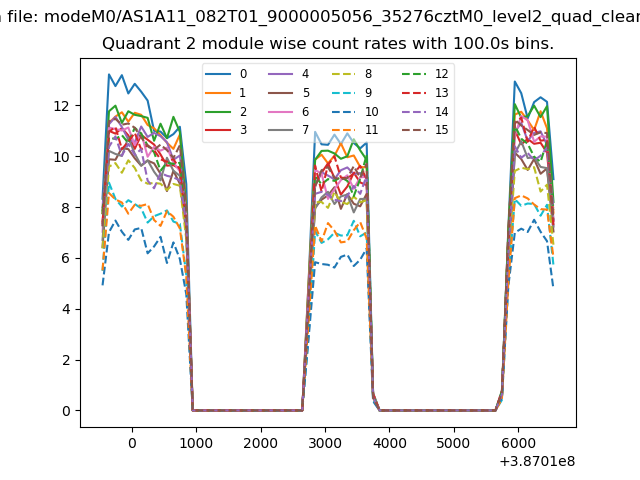
| Module-wise count rates for Quadrant B Data is divided into 100 sec bins |
 |
 |
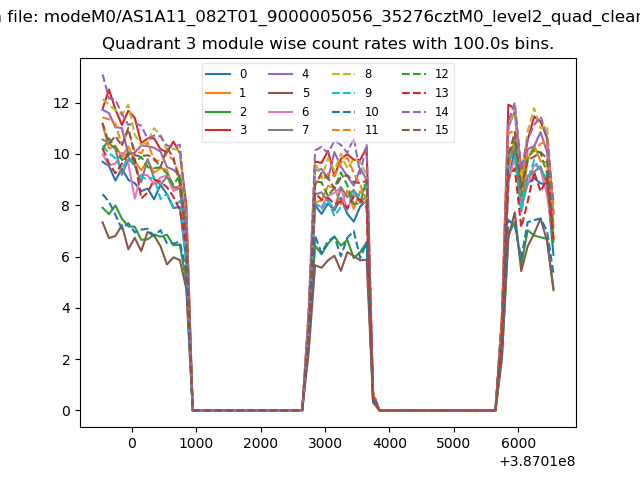
| Module-wise count rates for Quadrant C Data is divided into 100 sec bins |
 |
 |
| Module-wise count rates for Quadrant D Data is divided into 100 sec bins |
 |
 |
| Parameter | Plot |
|---|---|
| CZT HV Monitor | 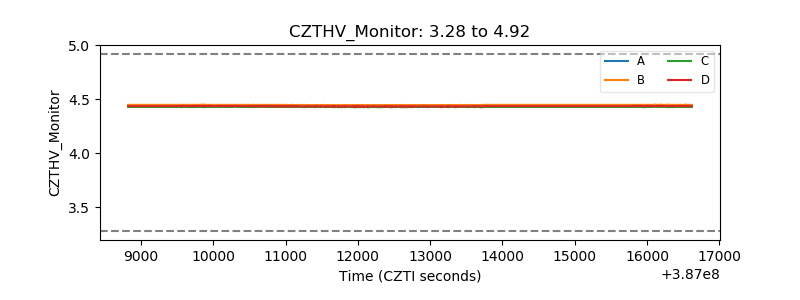 |
| D_VDD | 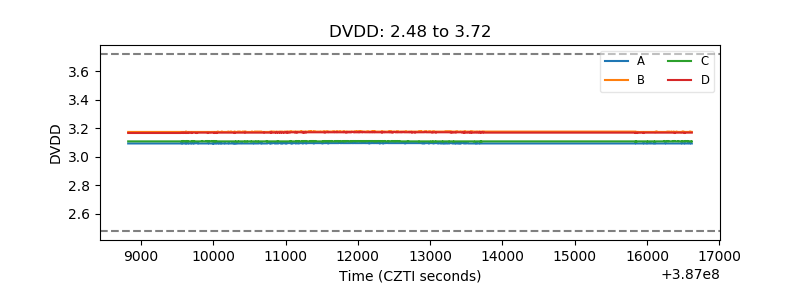 |
| Temperature 1 | 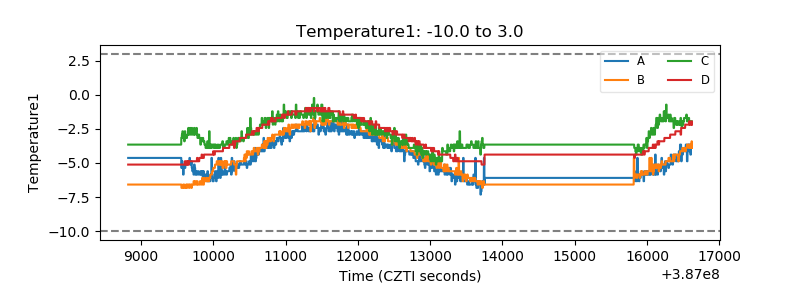 |
| Veto HV Monitor | 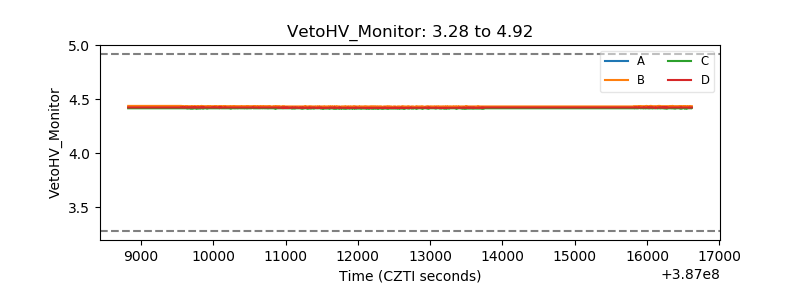 |
| Veto LLD |  |
| Alpha Counter | 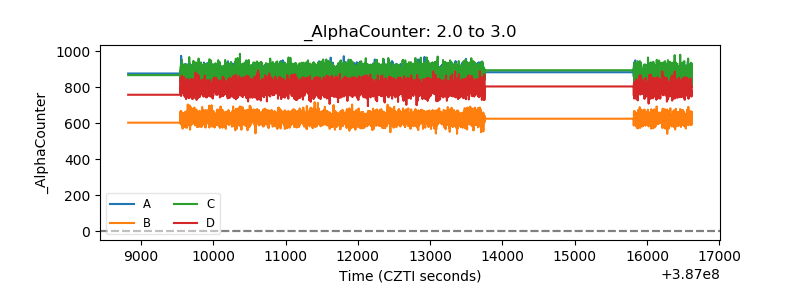 |
| _CPM_Rate |  |
| CZT Counter | 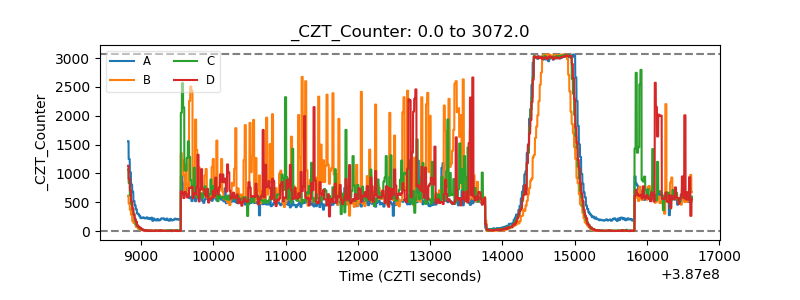 |
| +2.5 Volts monitor | 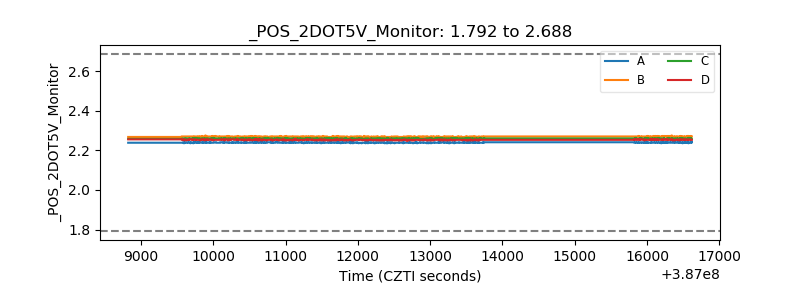 |
| +5 Volts monitor | 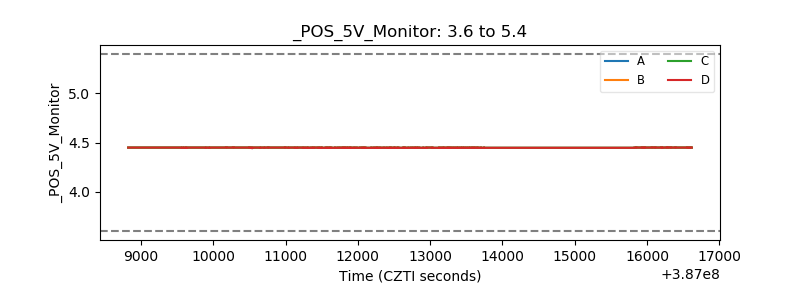 |
| _ROLL_ROT | 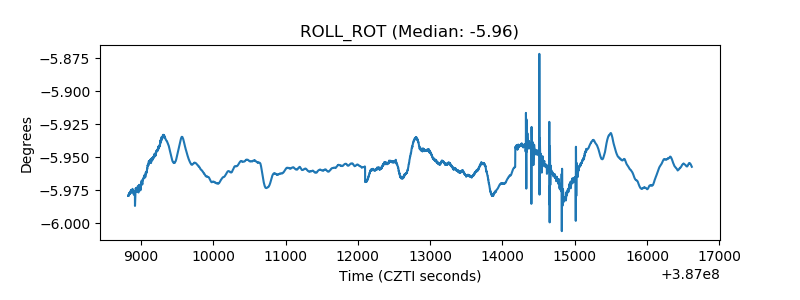 |
| _Roll_DEC | 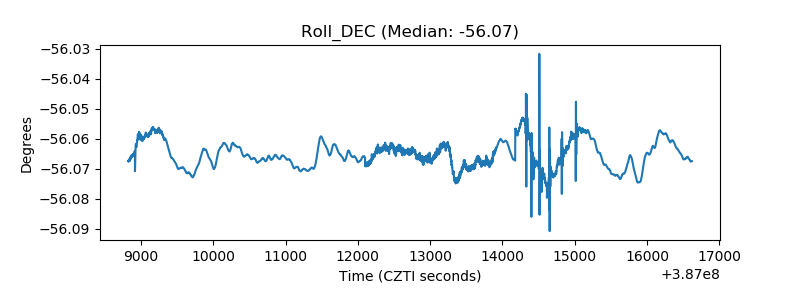 |
| _Roll_RA | 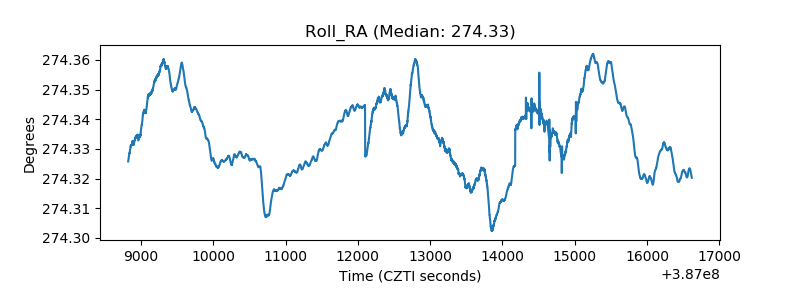 |
| Veto Counter | 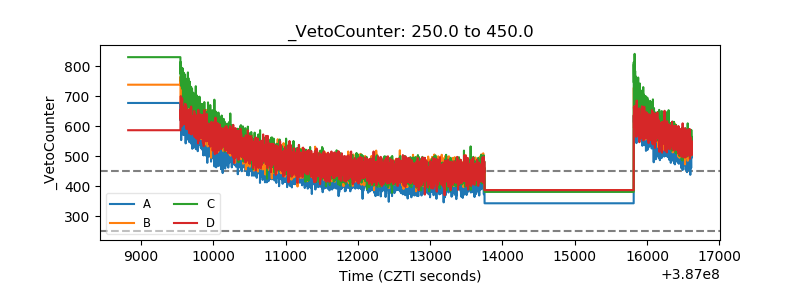 |