| Param | Original file | Final file |
|---|---|---|
| Filename | modeM0/AS1A11_082T01_9000005056_35275cztM0_level2.evt | modeM0/AS1A11_082T01_9000005056_35275cztM0_level2_quad_clean.evt |
| Size (bytes) | 515,399,040 | 73,900,800 |
| Size | 491.5 MB | 70.5 MB |
| Events in quadrant A | 2,625,729 | 484,881 |
| Events in quadrant B | 5,830,541 | 460,183 |
| Events in quadrant C | 3,299,011 | 476,971 |
| Events in quadrant D | 3,507,718 | 457,814 |
| Mode M0 | |||
|---|---|---|---|
| Quadrant | BADHDUFLAG | Total packets | Discarded packets |
| A | 0 | 10784 | 3 |
| B | 0 | 20870 | 2 |
| C | 0 | 12974 | 2 |
| D | 0 | 13834 | 2 |
| Mode SS | |||
|---|---|---|---|
| Quadrant | BADHDUFLAG | Total packets | Discarded packets |
| A | 0 | 104 | 0 |
| B | 0 | 104 | 0 |
| C | 0 | 104 | 0 |
| D | 0 | 104 | 0 |
| Mode M9 | |||
|---|---|---|---|
| Quadrant | BADHDUFLAG | Total packets | Discarded packets |
| A | 0 | 29 | 0 |
| B | 0 | 29 | 0 |
| C | 0 | 29 | 0 |
| D | 0 | 30 | 0 |
| Quadrant | Total seconds | Saturated seconds | Saturation percentage |
|---|---|---|---|
| A | 5106 | 8 | 0.156678% |
| B | 5106 | 1064 | 20.838230% |
| C | 5106 | 116 | 2.271837% |
| D | 5106 | 90 | 1.762632% |
Noise dominated data is calculated using 1-second bins in cleaned event files. If a bin has >2000 counts, and if more than 50% of those come from <1% of pixels, then it is considered to be noise-dominated and hence unusable.
| Quadrant | # 1 sec bins | Bins with >0 counts | Bins with >2000 counts | High rate bins dominated by noise | Noise dominated (total time) | Noise dominated (detector-on time) | Marked lightcurve |
|---|---|---|---|---|---|---|---|
| A | 7079 | 5107 | 2 | 2 | 0.03% | 0.04% | 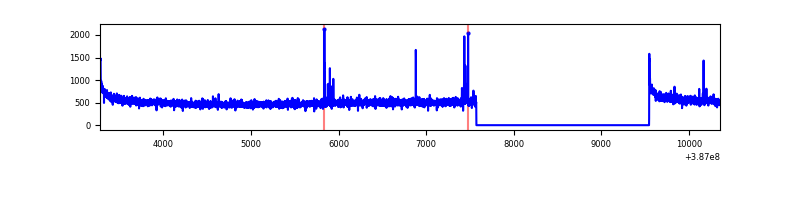 |
| B | 7079 | 5107 | 780 | 780 | 11.02% | 15.27% | 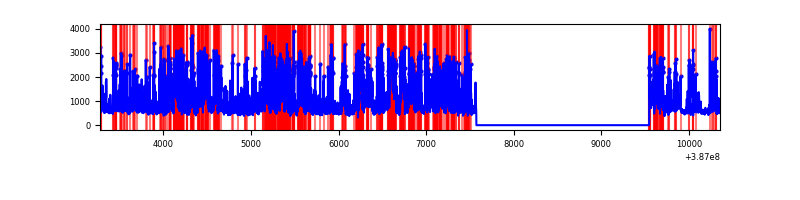 |
| C | 7079 | 5107 | 89 | 89 | 1.26% | 1.74% | 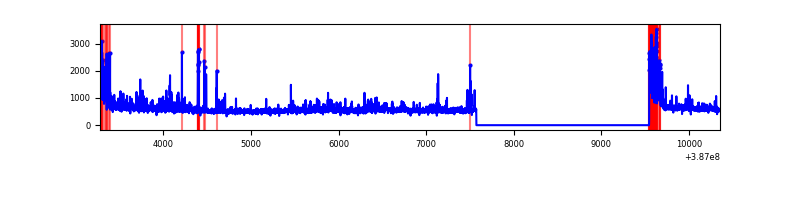 |
| D | 7079 | 5107 | 71 | 71 | 1.00% | 1.39% | 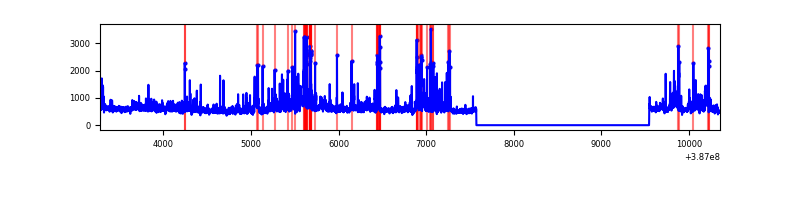 |
Top three noisy pixels from each quadrant. If the there are fewer than three noisy pixels in the level2.evt file, extra rows are filled as -1
| Pixel properties | Quadrant properties | ||||||
|---|---|---|---|---|---|---|---|
| Quadrant | DetID | PixID | Counts | Sigma | Mean | Median | Sigma |
| A | 10 | 83 | 96290 | 748.94 | 644 | 633 | 127.7 |
| A | 15 | 174 | 22942 | 174.67 | 644 | 633 | 127.7 |
| A | 13 | 6 | 8512 | 61.69 | 644 | 633 | 127.7 |
| B | 5 | 236 | 2622648 | 23803.51 | 588 | 574 | 110.2 |
| B | 5 | 172 | 668577 | 6064.21 | 588 | 574 | 110.2 |
| B | 14 | 207 | 163404 | 1478.19 | 588 | 574 | 110.2 |
| C | 0 | 10 | 561227 | 3865.77 | 629 | 636 | 145.0 |
| C | 15 | 214 | 215208 | 1479.66 | 629 | 636 | 145.0 |
| C | 0 | 207 | 32003 | 216.3 | 629 | 636 | 145.0 |
| D | 7 | 80 | 277348 | 1809.24 | 636 | 620 | 153.0 |
| D | 8 | 195 | 228709 | 1491.24 | 636 | 620 | 153.0 |
| D | 8 | 230 | 112060 | 728.59 | 636 | 620 | 153.0 |
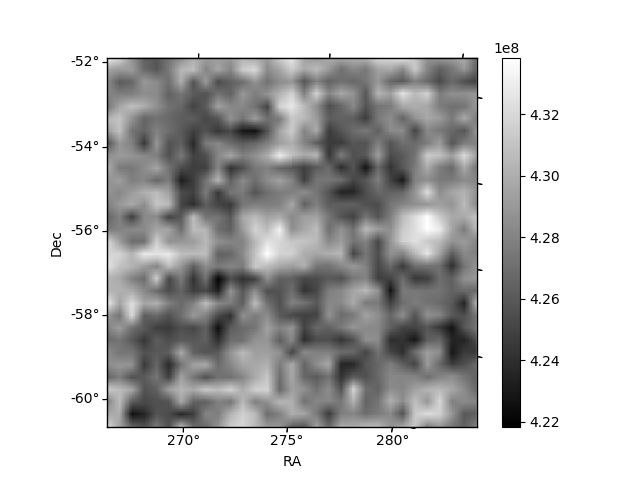
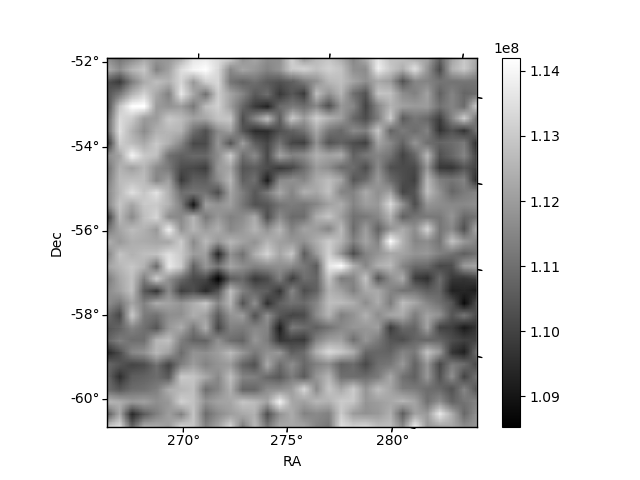
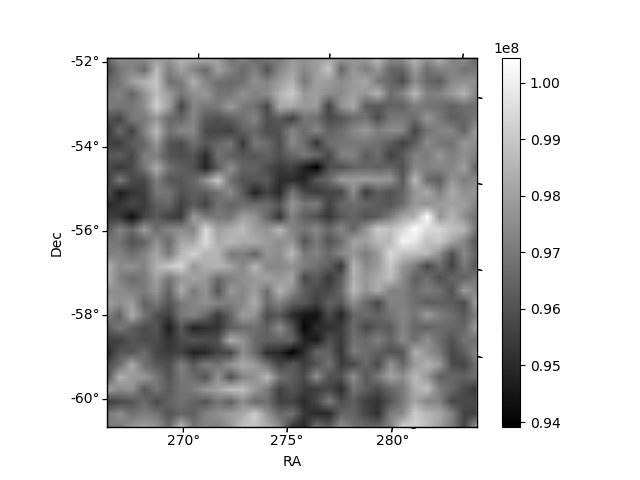
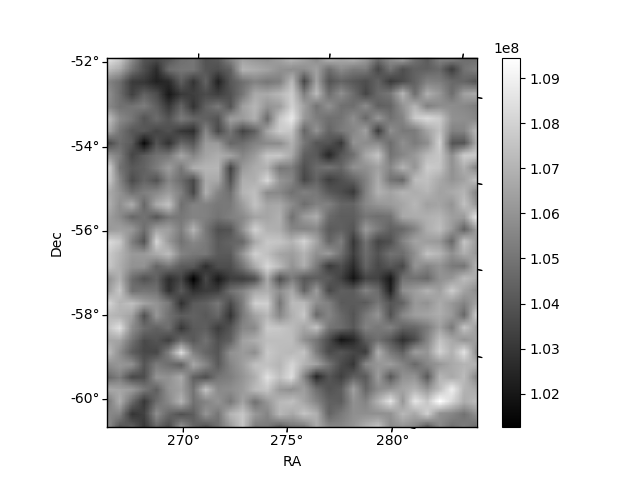
Histogram calculated using DETX and DETY for each event in the final _common_clean file
| Quadrant A | 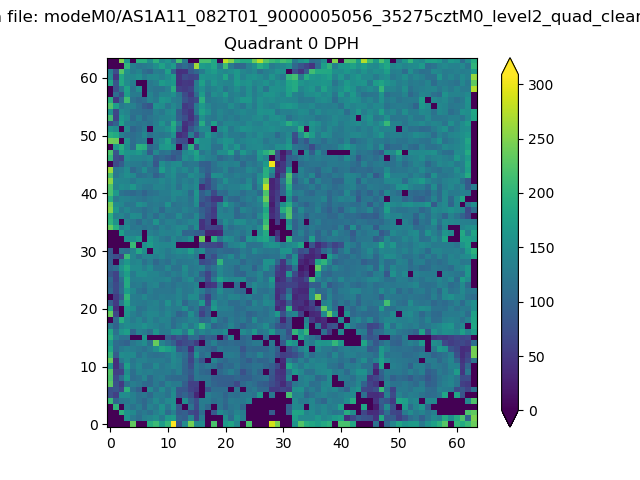 |
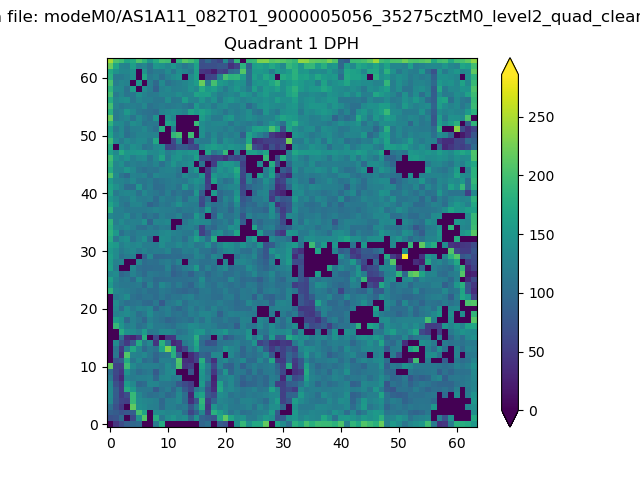 |
Quadrant B |
|---|---|---|---|
| Quadrant D | 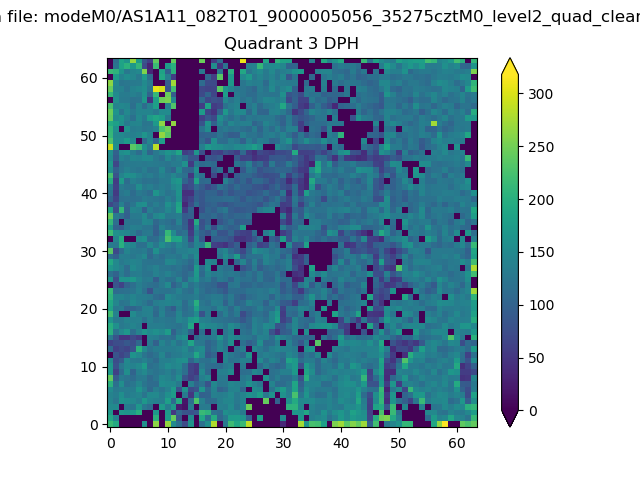 |
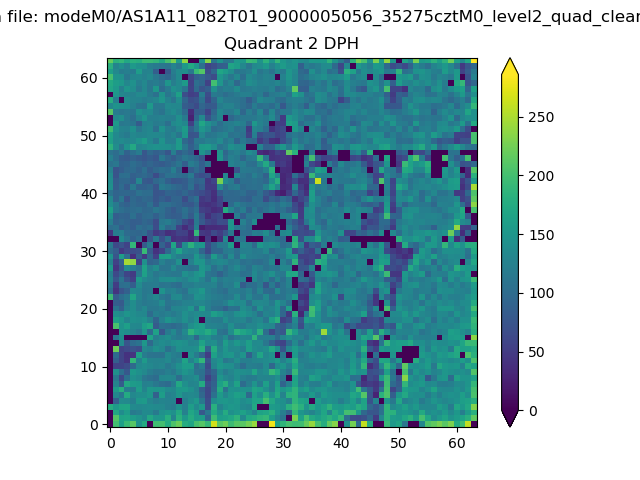 |
Quadrant C |
| Plot type | Count rate plots | Images |
|---|---|---|
| Comparison with Poisson distribution Blue bars denote a histogram of data divided into 1 sec bins. Red curve is a Poisson curve with rate = median count rate of data. |
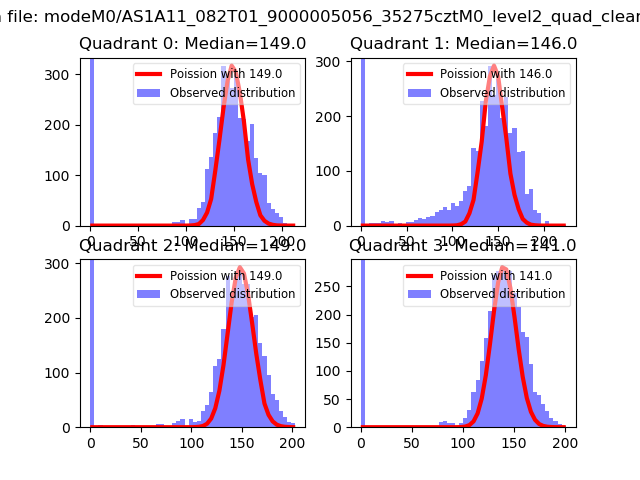 |
 |
| Quadrant-wise count rates Data is divided into 100 sec bins |
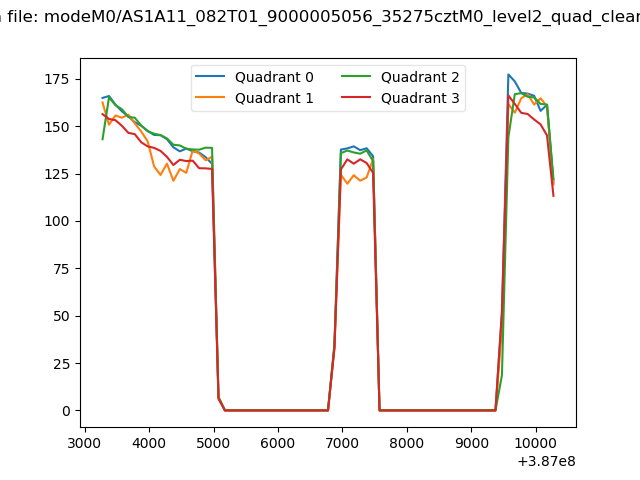 |
|
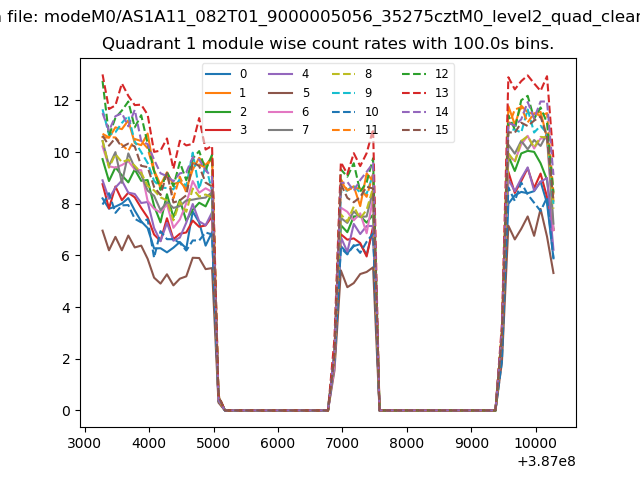
| Module-wise count rates for Quadrant A Data is divided into 100 sec bins |
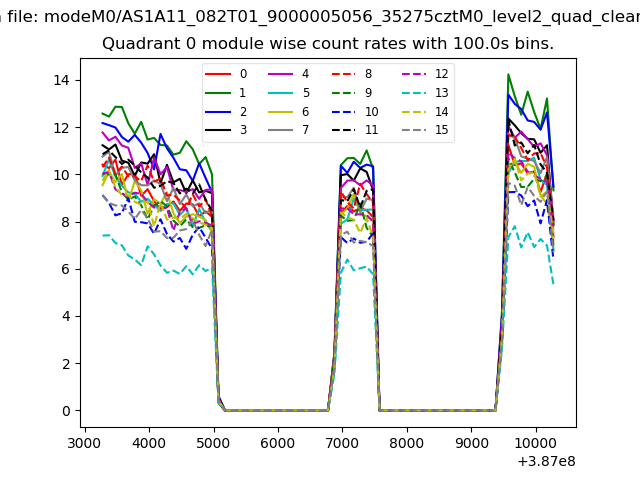 |
 |
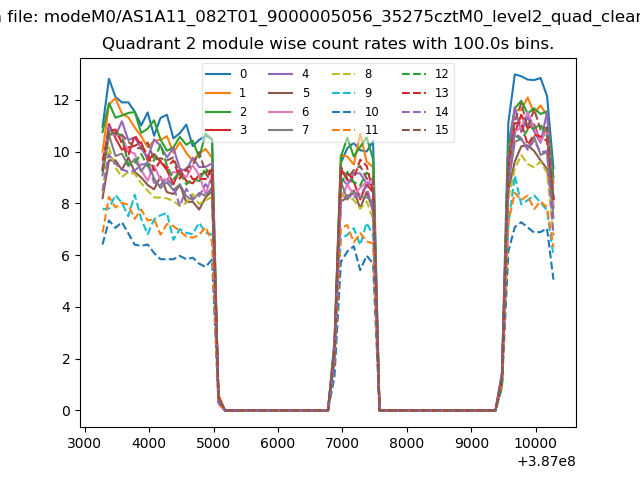
| Module-wise count rates for Quadrant B Data is divided into 100 sec bins |
 |
 |
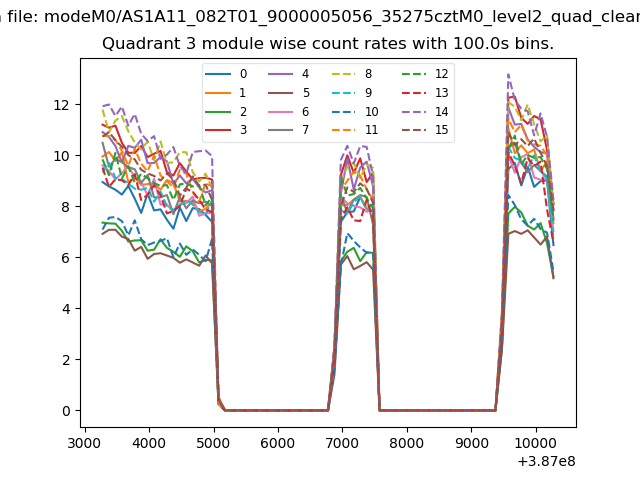
| Module-wise count rates for Quadrant C Data is divided into 100 sec bins |
 |
 |
| Module-wise count rates for Quadrant D Data is divided into 100 sec bins |
 |
 |
| Parameter | Plot |
|---|---|
| CZT HV Monitor |  |
| D_VDD | 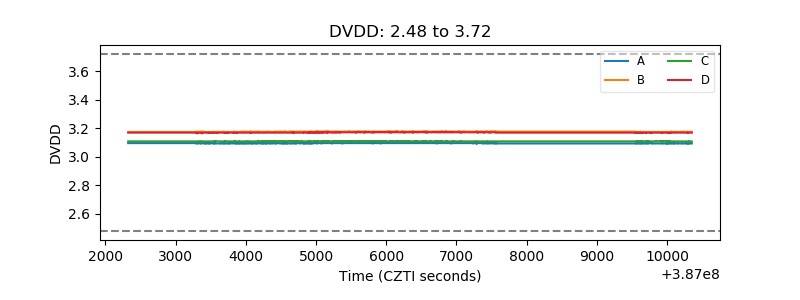 |
| Temperature 1 | 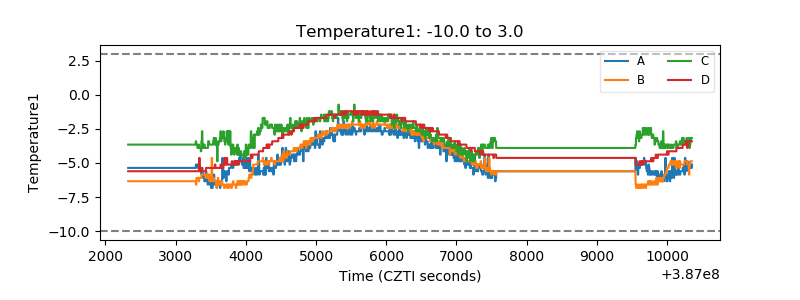 |
| Veto HV Monitor | 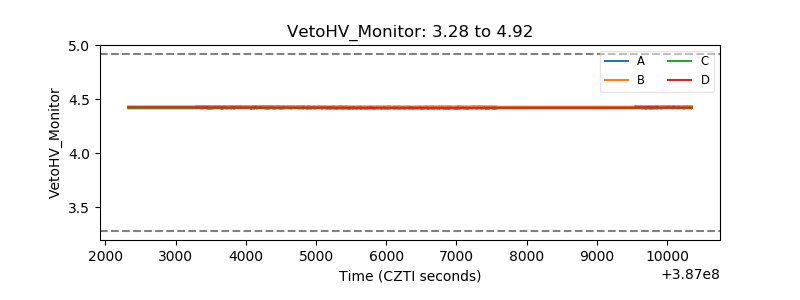 |
| Veto LLD | 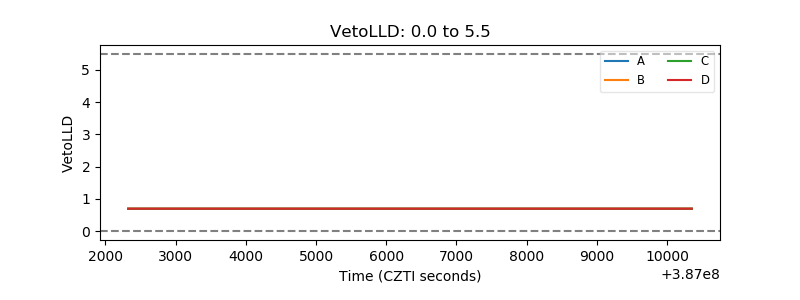 |
| Alpha Counter | 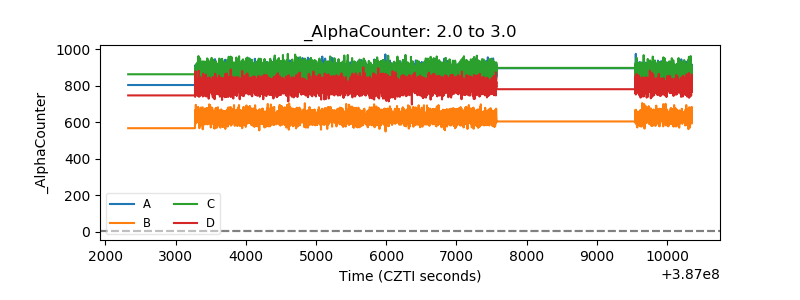 |
| _CPM_Rate | 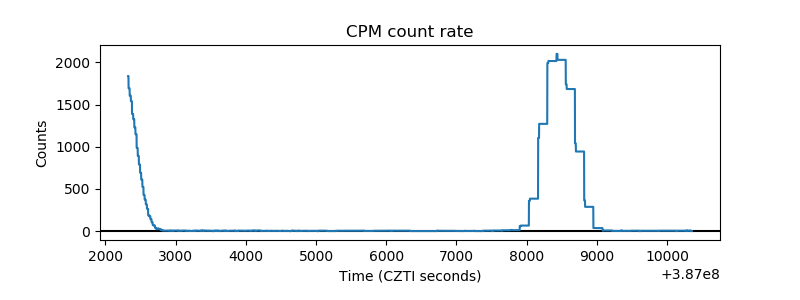 |
| CZT Counter | 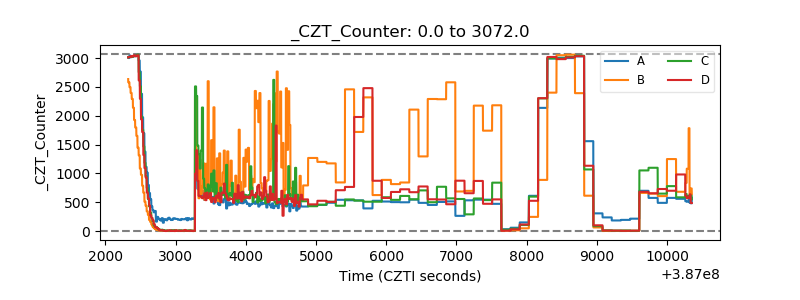 |
| +2.5 Volts monitor | 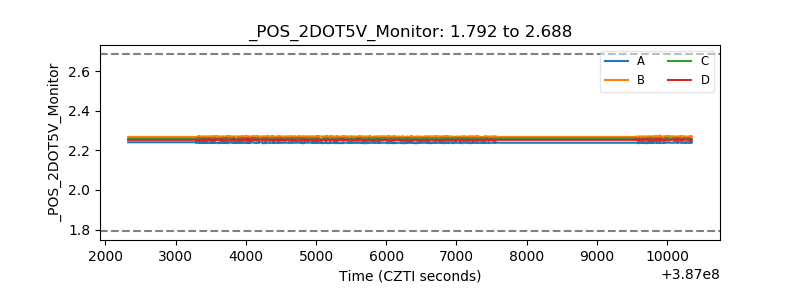 |
| +5 Volts monitor | 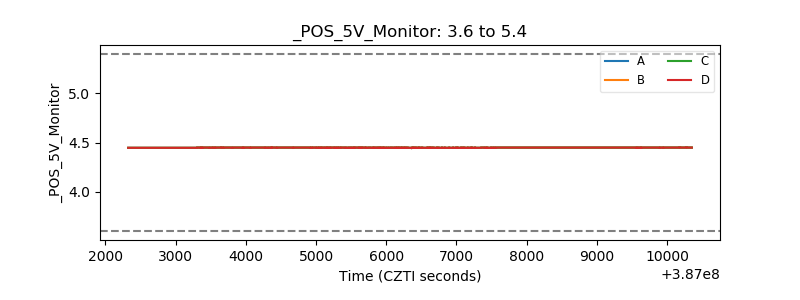 |
| _ROLL_ROT | 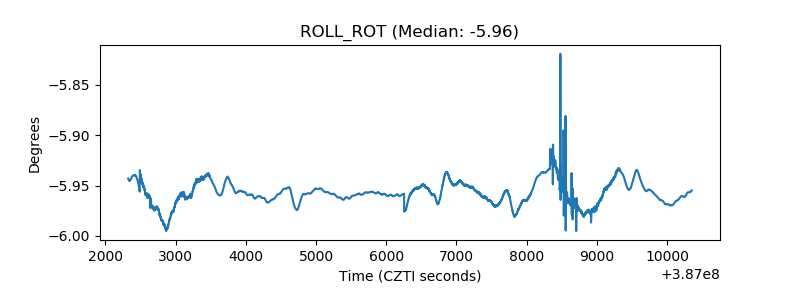 |
| _Roll_DEC | 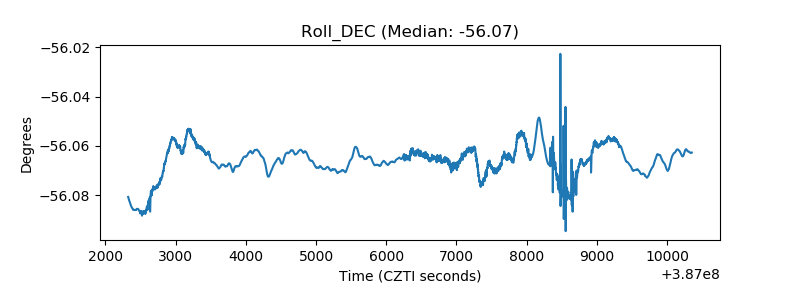 |
| _Roll_RA | 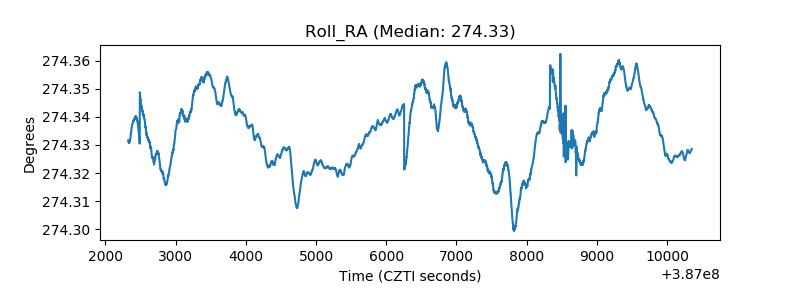 |
| Veto Counter | 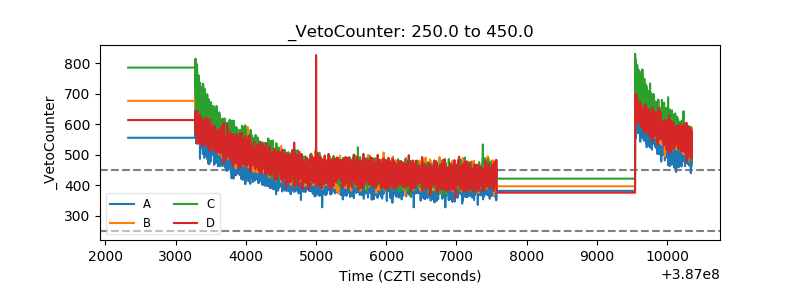 |