| Param | Original file | Final file |
|---|---|---|
| Filename | modeM0/AS1A11_082T01_9000005056_35274cztM0_level2.evt | modeM0/AS1A11_082T01_9000005056_35274cztM0_level2_quad_clean.evt |
| Size (bytes) | 517,515,840 | 63,731,520 |
| Size | 493.5 MB | 60.8 MB |
| Events in quadrant A | 2,359,596 | 411,836 |
| Events in quadrant B | 6,622,704 | 378,100 |
| Events in quadrant C | 2,728,760 | 413,800 |
| Events in quadrant D | 3,632,495 | 384,756 |
| Mode M0 | |||
|---|---|---|---|
| Quadrant | BADHDUFLAG | Total packets | Discarded packets |
| A | 0 | 9956 | 2 |
| B | 0 | 23056 | 1 |
| C | 0 | 10855 | 1 |
| D | 0 | 13933 | 1 |
| Mode SS | |||
|---|---|---|---|
| Quadrant | BADHDUFLAG | Total packets | Discarded packets |
| A | 0 | 98 | 0 |
| B | 0 | 98 | 0 |
| C | 0 | 98 | 0 |
| D | 0 | 98 | 0 |
| Mode M9 | |||
|---|---|---|---|
| Quadrant | BADHDUFLAG | Total packets | Discarded packets |
| A | 0 | 19 | 0 |
| B | 0 | 19 | 0 |
| C | 0 | 19 | 0 |
| D | 0 | 19 | 0 |
| Quadrant | Total seconds | Saturated seconds | Saturation percentage |
|---|---|---|---|
| A | 4861 | 4 | 0.082288% |
| B | 4861 | 1555 | 31.989303% |
| C | 4861 | 41 | 0.843448% |
| D | 4861 | 257 | 5.286978% |
Noise dominated data is calculated using 1-second bins in cleaned event files. If a bin has >2000 counts, and if more than 50% of those come from <1% of pixels, then it is considered to be noise-dominated and hence unusable.
| Quadrant | # 1 sec bins | Bins with >0 counts | Bins with >2000 counts | High rate bins dominated by noise | Noise dominated (total time) | Noise dominated (detector-on time) | Marked lightcurve |
|---|---|---|---|---|---|---|---|
| A | 6715 | 4862 | 0 | 0 | 0.00% | 0.00% | 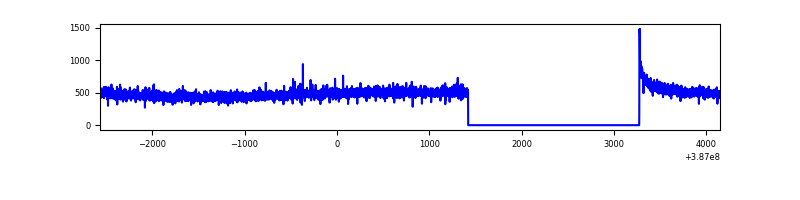 |
| B | 6714 | 4861 | 1149 | 1149 | 17.11% | 23.64% | 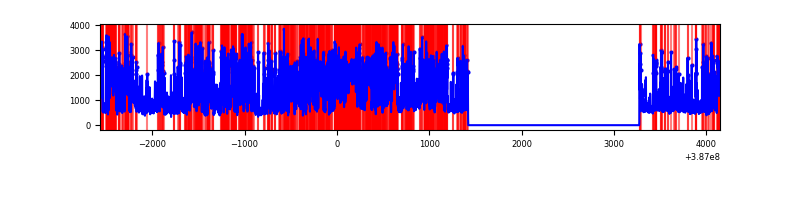 |
| C | 6715 | 4862 | 25 | 25 | 0.37% | 0.51% | 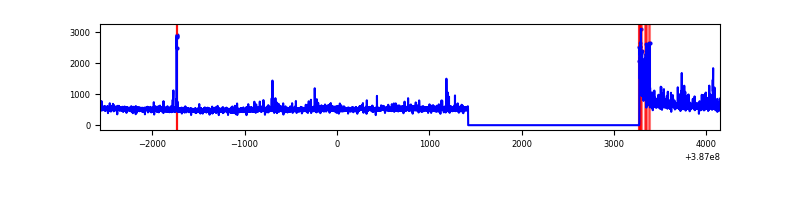 |
| D | 6715 | 4862 | 213 | 213 | 3.17% | 4.38% | 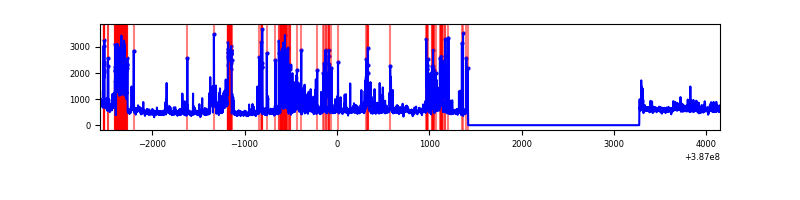 |
Top three noisy pixels from each quadrant. If the there are fewer than three noisy pixels in the level2.evt file, extra rows are filled as -1
| Pixel properties | Quadrant properties | ||||||
|---|---|---|---|---|---|---|---|
| Quadrant | DetID | PixID | Counts | Sigma | Mean | Median | Sigma |
| A | 10 | 83 | 65683 | 557.97 | 588 | 575 | 116.7 |
| A | 13 | 6 | 12659 | 103.56 | 588 | 575 | 116.7 |
| A | 13 | 254 | 8736 | 69.94 | 588 | 575 | 116.7 |
| B | 5 | 236 | 4001875 | 41477.13 | 509 | 496 | 96.5 |
| B | 5 | 172 | 580986 | 6017.19 | 509 | 496 | 96.5 |
| B | 4 | 232 | 18997 | 191.78 | 509 | 496 | 96.5 |
| C | 0 | 10 | 224815 | 1679.26 | 579 | 583 | 133.5 |
| C | 15 | 214 | 200935 | 1500.43 | 579 | 583 | 133.5 |
| C | 9 | 187 | 21653 | 157.79 | 579 | 583 | 133.5 |
| D | 7 | 80 | 659971 | 4676.79 | 574 | 557 | 141.0 |
| D | 2 | 249 | 305272 | 2161.14 | 574 | 557 | 141.0 |
| D | 8 | 195 | 158870 | 1122.81 | 574 | 557 | 141.0 |
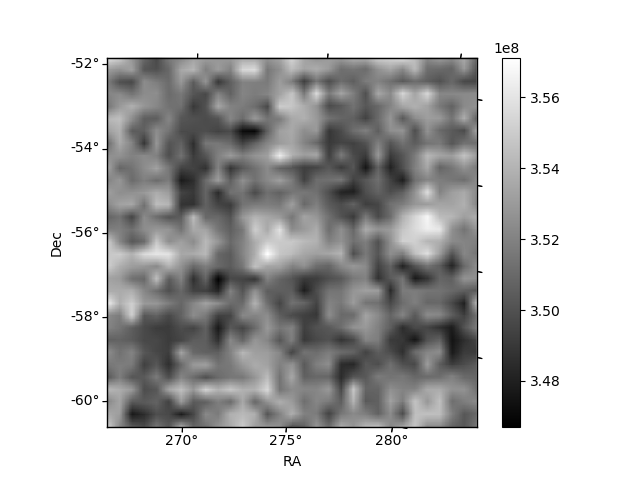
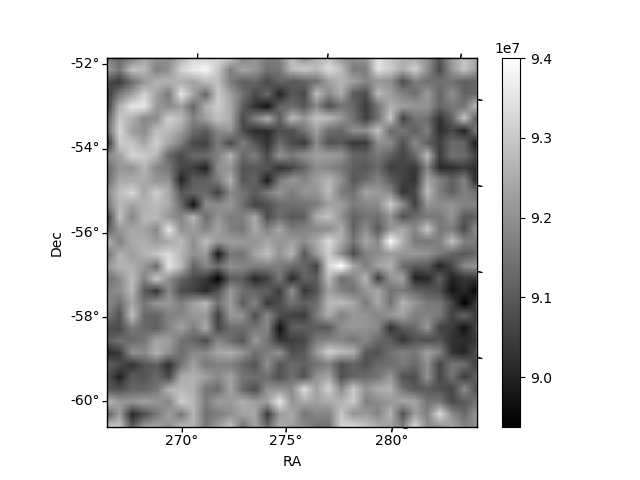
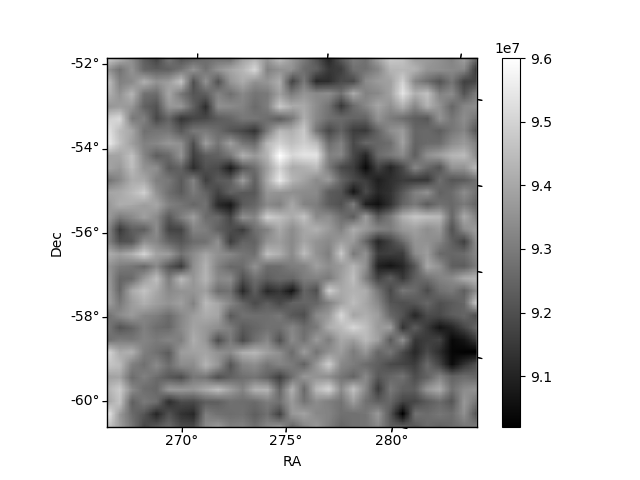
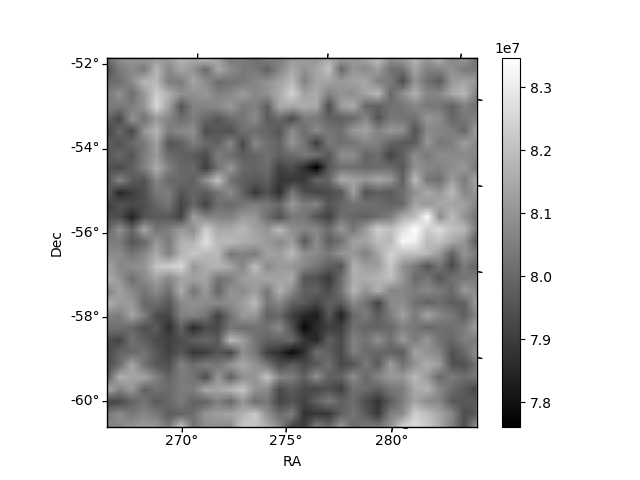
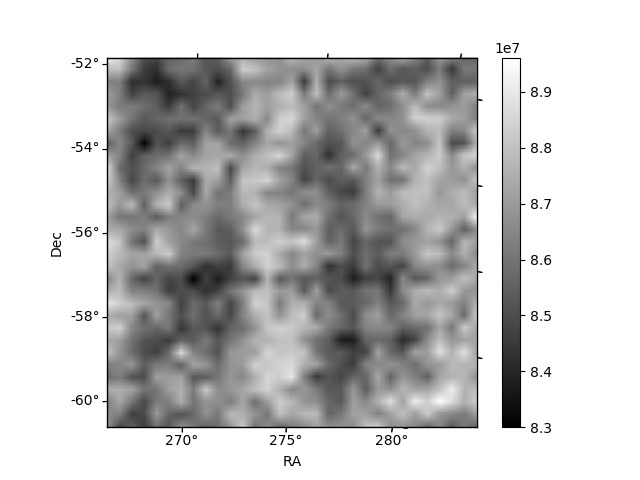
Histogram calculated using DETX and DETY for each event in the final _common_clean file
| Quadrant A | 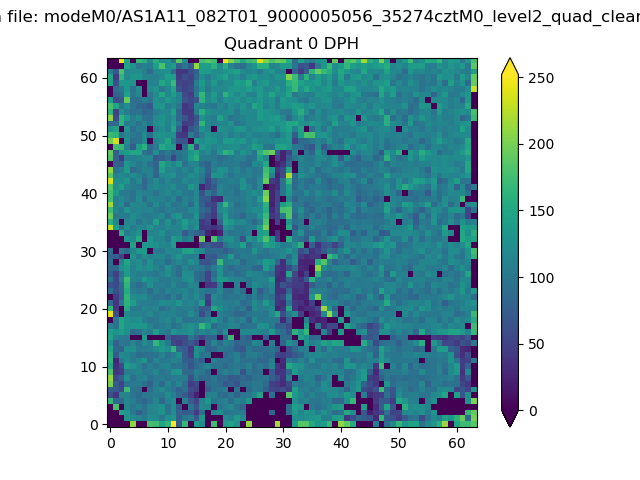 |
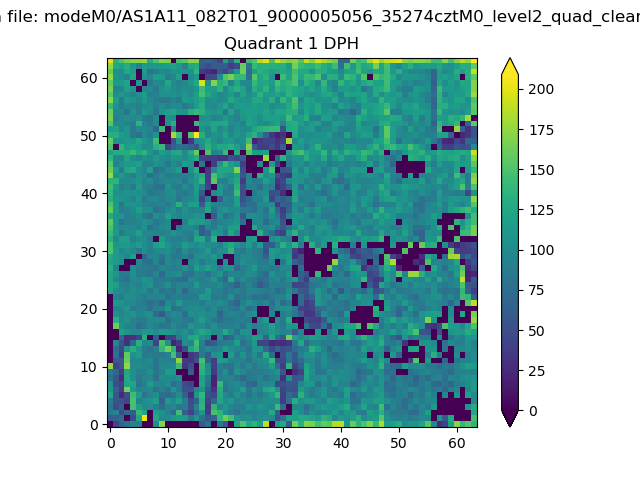 |
Quadrant B |
|---|---|---|---|
| Quadrant D | 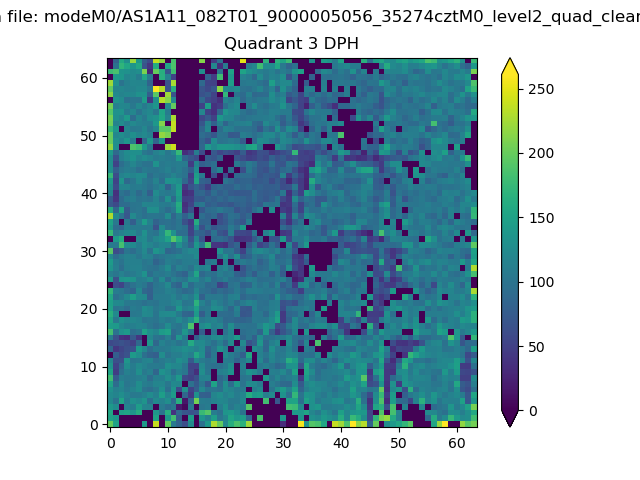 |
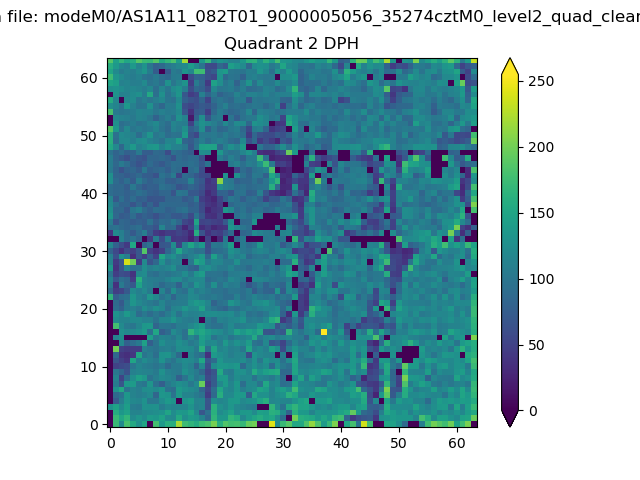 |
Quadrant C |
| Plot type | Count rate plots | Images |
|---|---|---|
| Comparison with Poisson distribution Blue bars denote a histogram of data divided into 1 sec bins. Red curve is a Poisson curve with rate = median count rate of data. |
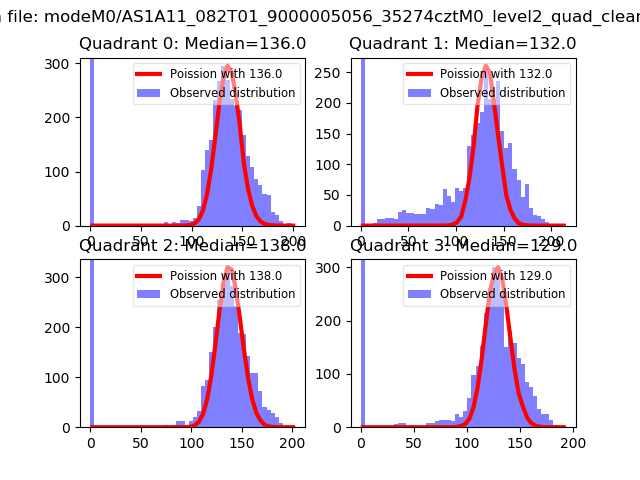 |
 |
| Quadrant-wise count rates Data is divided into 100 sec bins |
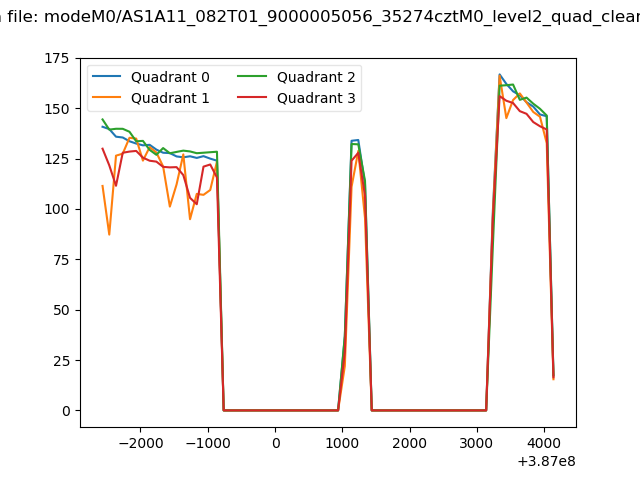 |
|
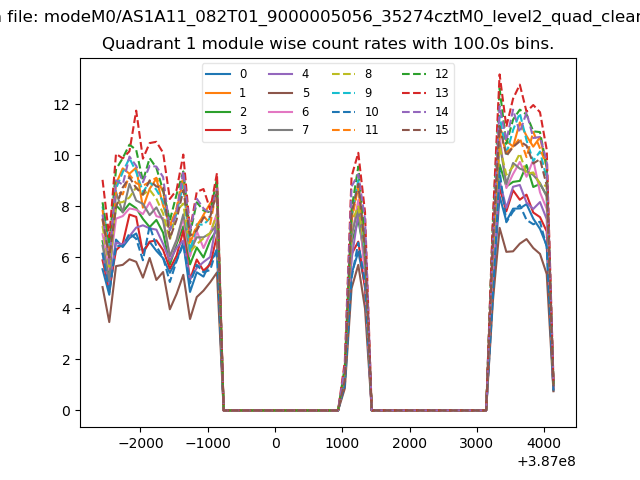
| Module-wise count rates for Quadrant A Data is divided into 100 sec bins |
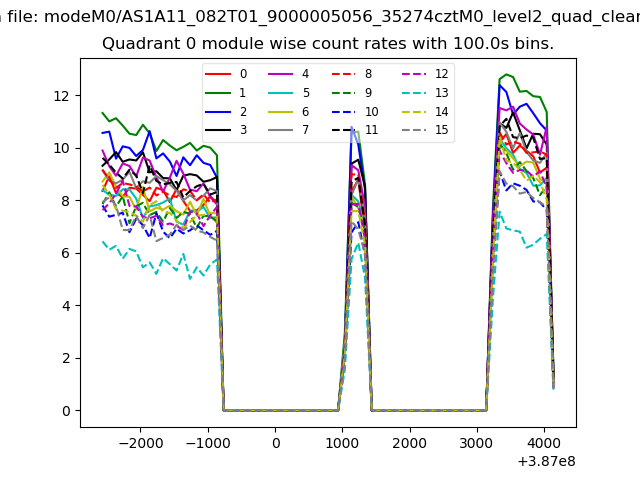 |
 |
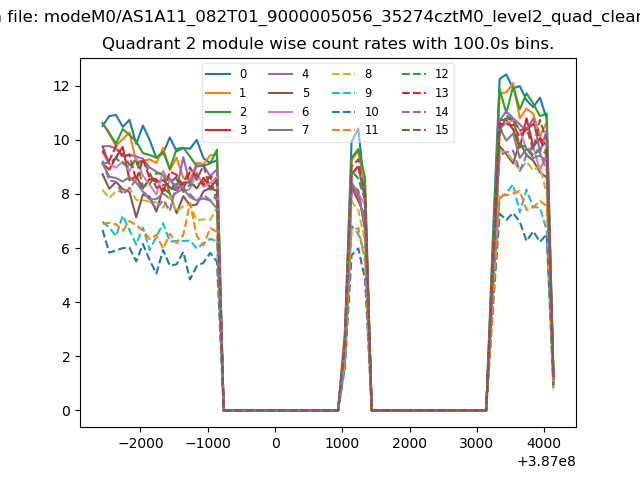
| Module-wise count rates for Quadrant B Data is divided into 100 sec bins |
 |
 |
| Module-wise count rates for Quadrant C Data is divided into 100 sec bins |
 |
 |
| Module-wise count rates for Quadrant D Data is divided into 100 sec bins |
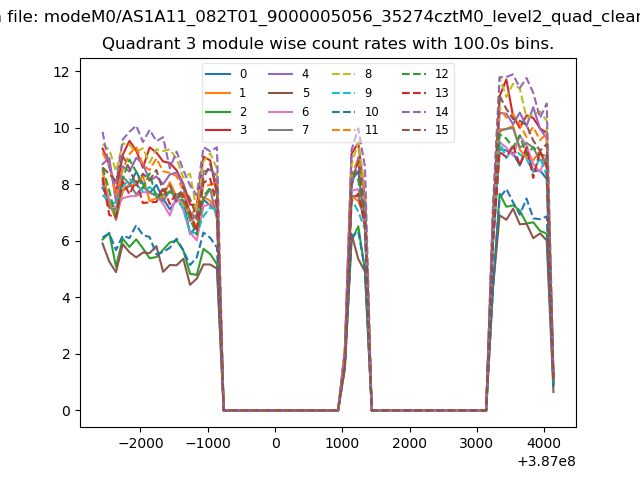 |
 |
| Parameter | Plot |
|---|---|
| CZT HV Monitor | 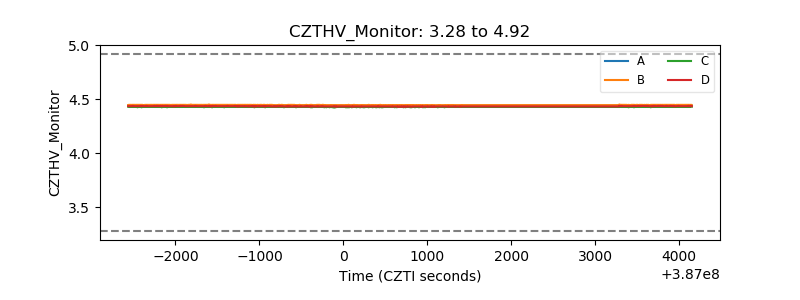 |
| D_VDD | 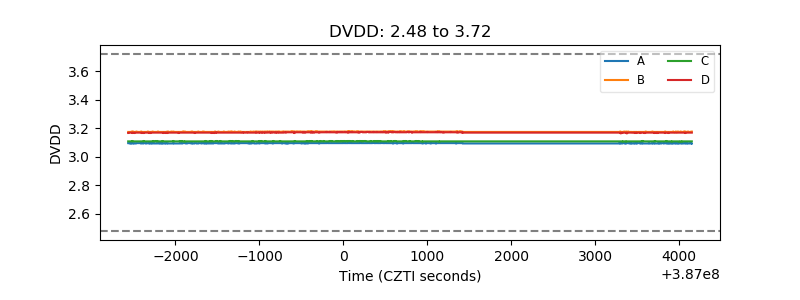 |
| Temperature 1 | 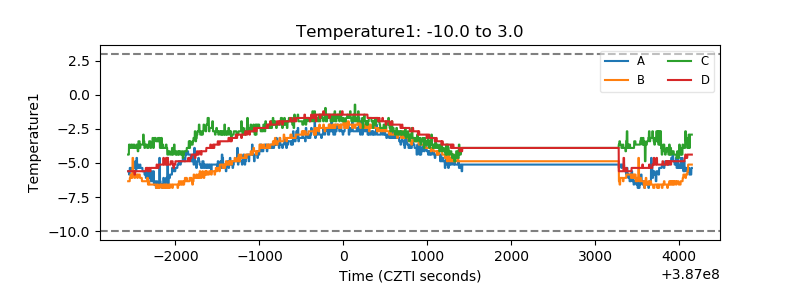 |
| Veto HV Monitor | 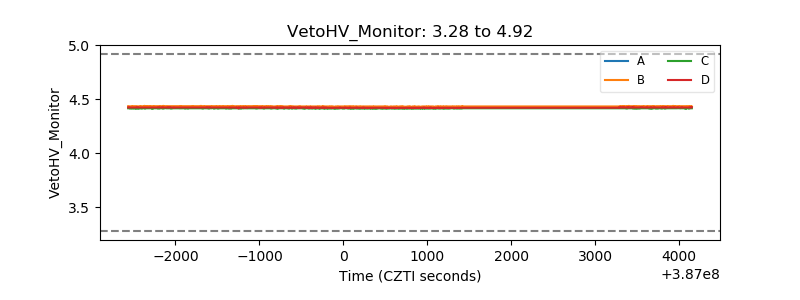 |
| Veto LLD | 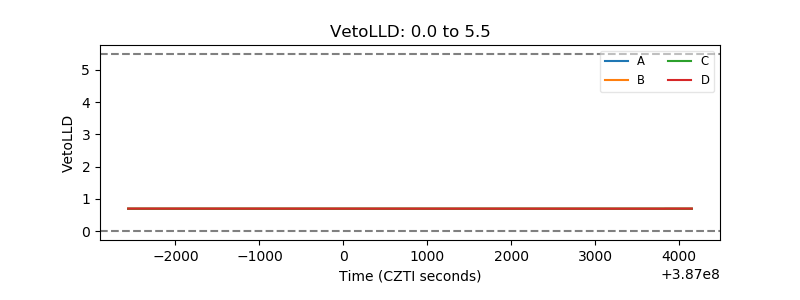 |
| Alpha Counter | 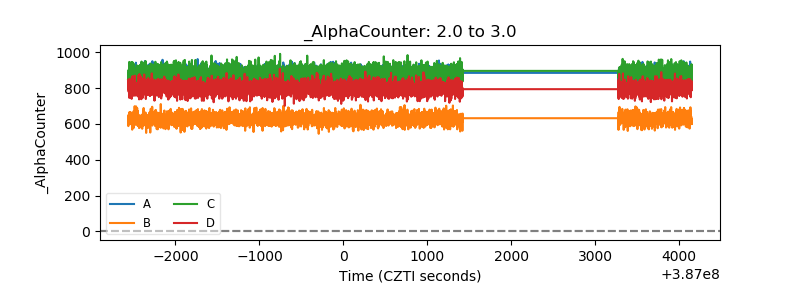 |
| _CPM_Rate | 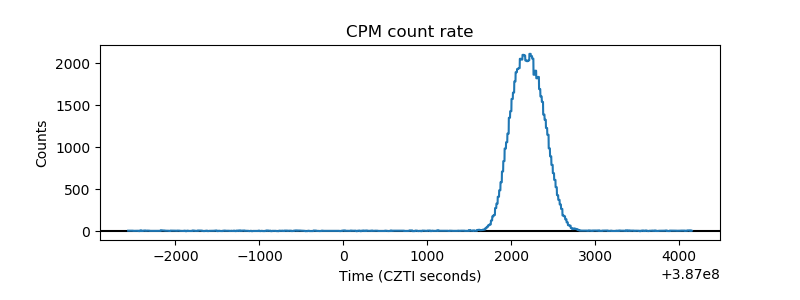 |
| CZT Counter | 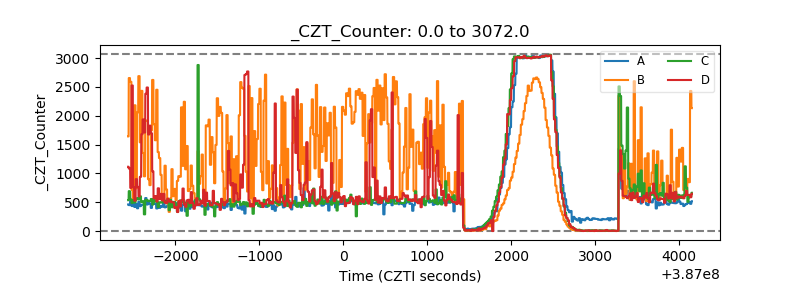 |
| +2.5 Volts monitor | 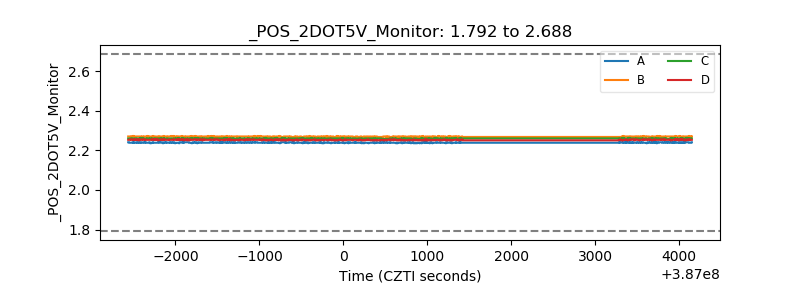 |
| +5 Volts monitor | 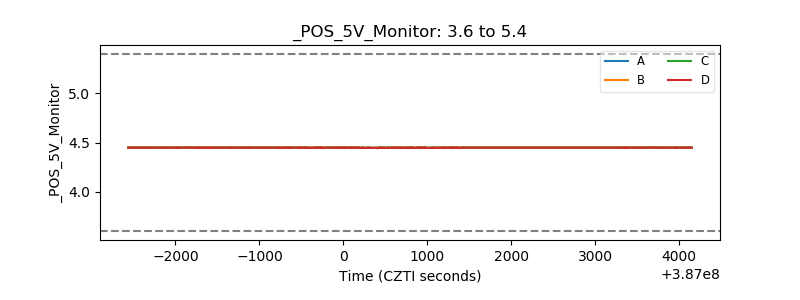 |
| _ROLL_ROT | 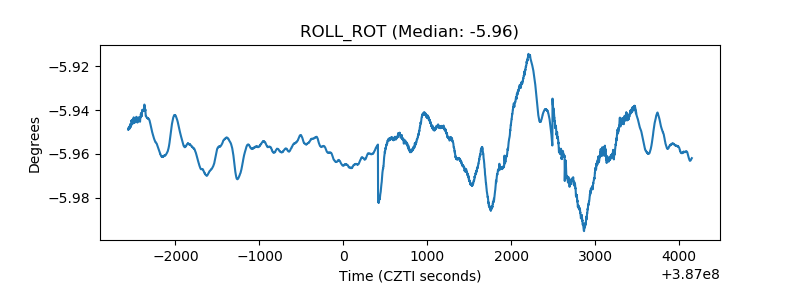 |
| _Roll_DEC | 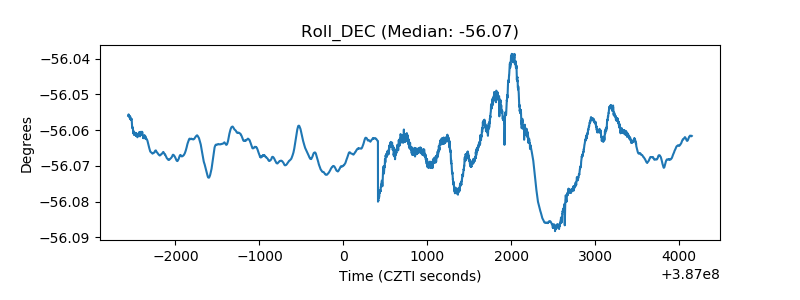 |
| _Roll_RA | 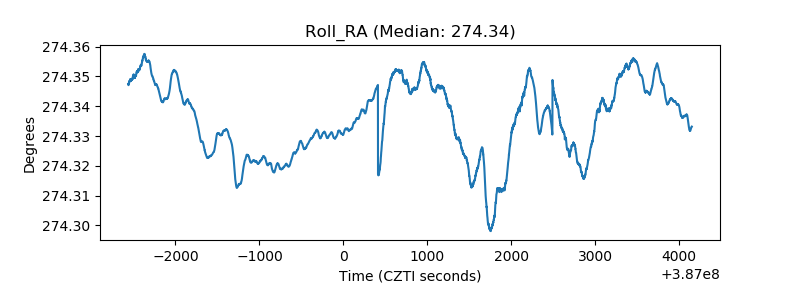 |
| Veto Counter | 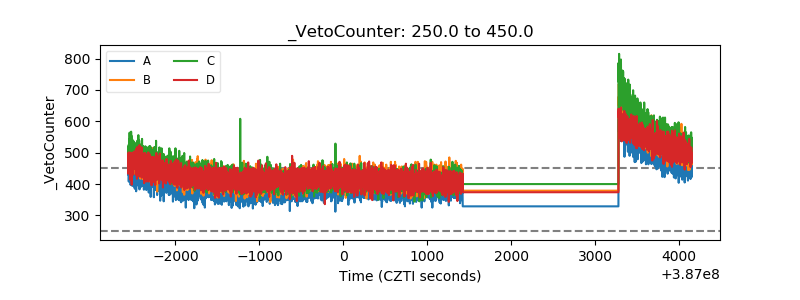 |