| Param | Original file | Final file |
|---|---|---|
| Filename | modeM0/AS1A11_082T01_9000005056_35272cztM0_level2.evt | modeM0/AS1A11_082T01_9000005056_35272cztM0_level2_quad_clean.evt |
| Size (bytes) | 581,495,040 | 77,558,400 |
| Size | 554.6 MB | 74.0 MB |
| Events in quadrant A | 2,858,551 | 504,424 |
| Events in quadrant B | 6,851,271 | 460,269 |
| Events in quadrant C | 3,488,995 | 494,146 |
| Events in quadrant D | 4,007,537 | 472,554 |
| Mode M0 | |||
|---|---|---|---|
| Quadrant | BADHDUFLAG | Total packets | Discarded packets |
| A | 0 | 12285 | 3 |
| B | 0 | 24477 | 2 |
| C | 0 | 13789 | 2 |
| D | 0 | 15841 | 2 |
| Mode SS | |||
|---|---|---|---|
| Quadrant | BADHDUFLAG | Total packets | Discarded packets |
| A | 0 | 122 | 0 |
| B | 0 | 122 | 0 |
| C | 0 | 122 | 0 |
| D | 0 | 122 | 0 |
| Mode M9 | |||
|---|---|---|---|
| Quadrant | BADHDUFLAG | Total packets | Discarded packets |
| A | 0 | 34 | 0 |
| B | 0 | 34 | 0 |
| C | 0 | 34 | 0 |
| D | 0 | 34 | 0 |
| Quadrant | Total seconds | Saturated seconds | Saturation percentage |
|---|---|---|---|
| A | 5971 | 8 | 0.133981% |
| B | 5971 | 1301 | 21.788645% |
| C | 5971 | 127 | 2.126947% |
| D | 5971 | 150 | 2.512142% |
Noise dominated data is calculated using 1-second bins in cleaned event files. If a bin has >2000 counts, and if more than 50% of those come from <1% of pixels, then it is considered to be noise-dominated and hence unusable.
| Quadrant | # 1 sec bins | Bins with >0 counts | Bins with >2000 counts | High rate bins dominated by noise | Noise dominated (total time) | Noise dominated (detector-on time) | Marked lightcurve |
|---|---|---|---|---|---|---|---|
| A | 9317 | 5973 | 1 | 1 | 0.01% | 0.02% | 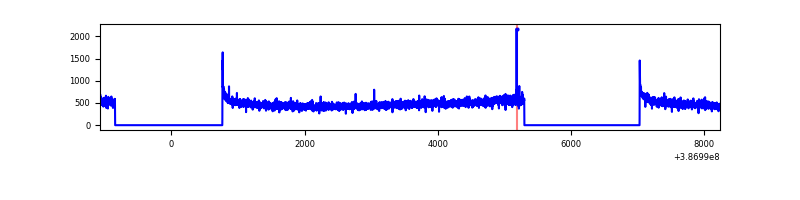 |
| B | 9317 | 5973 | 943 | 943 | 10.12% | 15.79% | 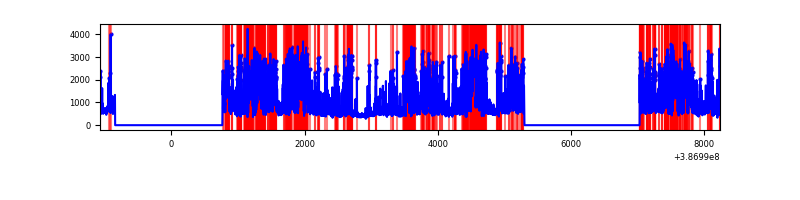 |
| C | 9317 | 5973 | 113 | 113 | 1.21% | 1.89% | 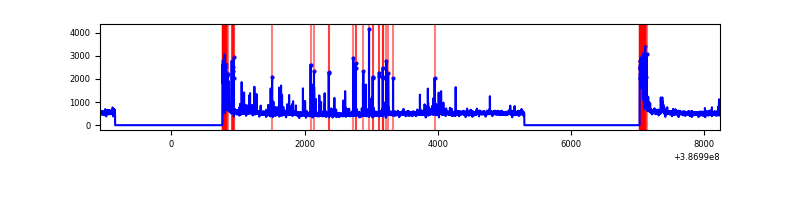 |
| D | 9317 | 5973 | 138 | 138 | 1.48% | 2.31% | 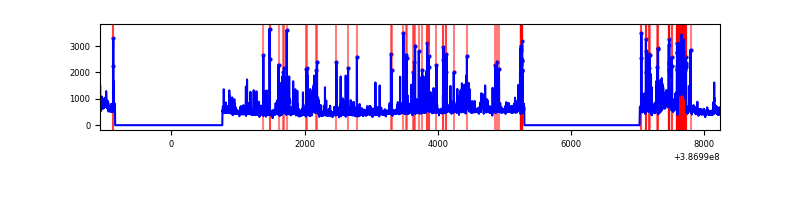 |
Top three noisy pixels from each quadrant. If the there are fewer than three noisy pixels in the level2.evt file, extra rows are filled as -1
| Pixel properties | Quadrant properties | ||||||
|---|---|---|---|---|---|---|---|
| Quadrant | DetID | PixID | Counts | Sigma | Mean | Median | Sigma |
| A | 10 | 83 | 100340 | 703.43 | 706 | 691 | 141.7 |
| A | 13 | 6 | 22068 | 150.9 | 706 | 691 | 141.7 |
| A | 13 | 254 | 10617 | 70.07 | 706 | 691 | 141.7 |
| B | 5 | 236 | 3271560 | 26561.65 | 640 | 623 | 123.1 |
| B | 5 | 172 | 984371 | 7988.53 | 640 | 623 | 123.1 |
| B | 0 | 189 | 35944 | 286.82 | 640 | 623 | 123.1 |
| C | 0 | 10 | 484861 | 3028.55 | 688 | 694 | 159.9 |
| C | 15 | 214 | 248393 | 1549.4 | 688 | 694 | 159.9 |
| C | 9 | 187 | 26873 | 163.75 | 688 | 694 | 159.9 |
| D | 7 | 80 | 522469 | 3102.44 | 689 | 669 | 168.2 |
| D | 2 | 249 | 255851 | 1517.22 | 689 | 669 | 168.2 |
| D | 8 | 195 | 241572 | 1432.32 | 689 | 669 | 168.2 |
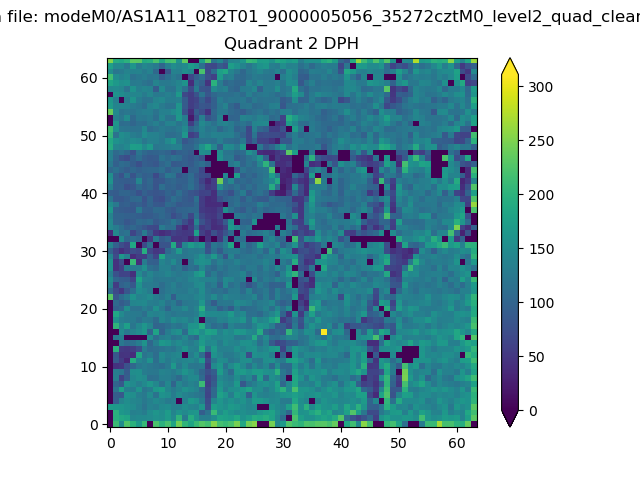
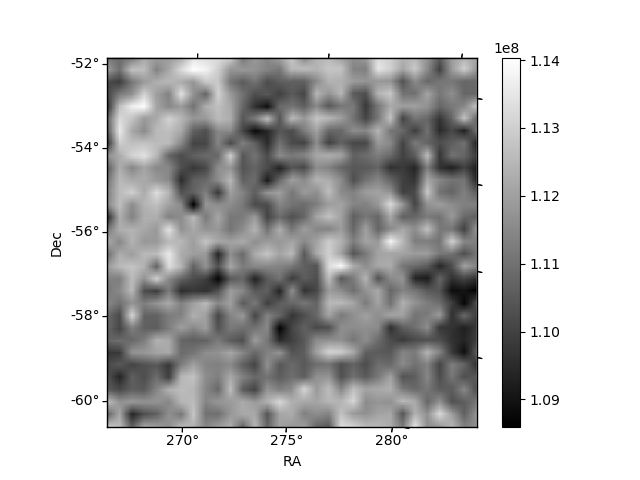
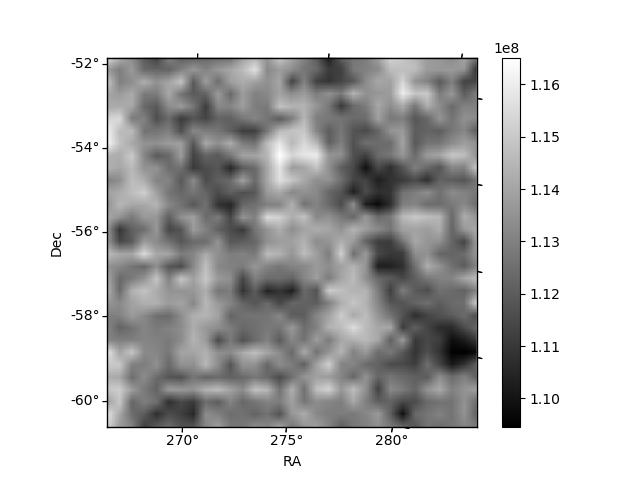
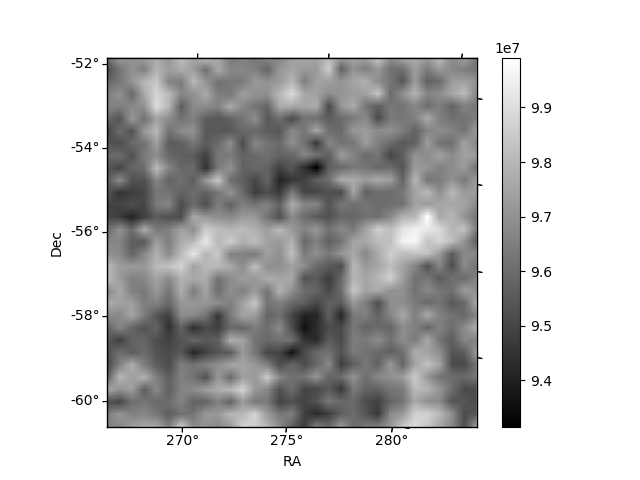
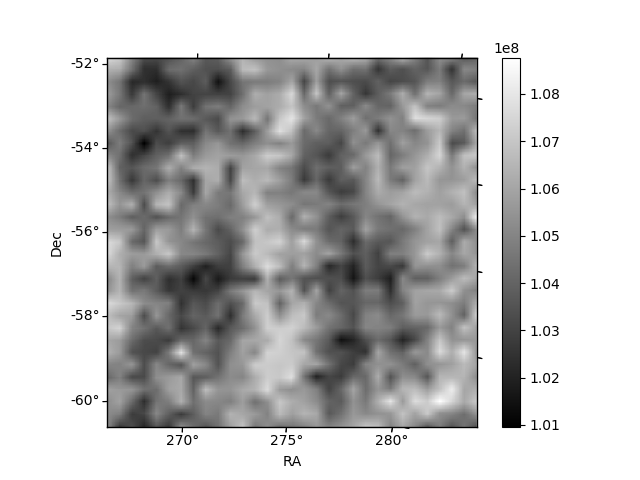
Histogram calculated using DETX and DETY for each event in the final _common_clean file
| Quadrant A | 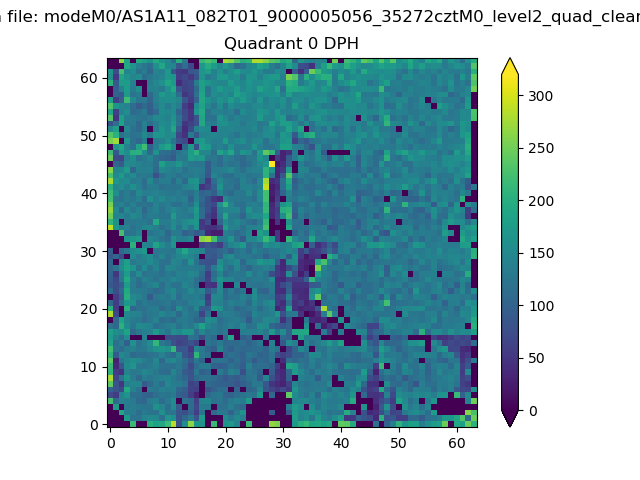 |
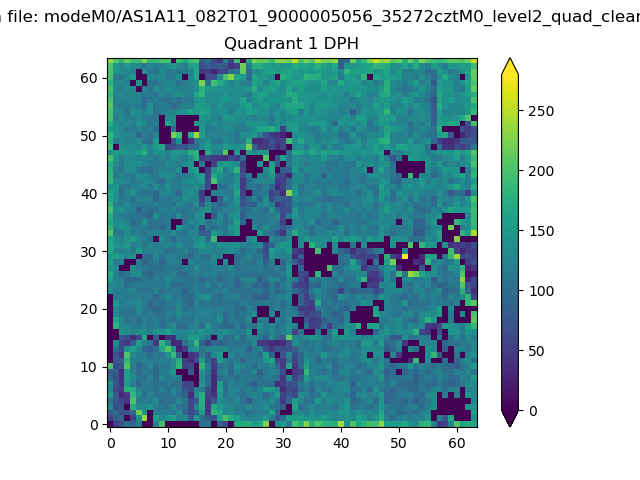 |
Quadrant B |
|---|---|---|---|
| Quadrant D | 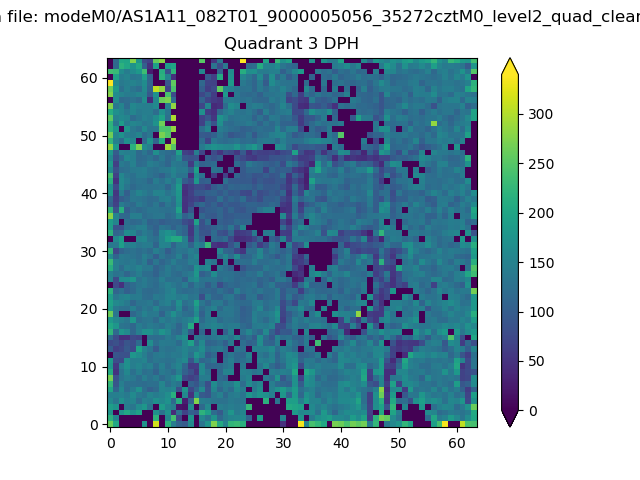 |
 |
Quadrant C |
| Plot type | Count rate plots | Images |
|---|---|---|
| Comparison with Poisson distribution Blue bars denote a histogram of data divided into 1 sec bins. Red curve is a Poisson curve with rate = median count rate of data. |
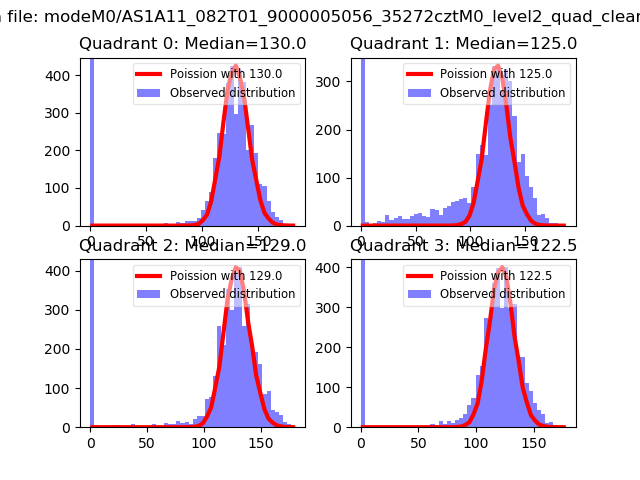 |
 |
| Quadrant-wise count rates Data is divided into 100 sec bins |
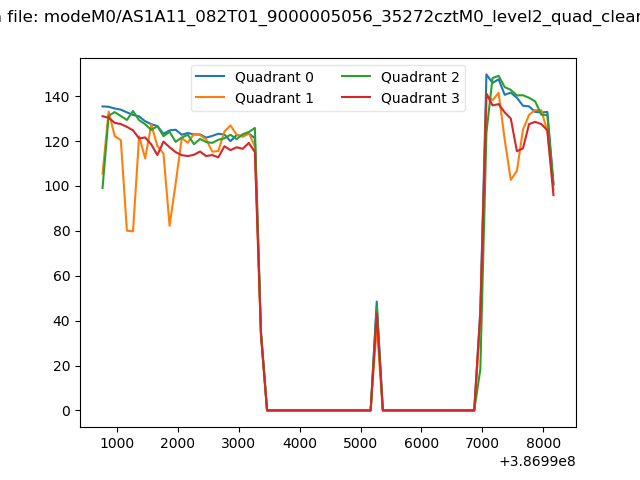 |
|
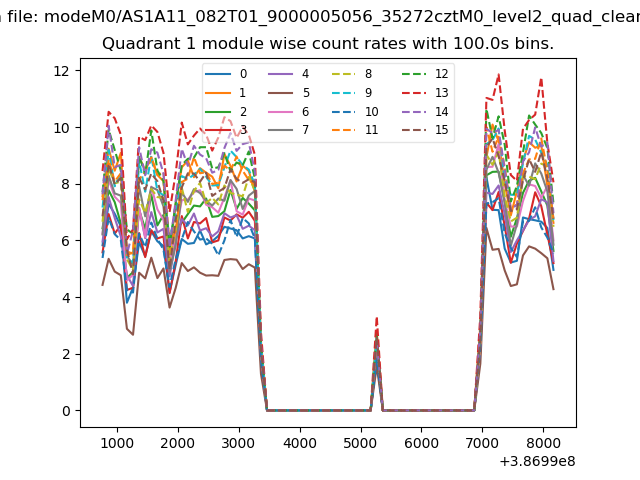
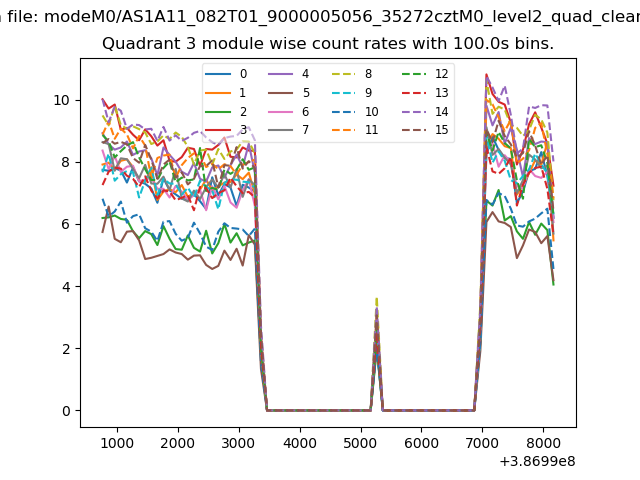
| Module-wise count rates for Quadrant A Data is divided into 100 sec bins |
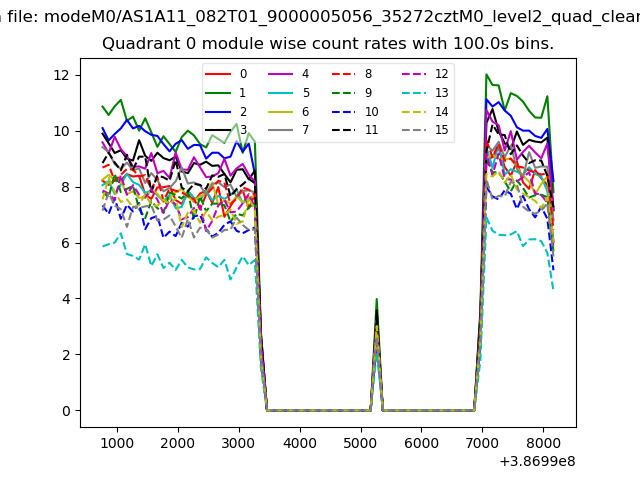 |
 |
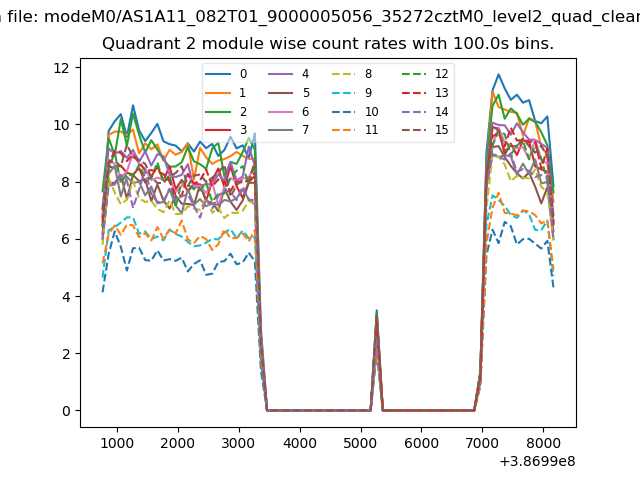
| Module-wise count rates for Quadrant B Data is divided into 100 sec bins |
 |
 |
| Module-wise count rates for Quadrant C Data is divided into 100 sec bins |
 |
 |
| Module-wise count rates for Quadrant D Data is divided into 100 sec bins |
 |
 |
| Parameter | Plot |
|---|---|
| CZT HV Monitor | 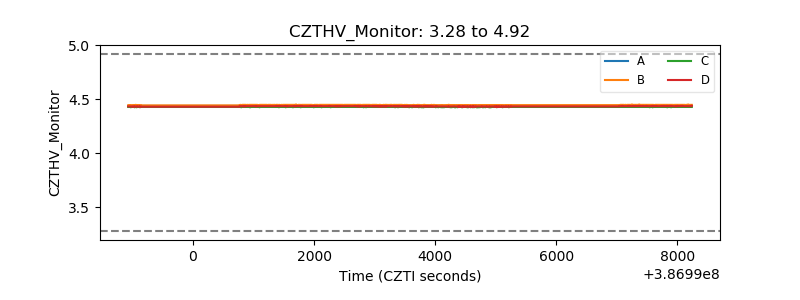 |
| D_VDD | 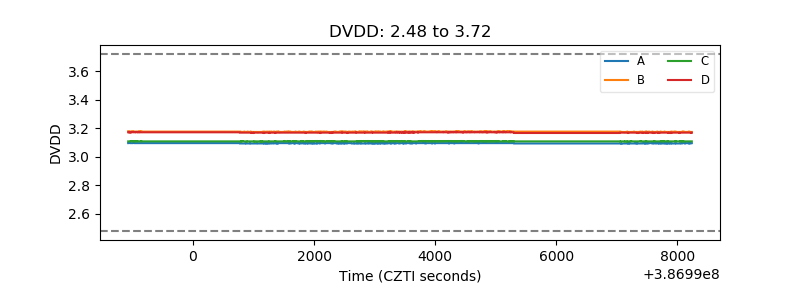 |
| Temperature 1 | 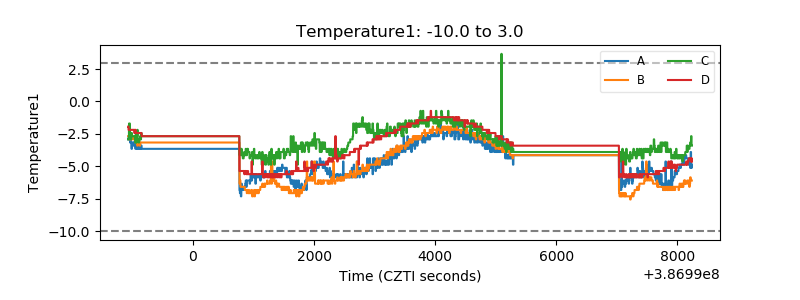 |
| Veto HV Monitor | 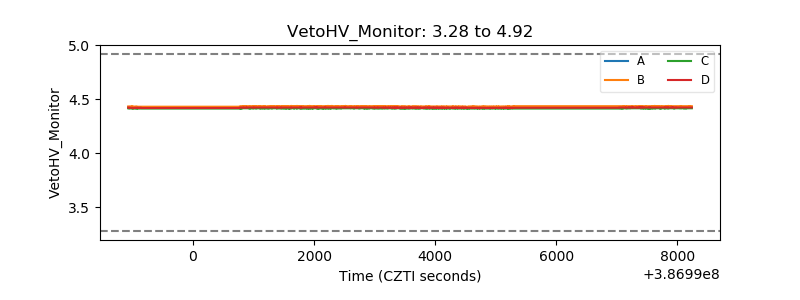 |
| Veto LLD | 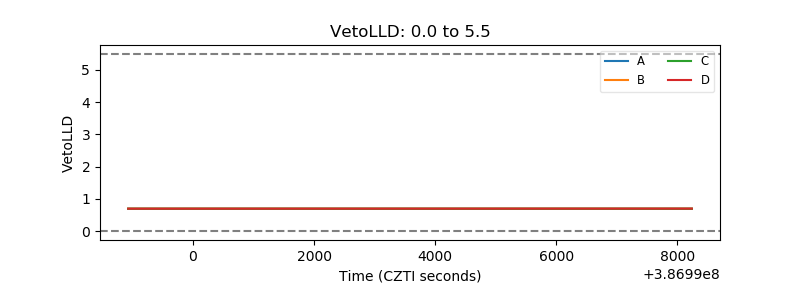 |
| Alpha Counter | 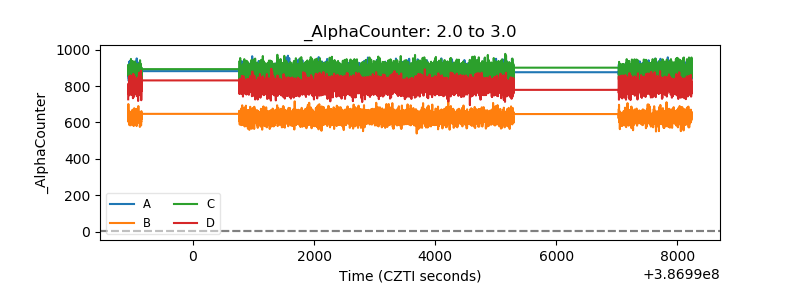 |
| _CPM_Rate | 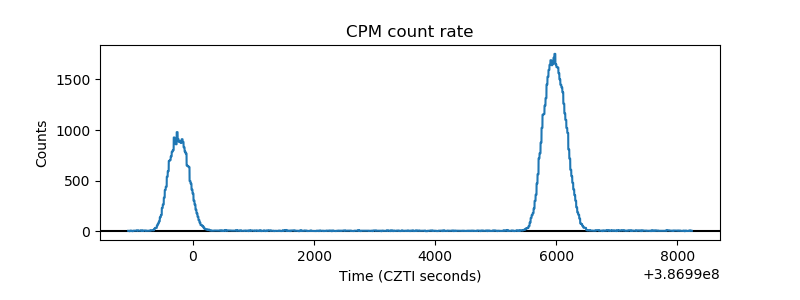 |
| CZT Counter | 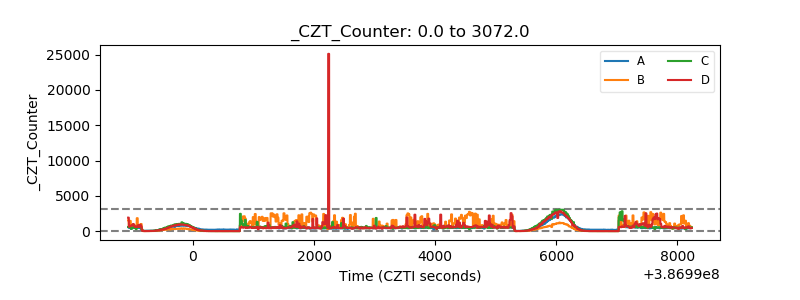 |
| +2.5 Volts monitor | 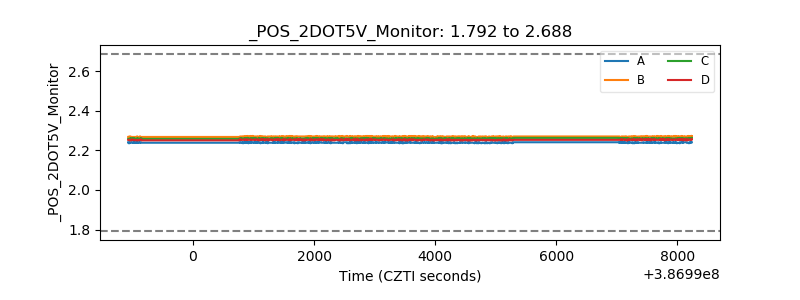 |
| +5 Volts monitor | 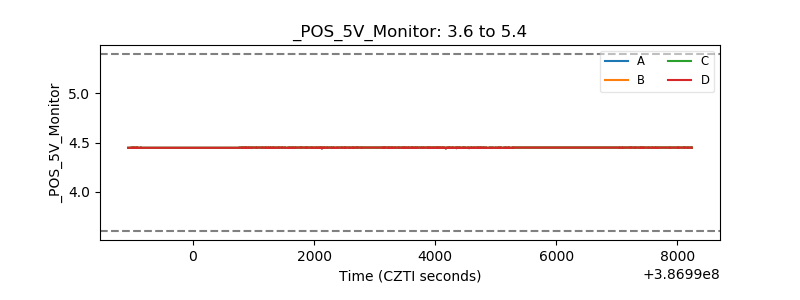 |
| _ROLL_ROT | 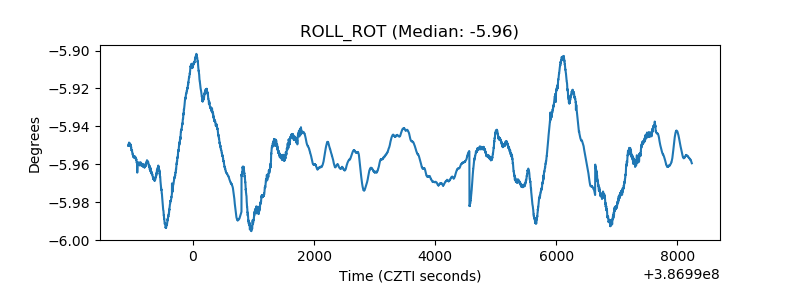 |
| _Roll_DEC | 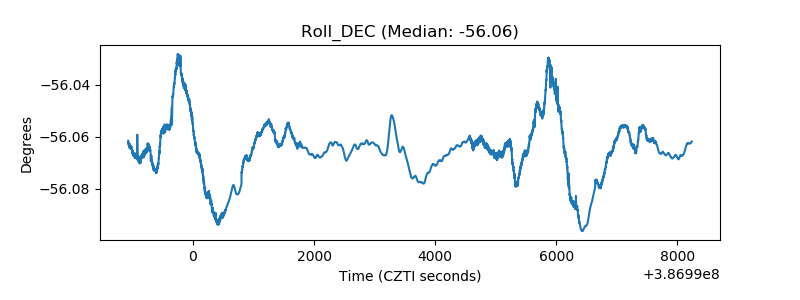 |
| _Roll_RA | 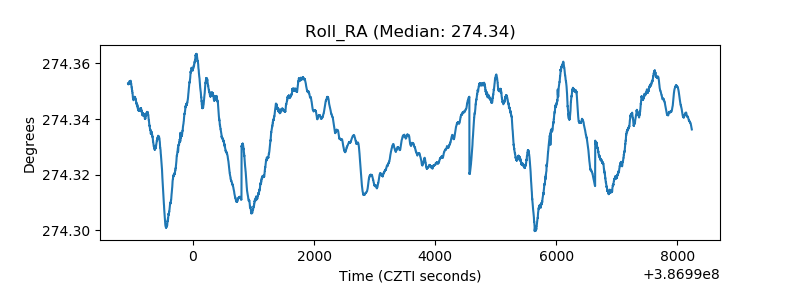 |
| Veto Counter | 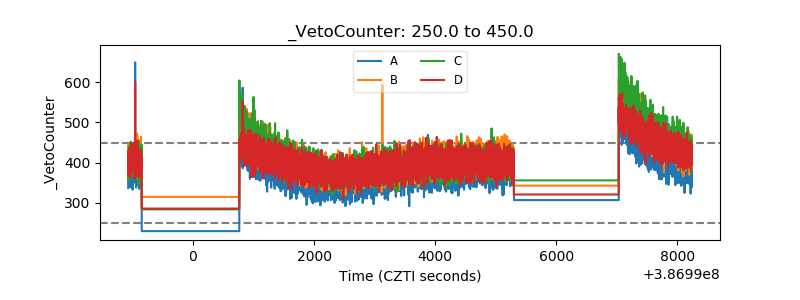 |