| Param | Original file | Final file |
|---|---|---|
| Filename | modeM0/AS1A11_082T01_9000005056_35270cztM0_level2.evt | modeM0/AS1A11_082T01_9000005056_35270cztM0_level2_quad_clean.evt |
| Size (bytes) | 931,112,640 | 143,046,720 |
| Size | 888.0 MB | 136.4 MB |
| Events in quadrant A | 4,258,855 | 981,298 |
| Events in quadrant B | 8,378,170 | 928,502 |
| Events in quadrant C | 5,134,027 | 952,537 |
| Events in quadrant D | 9,827,456 | 851,396 |
| Mode M0 | |||
|---|---|---|---|
| Quadrant | BADHDUFLAG | Total packets | Discarded packets |
| A | 0 | 18575 | 3 |
| B | 0 | 30954 | 2 |
| C | 0 | 20644 | 2 |
| D | 0 | 35310 | 2 |
| Mode SS | |||
|---|---|---|---|
| Quadrant | BADHDUFLAG | Total packets | Discarded packets |
| A | 0 | 182 | 0 |
| B | 0 | 182 | 0 |
| C | 0 | 182 | 0 |
| D | 0 | 182 | 0 |
| Mode M9 | |||
|---|---|---|---|
| Quadrant | BADHDUFLAG | Total packets | Discarded packets |
| A | 0 | 26 | 0 |
| B | 0 | 26 | 0 |
| C | 0 | 26 | 0 |
| D | 0 | 26 | 0 |
| Quadrant | Total seconds | Saturated seconds | Saturation percentage |
|---|---|---|---|
| A | 8900 | 27 | 0.303371% |
| B | 8900 | 1205 | 13.539326% |
| C | 8900 | 149 | 1.674157% |
| D | 8900 | 1491 | 16.752809% |
Noise dominated data is calculated using 1-second bins in cleaned event files. If a bin has >2000 counts, and if more than 50% of those come from <1% of pixels, then it is considered to be noise-dominated and hence unusable.
| Quadrant | # 1 sec bins | Bins with >0 counts | Bins with >2000 counts | High rate bins dominated by noise | Noise dominated (total time) | Noise dominated (detector-on time) | Marked lightcurve |
|---|---|---|---|---|---|---|---|
| A | 11527 | 8902 | 16 | 16 | 0.14% | 0.18% | 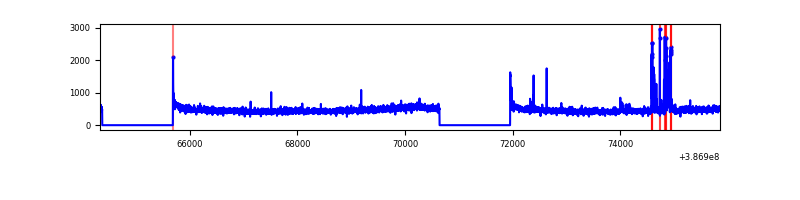 |
| B | 11527 | 8902 | 827 | 827 | 7.17% | 9.29% | 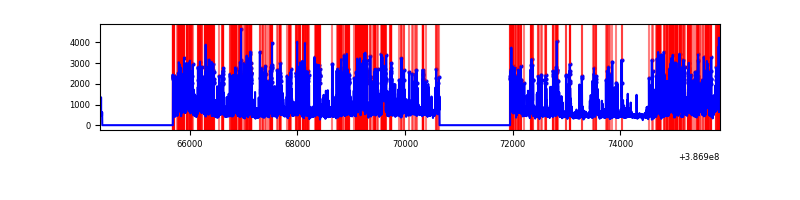 |
| C | 11527 | 8902 | 118 | 118 | 1.02% | 1.33% | 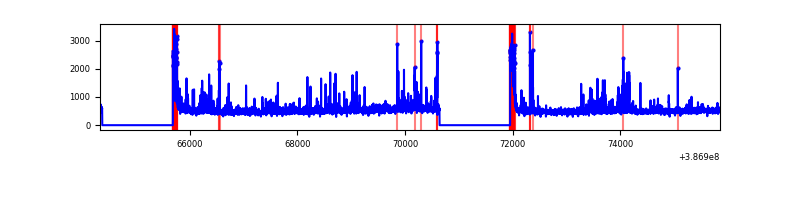 |
| D | 11527 | 8902 | 1451 | 1451 | 12.59% | 16.30% | 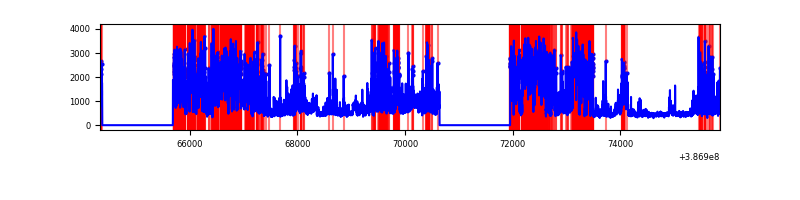 |
Top three noisy pixels from each quadrant. If the there are fewer than three noisy pixels in the level2.evt file, extra rows are filled as -1
| Pixel properties | Quadrant properties | ||||||
|---|---|---|---|---|---|---|---|
| Quadrant | DetID | PixID | Counts | Sigma | Mean | Median | Sigma |
| A | 9 | 143 | 170840 | 832.32 | 1016 | 994 | 204.1 |
| A | 10 | 83 | 121981 | 592.89 | 1016 | 994 | 204.1 |
| A | 13 | 6 | 17321 | 80.01 | 1016 | 994 | 204.1 |
| B | 5 | 236 | 3528405 | 19047.02 | 962 | 935 | 185.2 |
| B | 5 | 172 | 866360 | 4672.97 | 962 | 935 | 185.2 |
| B | 4 | 232 | 130348 | 698.78 | 962 | 935 | 185.2 |
| C | 0 | 10 | 584939 | 2549.88 | 987 | 995 | 229.0 |
| C | 15 | 214 | 366126 | 1594.4 | 987 | 995 | 229.0 |
| C | 15 | 208 | 172324 | 748.13 | 987 | 995 | 229.0 |
| D | 12 | 227 | 3169156 | 13962.7 | 932 | 907 | 226.9 |
| D | 2 | 249 | 1653885 | 7284.79 | 932 | 907 | 226.9 |
| D | 10 | 118 | 484258 | 2130.16 | 932 | 907 | 226.9 |
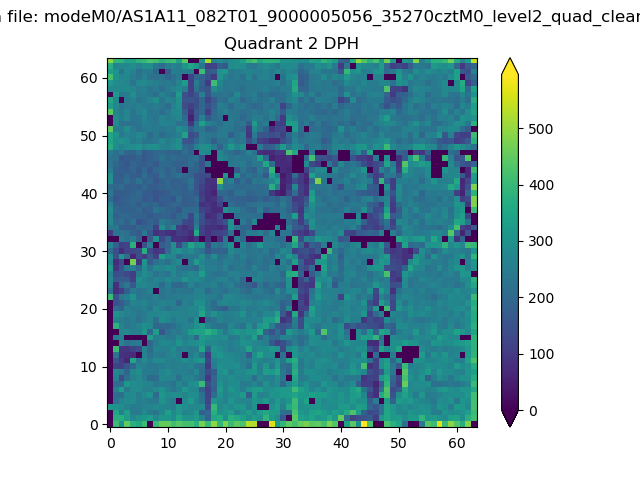
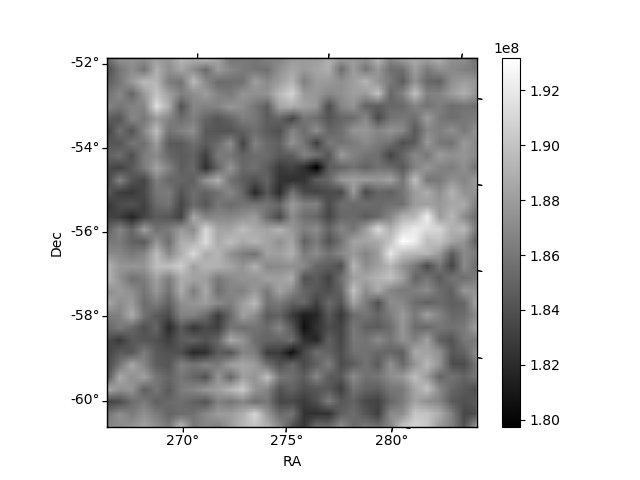
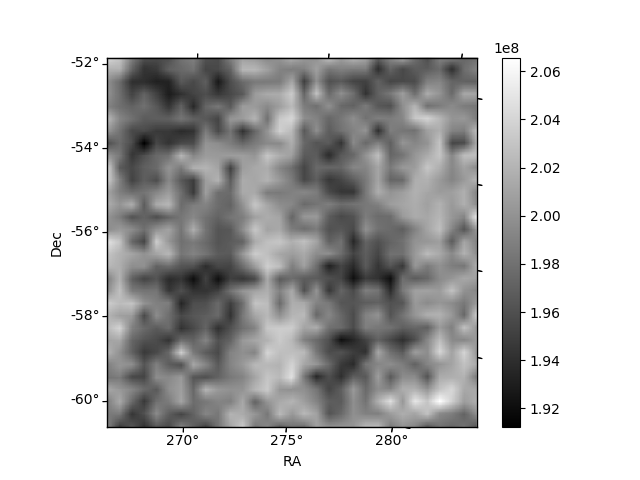
Histogram calculated using DETX and DETY for each event in the final _common_clean file
| Quadrant A | 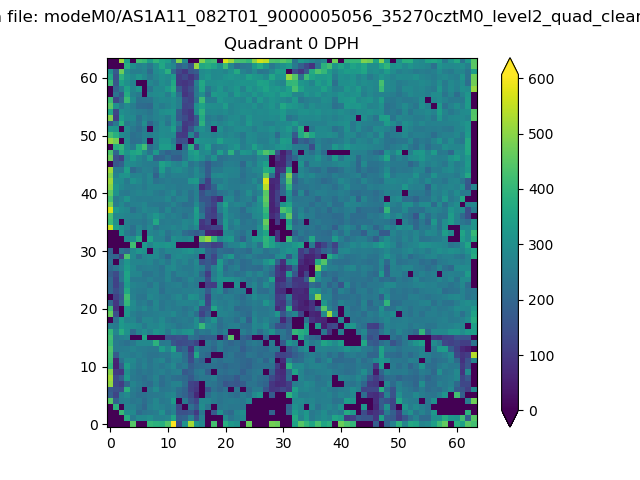 |
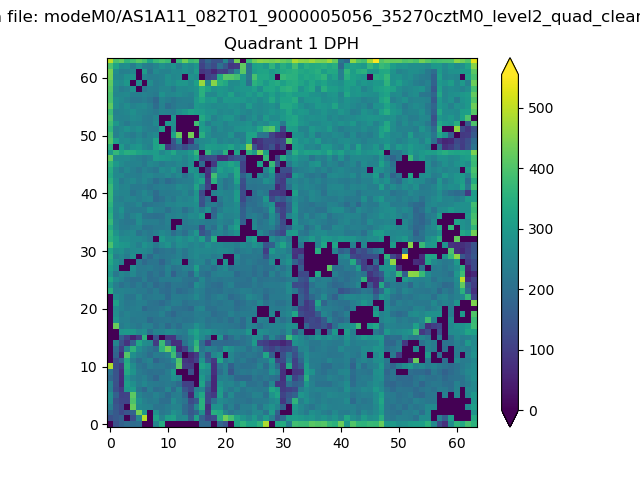 |
Quadrant B |
|---|---|---|---|
| Quadrant D | 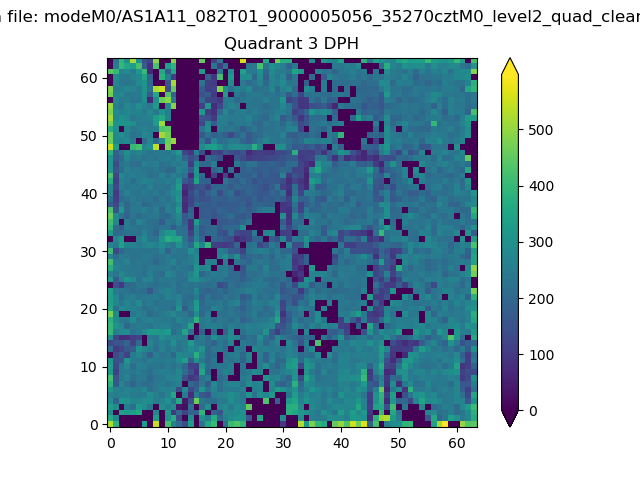 |
 |
Quadrant C |
| Plot type | Count rate plots | Images |
|---|---|---|
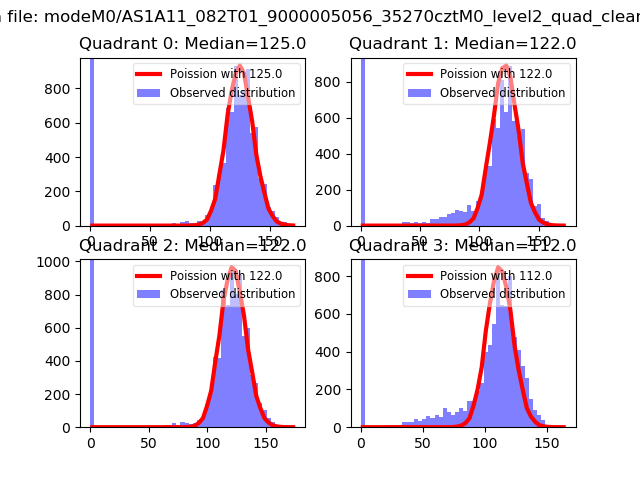
| Comparison with Poisson distribution Blue bars denote a histogram of data divided into 1 sec bins. Red curve is a Poisson curve with rate = median count rate of data. |
 |
 |
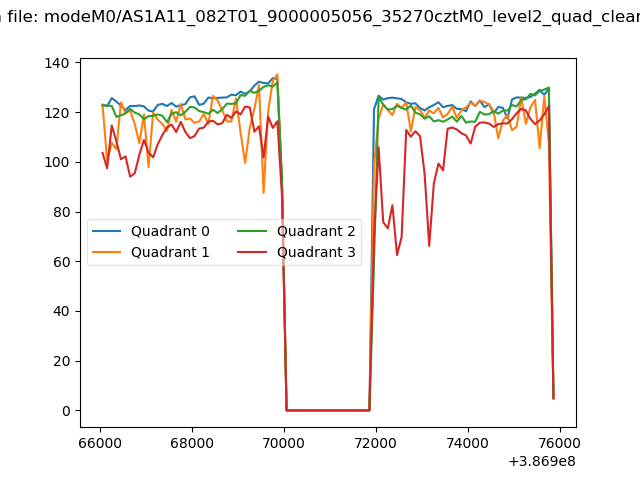
| Quadrant-wise count rates Data is divided into 100 sec bins |
 |
|
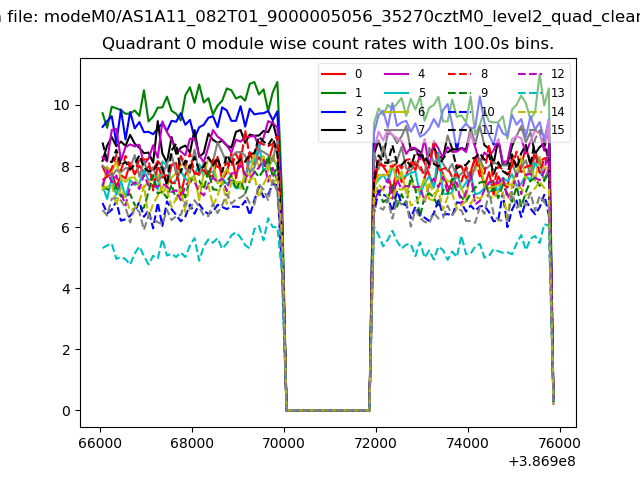
| Module-wise count rates for Quadrant A Data is divided into 100 sec bins |
 |
 |
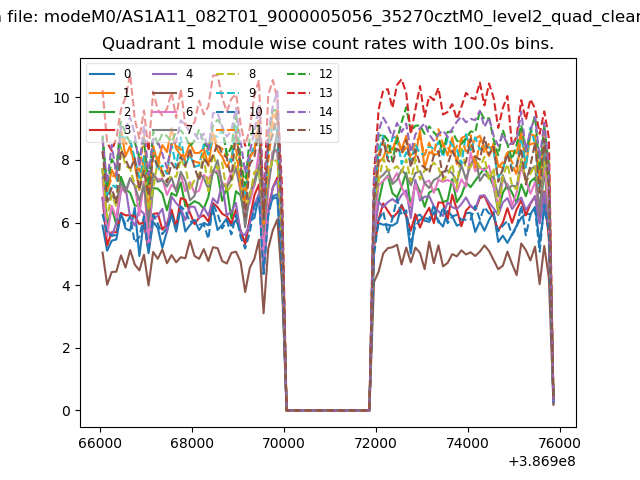
| Module-wise count rates for Quadrant B Data is divided into 100 sec bins |
 |
 |
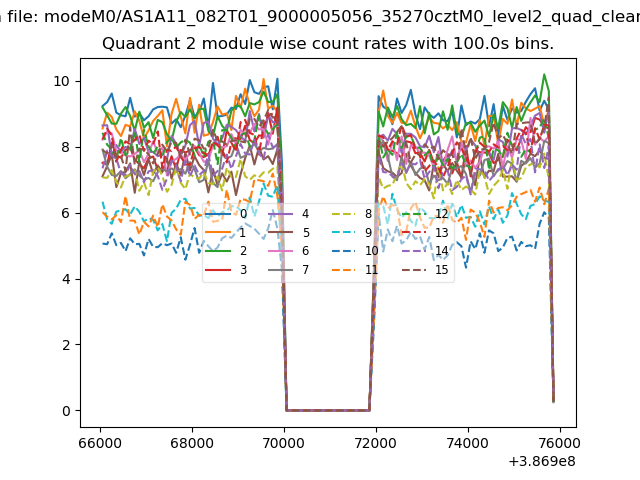
| Module-wise count rates for Quadrant C Data is divided into 100 sec bins |
 |
 |
| Module-wise count rates for Quadrant D Data is divided into 100 sec bins |
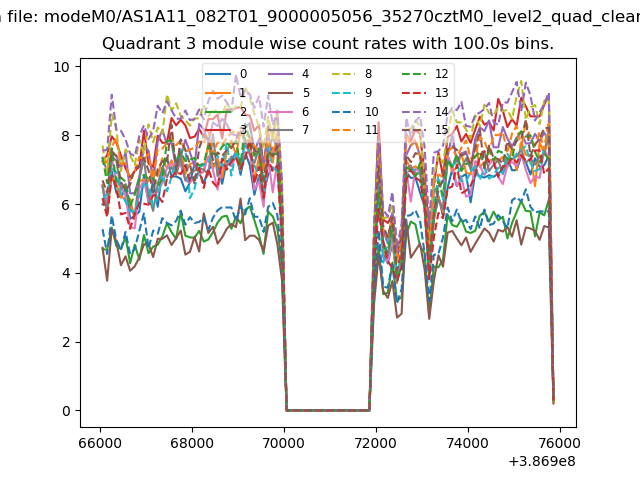 |
 |
| Parameter | Plot |
|---|---|
| CZT HV Monitor | 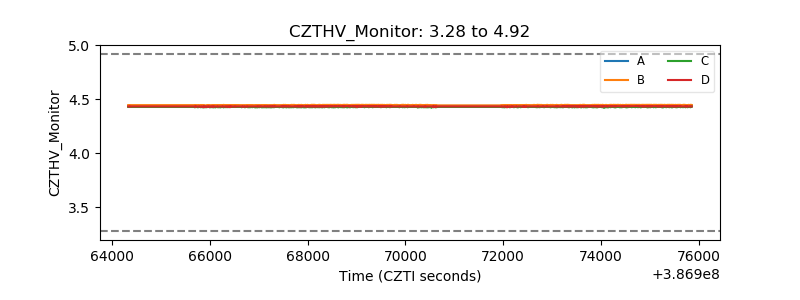 |
| D_VDD | 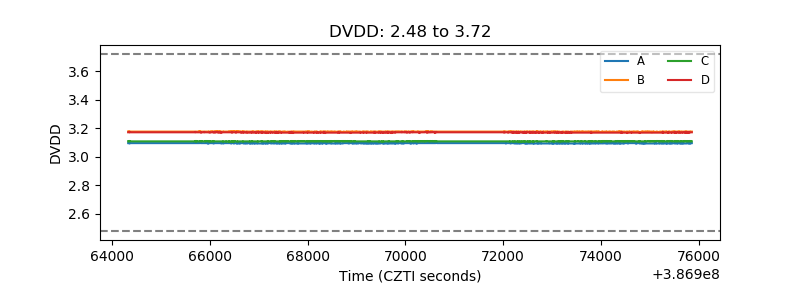 |
| Temperature 1 | 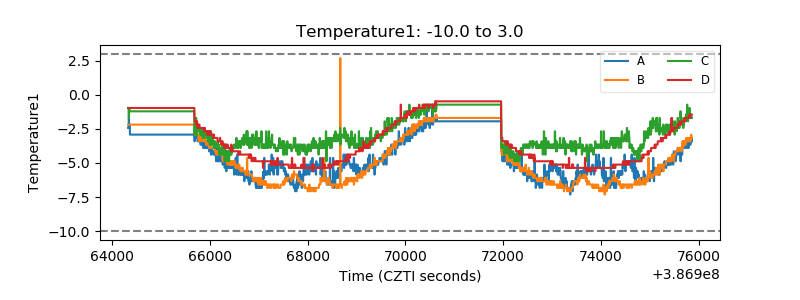 |
| Veto HV Monitor | 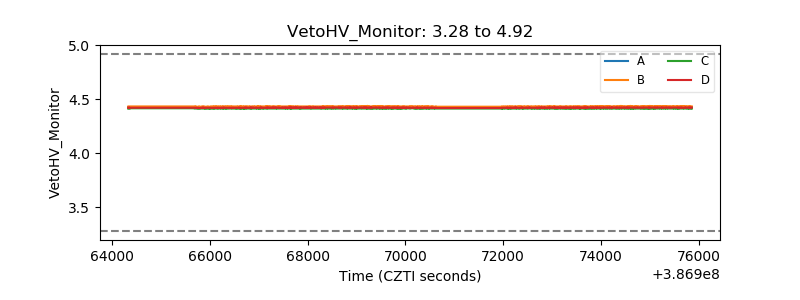 |
| Veto LLD | 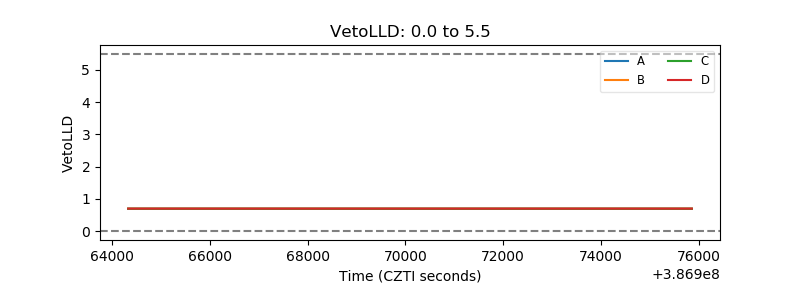 |
| Alpha Counter | 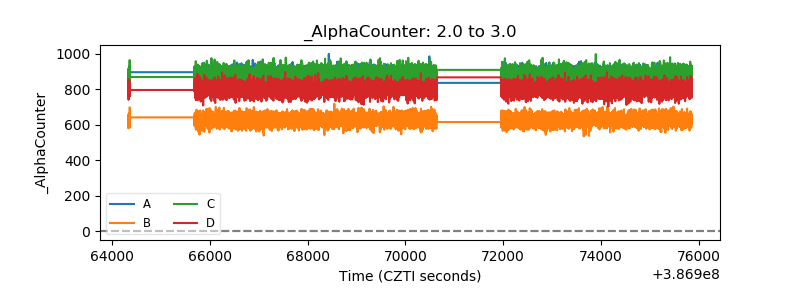 |
| _CPM_Rate | 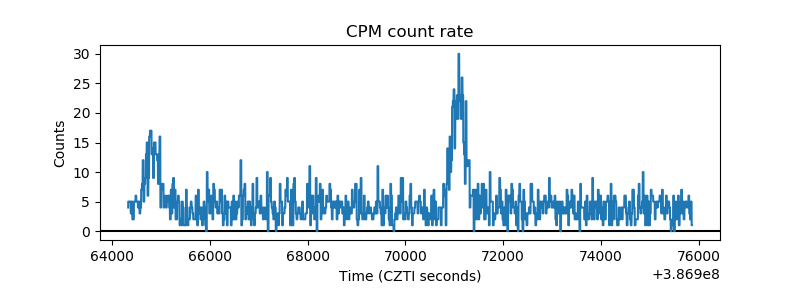 |
| CZT Counter |  |
| +2.5 Volts monitor | 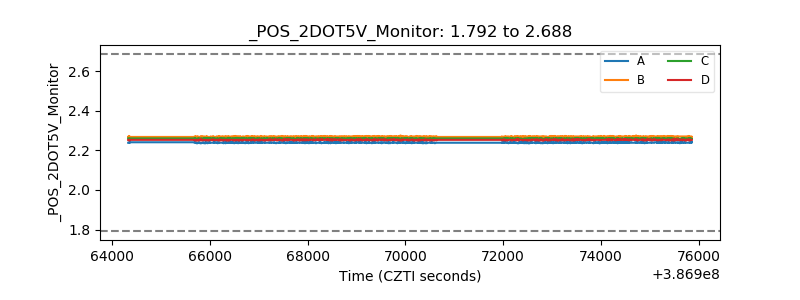 |
| +5 Volts monitor | 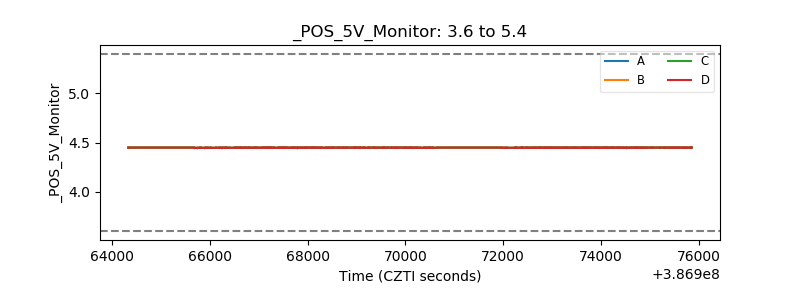 |
| _ROLL_ROT | 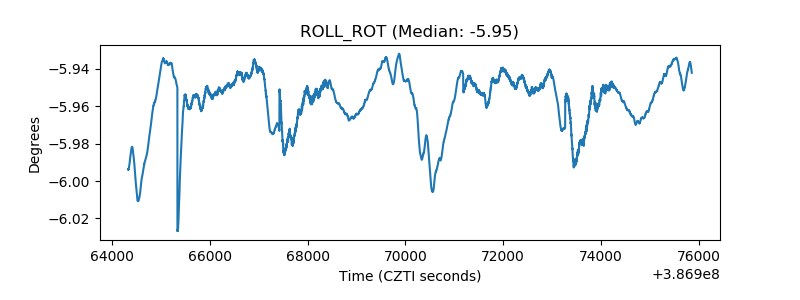 |
| _Roll_DEC | 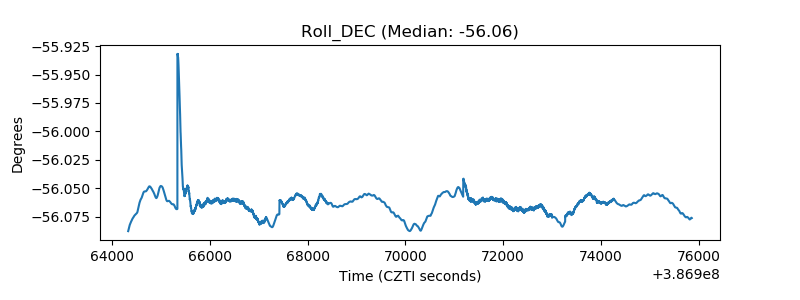 |
| _Roll_RA | 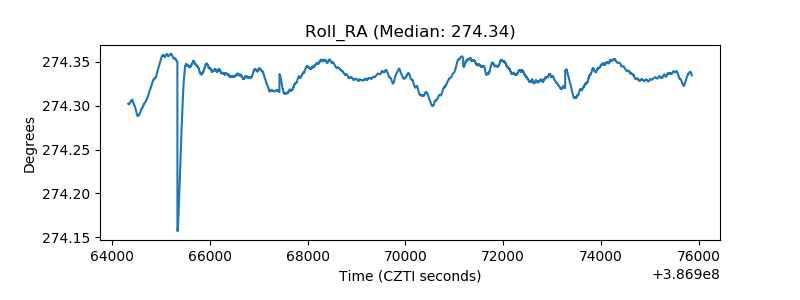 |
| Veto Counter | 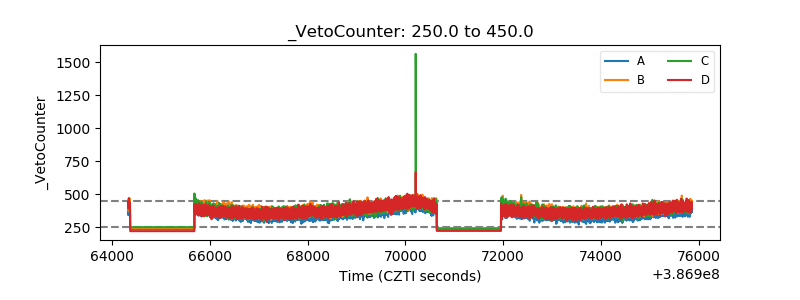 |