| Param | Original file | Final file |
|---|---|---|
| Filename | modeM0/AS1A11_082T01_9000005056cztM0_level2_bc.evt | modeM0/AS1A11_082T01_9000005056cztM0_level2_quad_clean.evt |
| Size (bytes) | 9,231,166,080 | 1,891,742,400 |
| Size | 8.6 GB | 1.8 GB |
| Events in quadrant A | 32,939,780 | 12,663,235 |
| Events in quadrant B | 105,764,969 | 11,155,909 |
| Events in quadrant C | 55,052,139 | 12,298,099 |
| Events in quadrant D | 76,037,949 | 11,311,905 |
| Mode M0 | |||
|---|---|---|---|
| Quadrant | BADHDUFLAG | Total packets | Discarded packets |
| A | 0 | 299654 | 0 |
| B | 0 | 655863 | 0 |
| C | 0 | 369170 | 0 |
| D | 0 | 472342 | 0 |
| Mode SS | |||
|---|---|---|---|
| Quadrant | BADHDUFLAG | Total packets | Discarded packets |
| A | 0 | 2936 | 0 |
| B | 0 | 2936 | 0 |
| C | 0 | 2936 | 0 |
| D | 0 | 2936 | 0 |
| Mode M9 | |||
|---|---|---|---|
| Quadrant | BADHDUFLAG | Total packets | Discarded packets |
| A | 0 | 519 | 0 |
| B | 0 | 519 | 0 |
| C | 0 | 519 | 0 |
| D | 0 | 520 | 0 |
| Quadrant | Total seconds | Saturated seconds | Saturation percentage |
|---|---|---|---|
| A | 143869 | 312 | 0.216864% |
| B | 143869 | 44187 | 30.713357% |
| C | 143869 | 3880 | 2.696898% |
| D | 143869 | 16224 | 11.276926% |
Noise dominated data is calculated using 1-second bins in cleaned event files. If a bin has >2000 counts, and if more than 50% of those come from <1% of pixels, then it is considered to be noise-dominated and hence unusable.
| Quadrant | # 1 sec bins | Bins with >0 counts | Bins with >2000 counts | High rate bins dominated by noise | Noise dominated (total time) | Noise dominated (detector-on time) | Marked lightcurve |
|---|---|---|---|---|---|---|---|
| A | 200535 | 143899 | 30 | 30 | 0.01% | 0.02% | 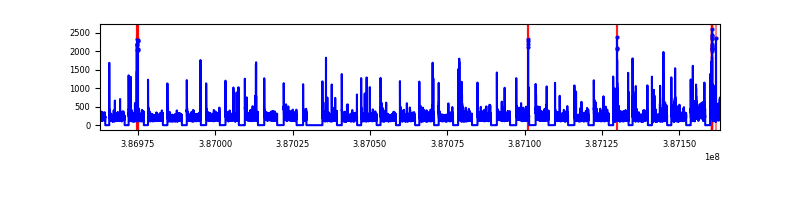 |
| B | 200535 | 143786 | 1137 | 1137 | 0.57% | 0.79% | 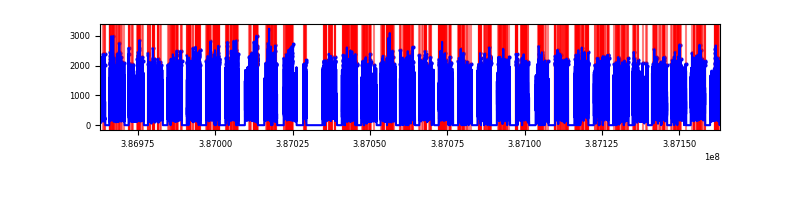 |
| C | 200535 | 143860 | 1186 | 1186 | 0.59% | 0.82% | 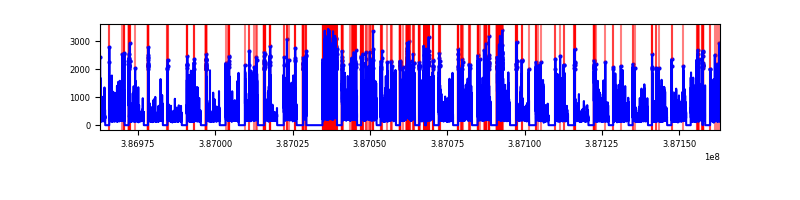 |
| D | 200535 | 143829 | 3382 | 3382 | 1.69% | 2.35% |  |
Top three noisy pixels from each quadrant. If the there are fewer than three noisy pixels in the level2.evt file, extra rows are filled as -1
| Pixel properties | Quadrant properties | ||||||
|---|---|---|---|---|---|---|---|
| Quadrant | DetID | PixID | Counts | Sigma | Mean | Median | Sigma |
| A | 10 | 83 | 1885760 | 1146.96 | 7484 | 7382 | 1637.7 |
| A | 15 | 169 | 1033216 | 626.38 | 7484 | 7382 | 1637.7 |
| A | 13 | 6 | 314524 | 187.54 | 7484 | 7382 | 1637.7 |
| B | 5 | 236 | 43870326 | 34393.51 | 6429 | 6298 | 1275.4 |
| B | 5 | 172 | 34901846 | 27361.38 | 6429 | 6298 | 1275.4 |
| B | 4 | 232 | 613411 | 476.03 | 6429 | 6298 | 1275.4 |
| C | 0 | 10 | 10511739 | 6297.93 | 7263 | 7215 | 1667.9 |
| C | 4 | 254 | 6517290 | 3903.08 | 7263 | 7215 | 1667.9 |
| C | 15 | 214 | 5554794 | 3326.02 | 7263 | 7215 | 1667.9 |
| D | 7 | 80 | 18468066 | 11045.99 | 7013 | 6799 | 1671.3 |
| D | 2 | 249 | 6662599 | 3982.39 | 7013 | 6799 | 1671.3 |
| D | 8 | 195 | 4678068 | 2794.98 | 7013 | 6799 | 1671.3 |
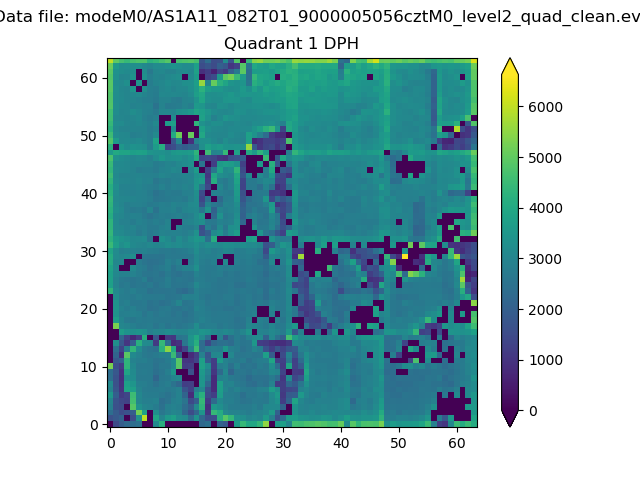
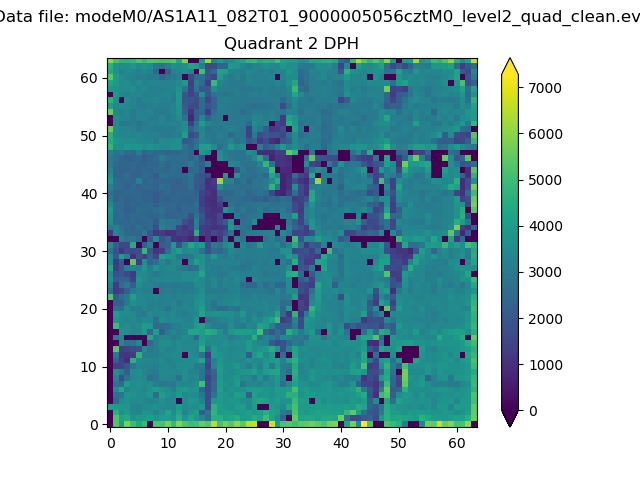
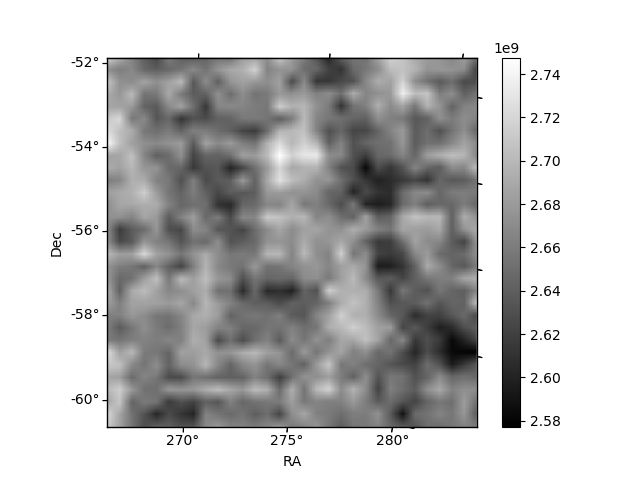
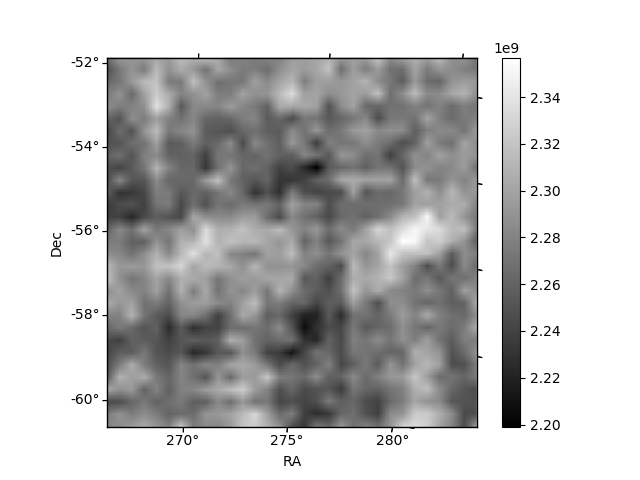
Histogram calculated using DETX and DETY for each event in the final _common_clean file
| Quadrant A | 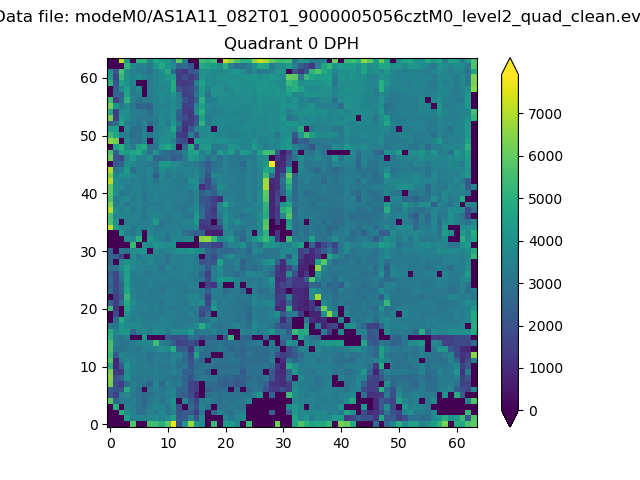 |
 |
Quadrant B |
|---|---|---|---|
| Quadrant D | 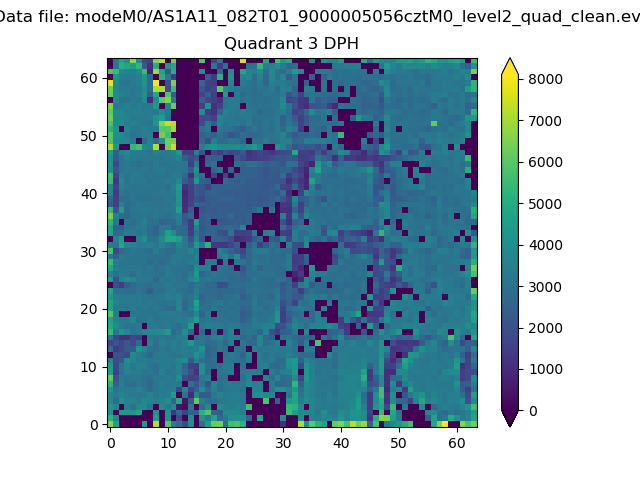 |
 |
Quadrant C |
| Plot type | Count rate plots | Images |
|---|---|---|
| Comparison with Poisson distribution Blue bars denote a histogram of data divided into 1 sec bins. Red curve is a Poisson curve with rate = median count rate of data. |
 |
 |
| Quadrant-wise count rates Data is divided into 100 sec bins |
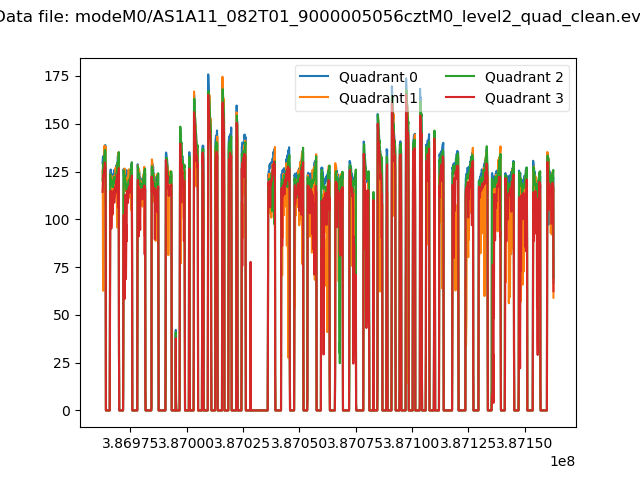 |
|
| Module-wise count rates for Quadrant A Data is divided into 100 sec bins |
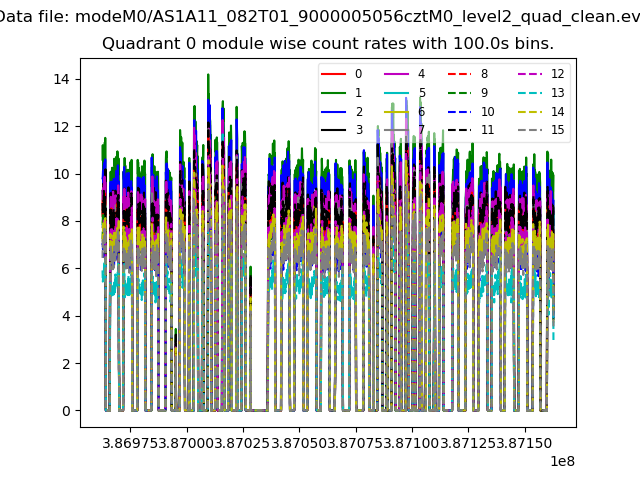 |
 |
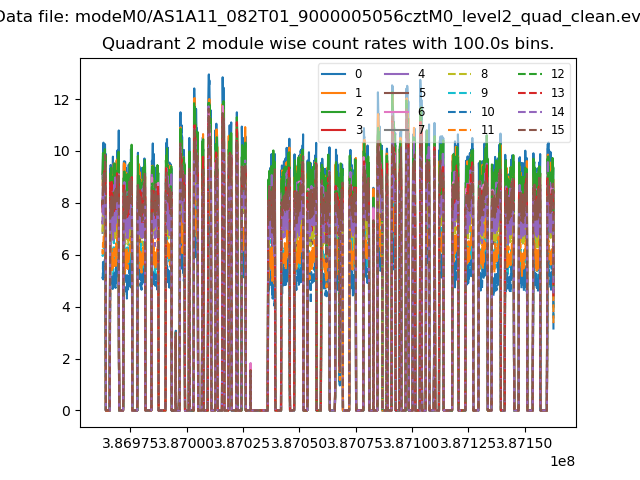
| Module-wise count rates for Quadrant B Data is divided into 100 sec bins |
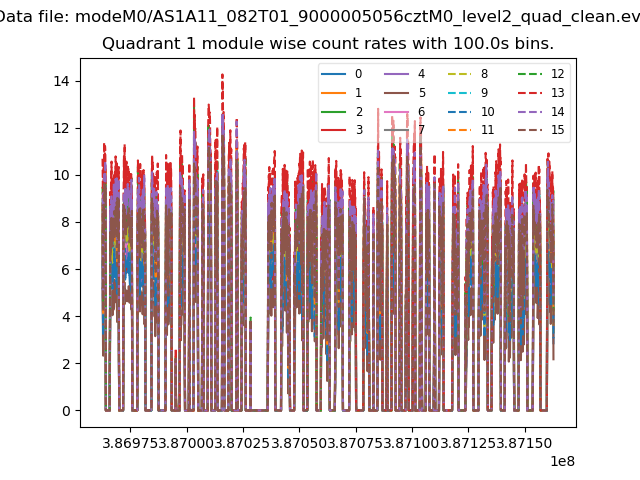 |
 |
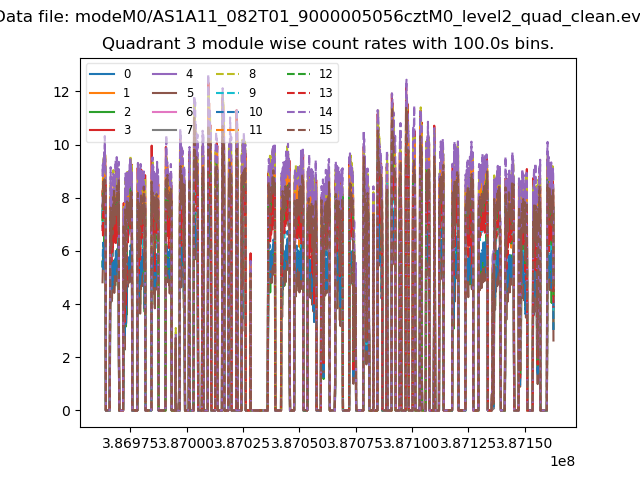
| Module-wise count rates for Quadrant C Data is divided into 100 sec bins |
 |
 |
| Module-wise count rates for Quadrant D Data is divided into 100 sec bins |
 |
 |
| Parameter | Plot |
|---|---|
| CZT HV Monitor | 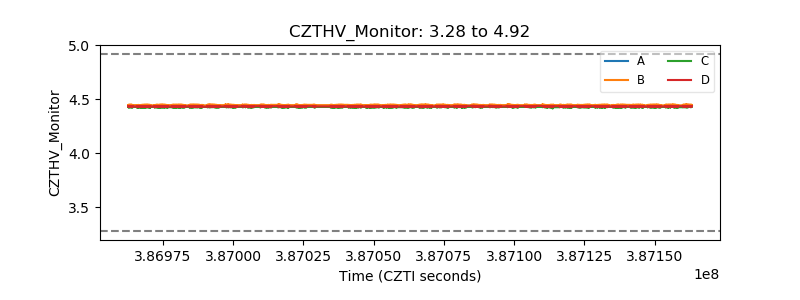 |
| D_VDD | 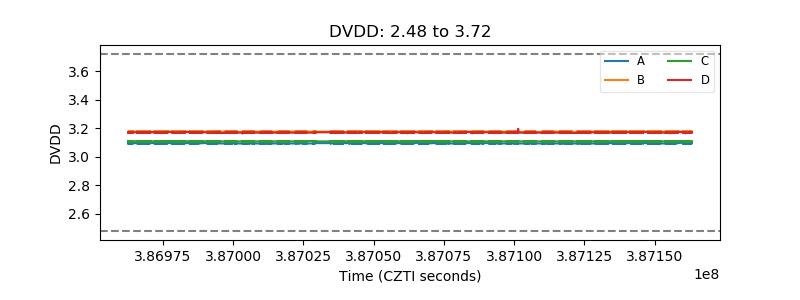 |
| Temperature 1 | 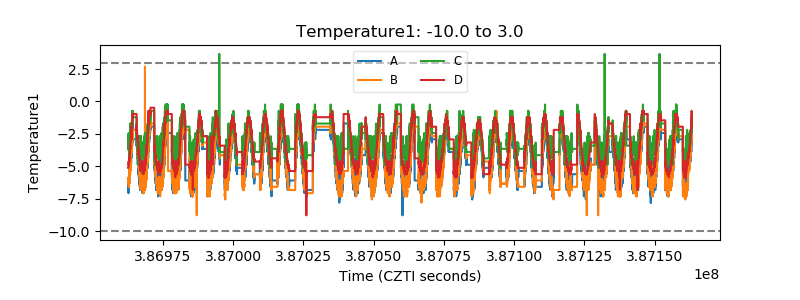 |
| Veto HV Monitor | 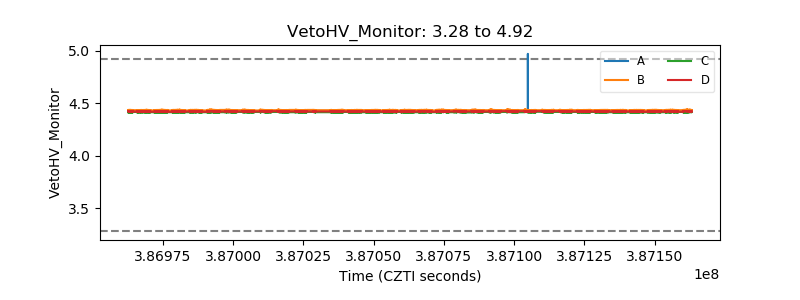 |
| Veto LLD | 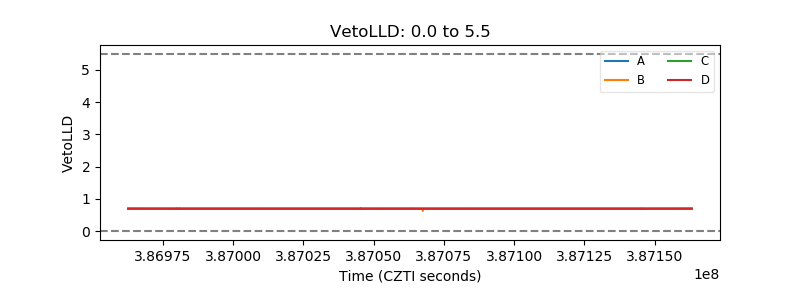 |
| Alpha Counter | 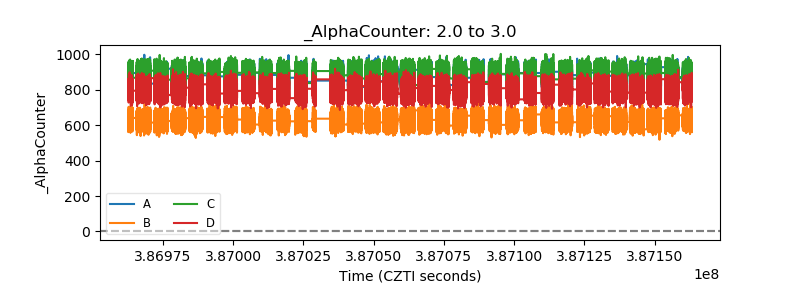 |
| _CPM_Rate | 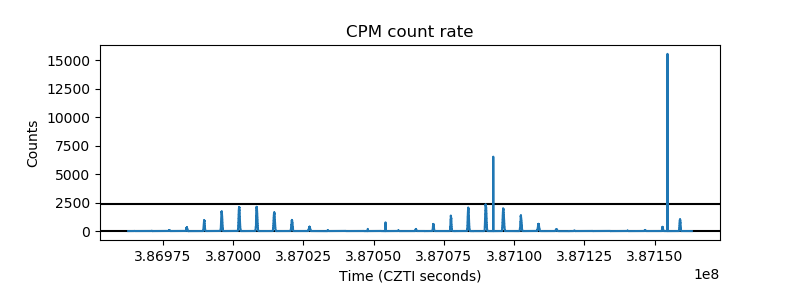 |
| CZT Counter | 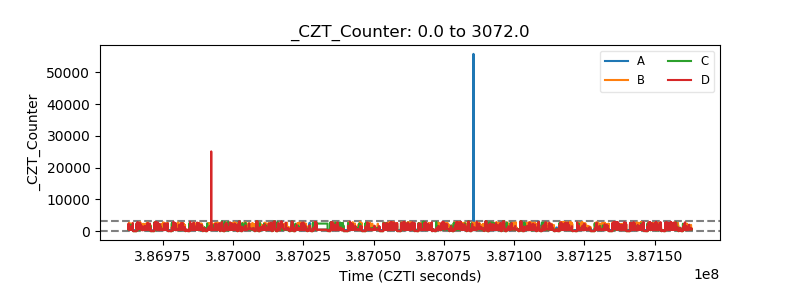 |
| +2.5 Volts monitor | 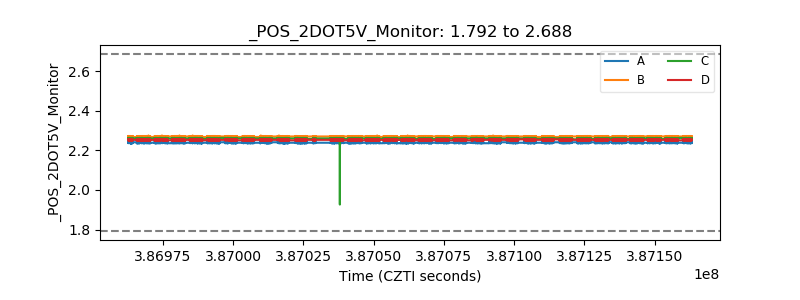 |
| +5 Volts monitor | 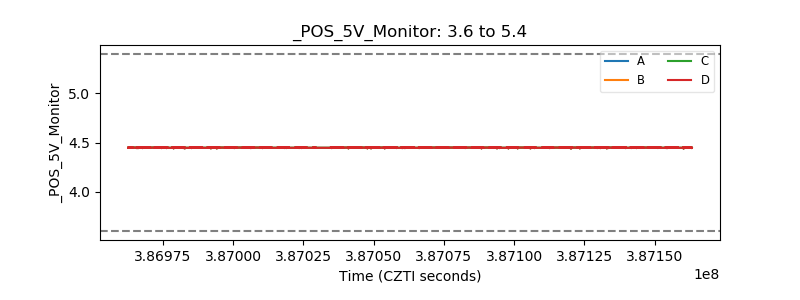 |
| _ROLL_ROT | 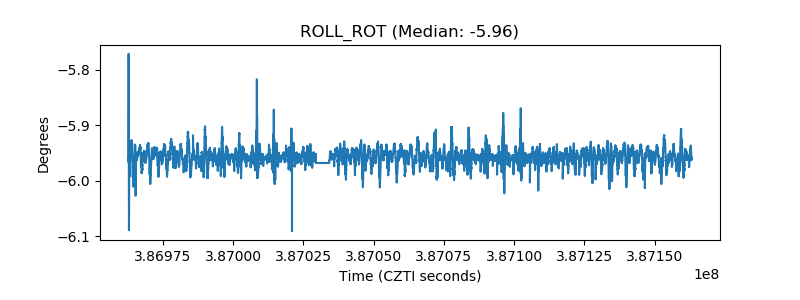 |
| _Roll_DEC | 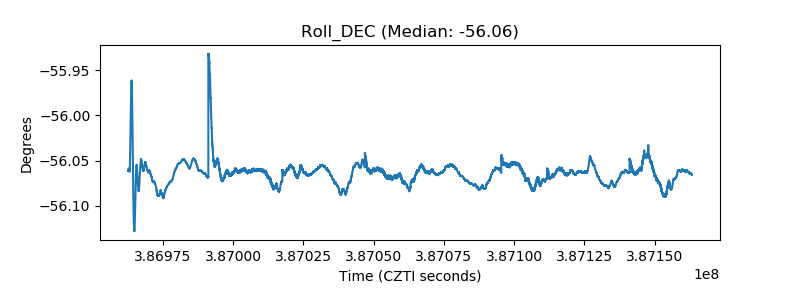 |
| _Roll_RA | 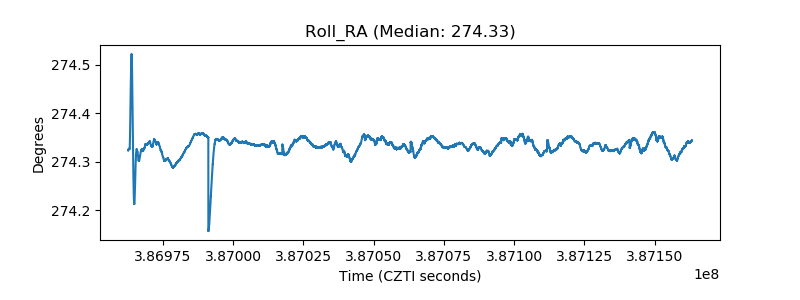 |
| Veto Counter | 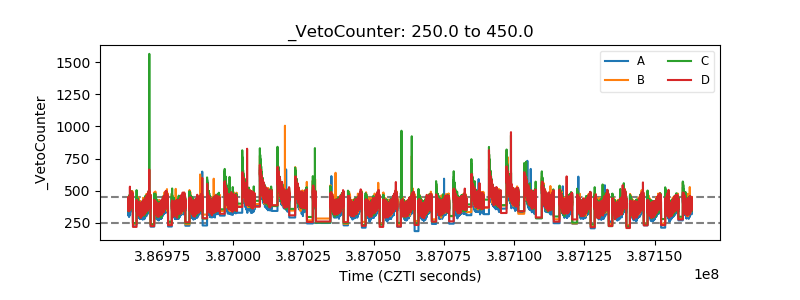 |