| Param | Original file | Final file |
|---|---|---|
| Filename | modeM0/AS1A11_047T09_9000005054_35266cztM0_level2.evt | modeM0/AS1A11_047T09_9000005054_35266cztM0_level2_quad_clean.evt |
| Size (bytes) | 634,397,760 | 70,565,760 |
| Size | 605.0 MB | 67.3 MB |
| Events in quadrant A | 2,746,295 | 470,369 |
| Events in quadrant B | 7,655,358 | 386,013 |
| Events in quadrant C | 4,935,731 | 433,918 |
| Events in quadrant D | 3,484,101 | 441,205 |
| Mode M9 | |||
|---|---|---|---|
| Quadrant | BADHDUFLAG | Total packets | Discarded packets |
| A | 0 | 17 | 0 |
| B | 0 | 17 | 0 |
| C | 0 | 17 | 0 |
| D | 0 | 18 | 0 |
| Mode M0 | |||
|---|---|---|---|
| Quadrant | BADHDUFLAG | Total packets | Discarded packets |
| A | 0 | 11893 | 3 |
| B | 0 | 26685 | 2 |
| C | 0 | 18389 | 2 |
| D | 0 | 13939 | 2 |
| Mode SS | |||
|---|---|---|---|
| Quadrant | BADHDUFLAG | Total packets | Discarded packets |
| A | 0 | 118 | 0 |
| B | 0 | 118 | 0 |
| C | 0 | 118 | 0 |
| D | 0 | 118 | 0 |
| Quadrant | Total seconds | Saturated seconds | Saturation percentage |
|---|---|---|---|
| A | 5784 | 17 | 0.293914% |
| B | 5784 | 1665 | 28.786307% |
| C | 5784 | 663 | 11.462656% |
| D | 5784 | 116 | 2.005533% |
Noise dominated data is calculated using 1-second bins in cleaned event files. If a bin has >2000 counts, and if more than 50% of those come from <1% of pixels, then it is considered to be noise-dominated and hence unusable.
| Quadrant | # 1 sec bins | Bins with >0 counts | Bins with >2000 counts | High rate bins dominated by noise | Noise dominated (total time) | Noise dominated (detector-on time) | Marked lightcurve |
|---|---|---|---|---|---|---|---|
| A | 7247 | 5785 | 0 | 0 | 0.00% | 0.00% | 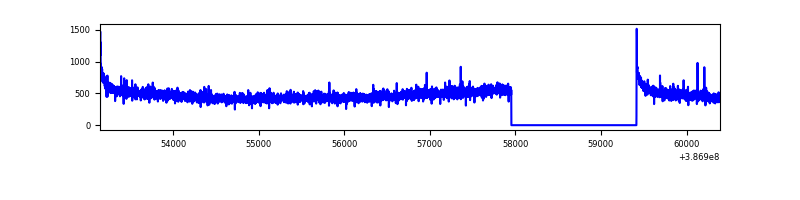 |
| B | 7247 | 5785 | 1319 | 1319 | 18.20% | 22.80% | 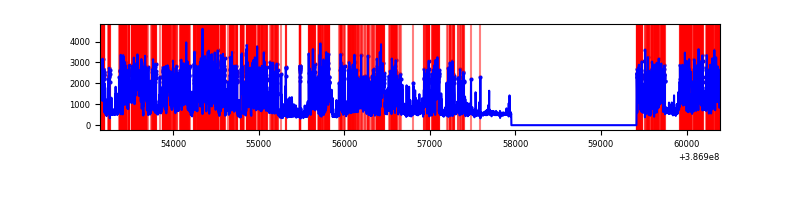 |
| C | 7247 | 5785 | 532 | 532 | 7.34% | 9.20% | 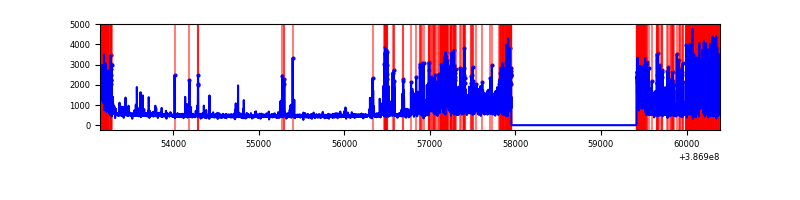 |
| D | 7247 | 5785 | 84 | 84 | 1.16% | 1.45% | 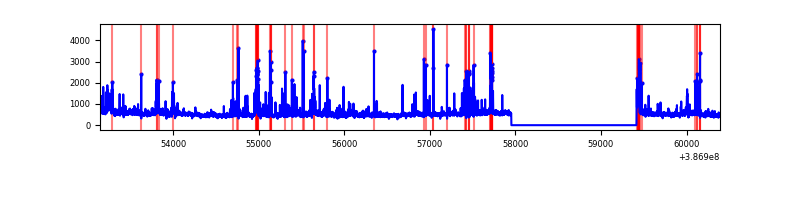 |
Top three noisy pixels from each quadrant. If the there are fewer than three noisy pixels in the level2.evt file, extra rows are filled as -1
| Pixel properties | Quadrant properties | ||||||
|---|---|---|---|---|---|---|---|
| Quadrant | DetID | PixID | Counts | Sigma | Mean | Median | Sigma |
| A | 10 | 83 | 103742 | 750.86 | 677 | 662 | 137.3 |
| A | 13 | 6 | 12633 | 87.2 | 677 | 662 | 137.3 |
| A | 13 | 254 | 10679 | 72.97 | 677 | 662 | 137.3 |
| B | 5 | 236 | 4438175 | 38309.29 | 596 | 580 | 115.8 |
| B | 5 | 172 | 551688 | 4757.66 | 596 | 580 | 115.8 |
| B | 4 | 232 | 219921 | 1893.55 | 596 | 580 | 115.8 |
| C | 0 | 10 | 2126351 | 14503.17 | 628 | 634 | 146.6 |
| C | 15 | 214 | 233771 | 1590.63 | 628 | 634 | 146.6 |
| C | 15 | 208 | 91054 | 616.91 | 628 | 634 | 146.6 |
| D | 8 | 195 | 260587 | 1618.99 | 654 | 637 | 160.6 |
| D | 13 | 249 | 175641 | 1089.94 | 654 | 637 | 160.6 |
| D | 2 | 249 | 136017 | 843.16 | 654 | 637 | 160.6 |
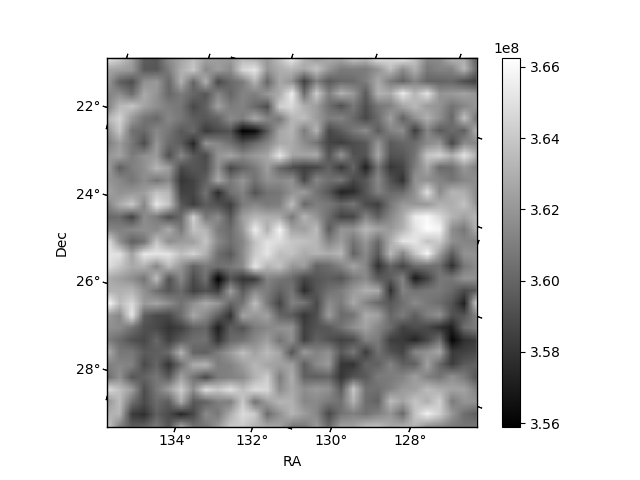
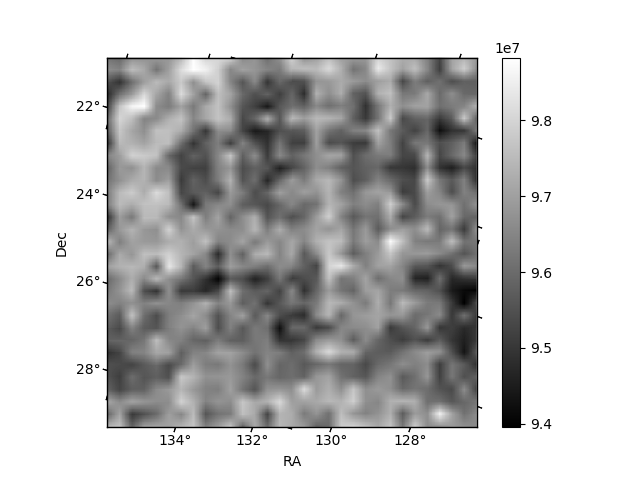
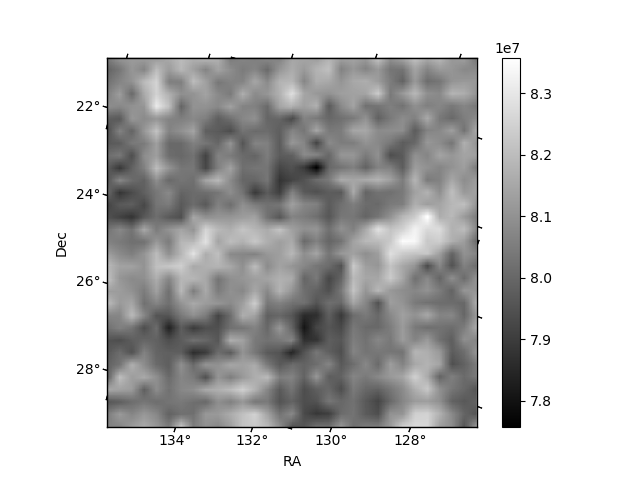
Histogram calculated using DETX and DETY for each event in the final _common_clean file
| Quadrant A | 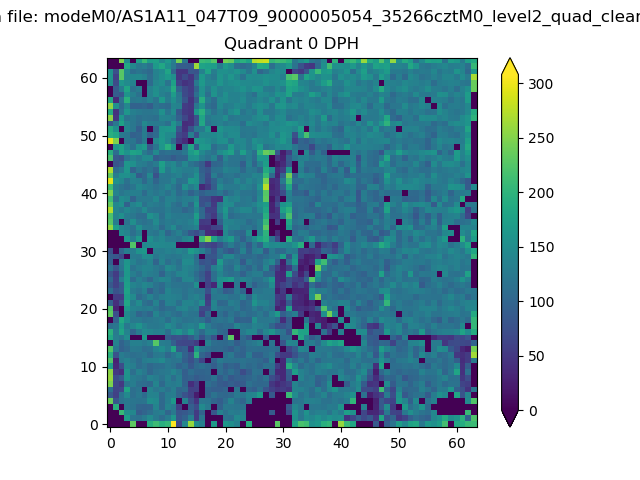 |
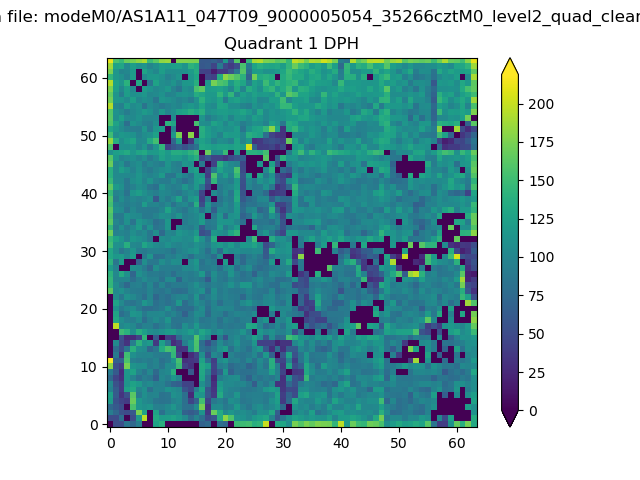 |
Quadrant B |
|---|---|---|---|
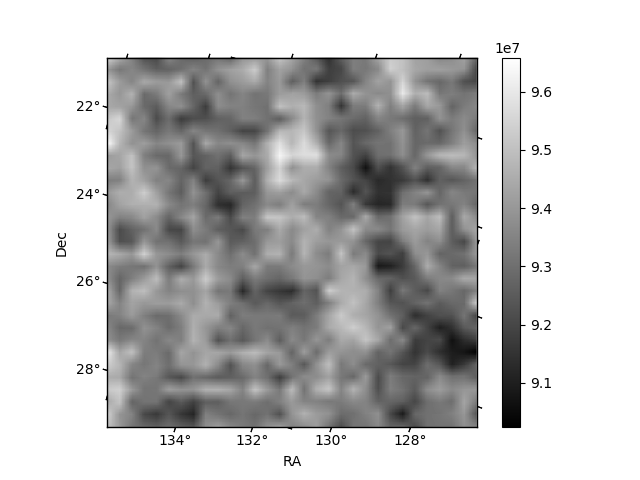
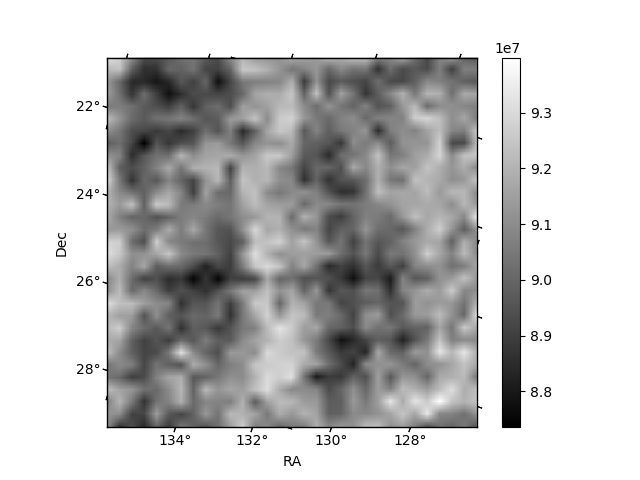
| Quadrant D | 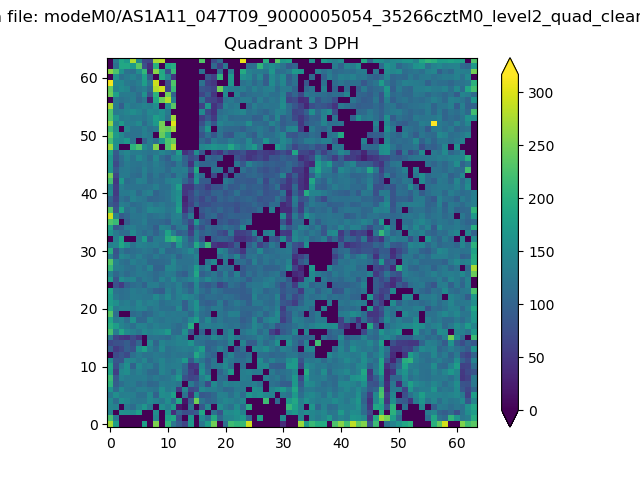 |
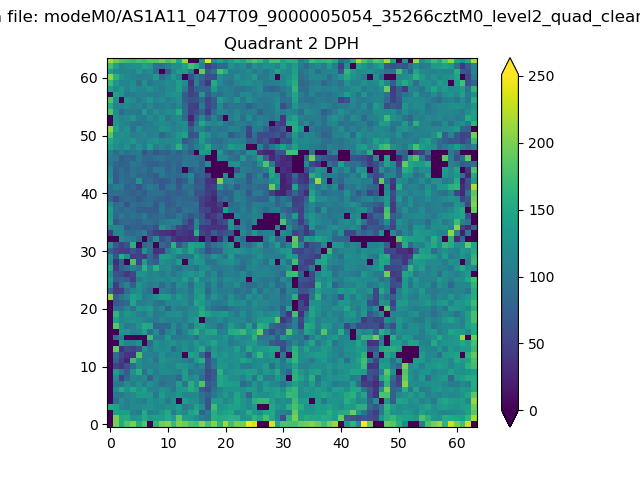 |
Quadrant C |
| Plot type | Count rate plots | Images |
|---|---|---|
| Comparison with Poisson distribution Blue bars denote a histogram of data divided into 1 sec bins. Red curve is a Poisson curve with rate = median count rate of data. |
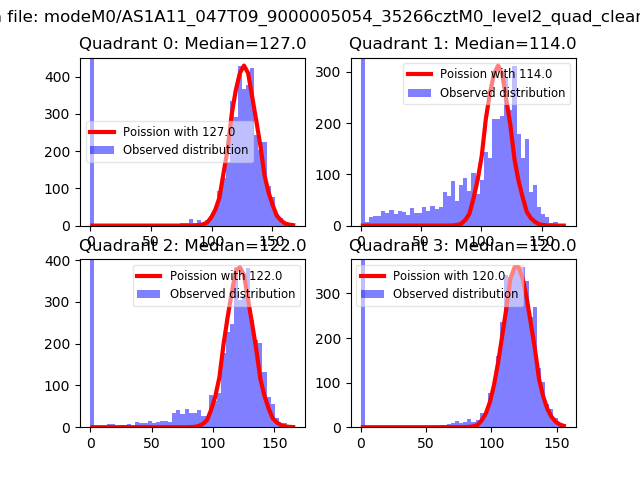 |
 |
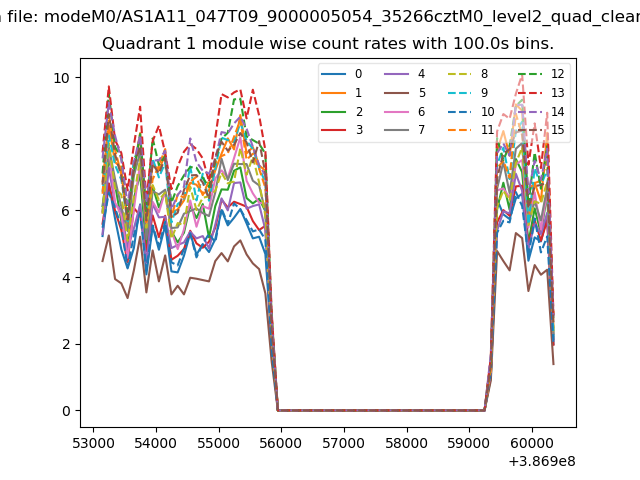
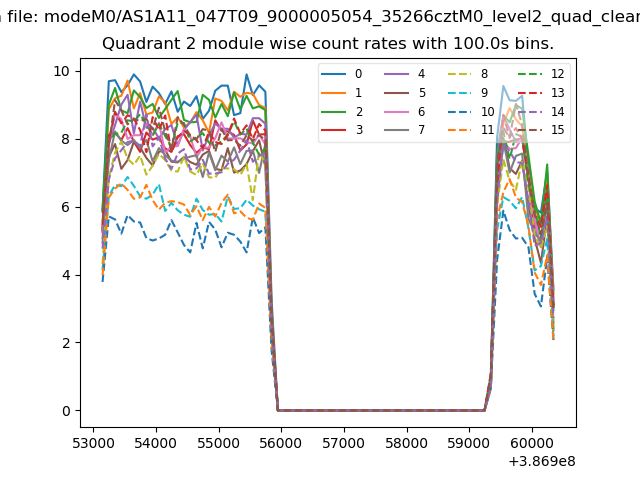
| Quadrant-wise count rates Data is divided into 100 sec bins |
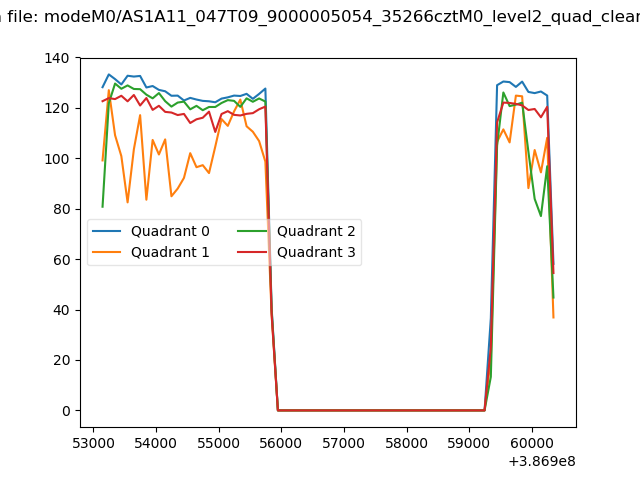 |
|
| Module-wise count rates for Quadrant A Data is divided into 100 sec bins |
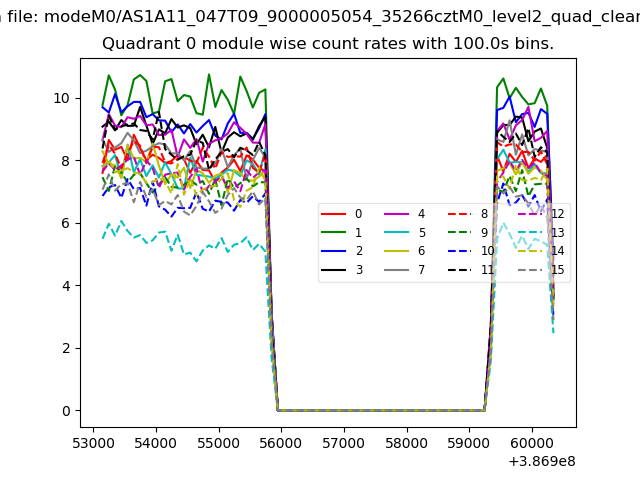 |
 |
| Module-wise count rates for Quadrant B Data is divided into 100 sec bins |
 |
 |
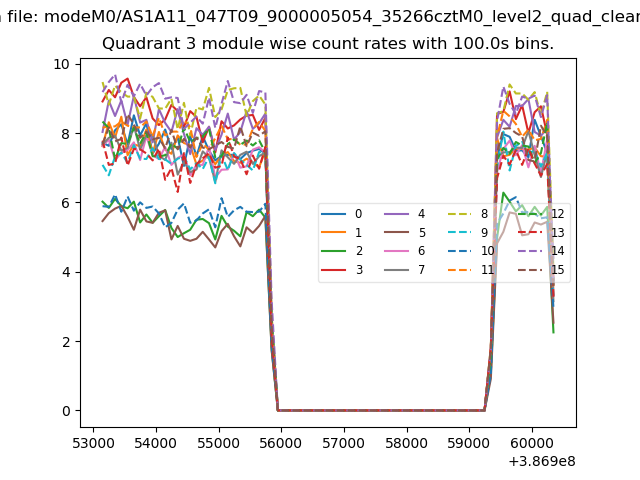
| Module-wise count rates for Quadrant C Data is divided into 100 sec bins |
 |
 |
| Module-wise count rates for Quadrant D Data is divided into 100 sec bins |
 |
 |
| Parameter | Plot |
|---|---|
| CZT HV Monitor | 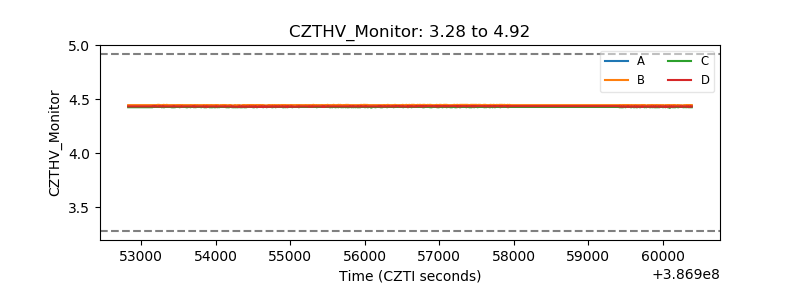 |
| D_VDD | 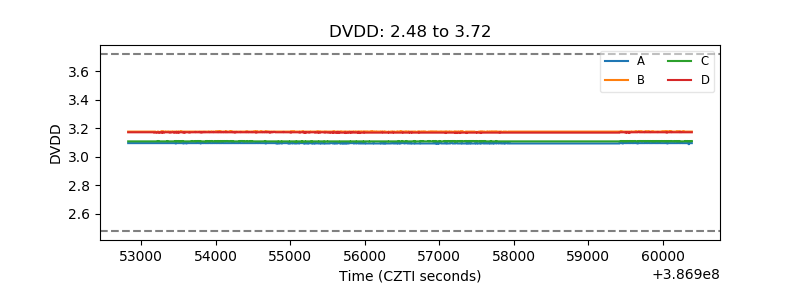 |
| Temperature 1 | 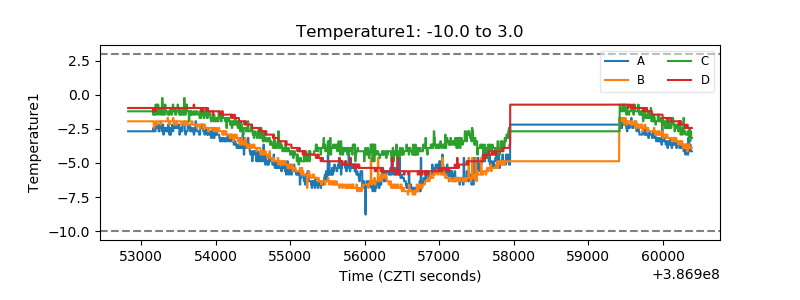 |
| Veto HV Monitor | 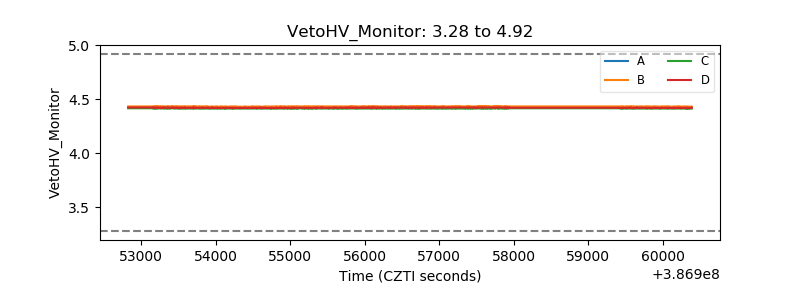 |
| Veto LLD | 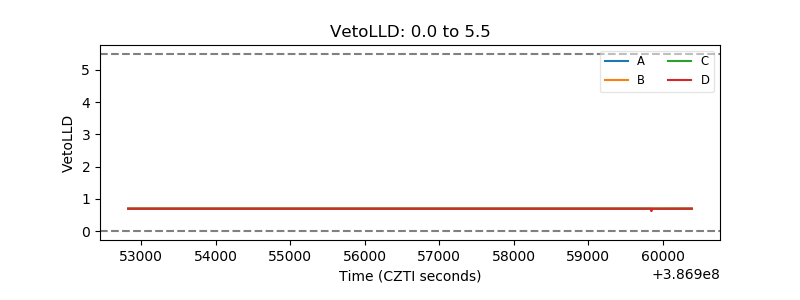 |
| Alpha Counter | 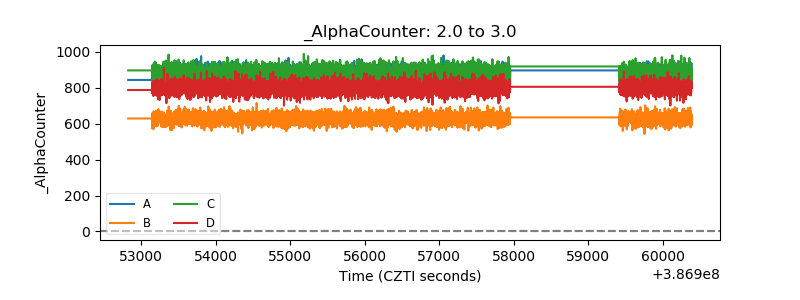 |
| _CPM_Rate | 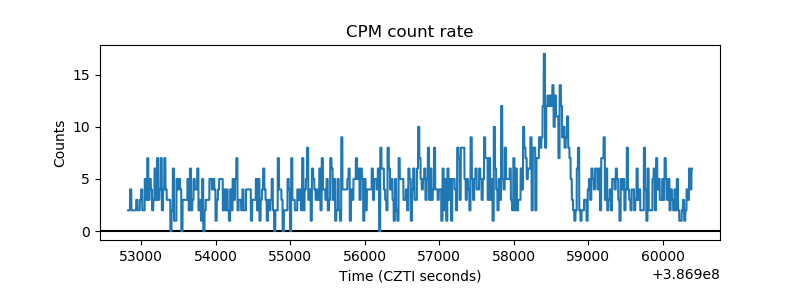 |
| CZT Counter | 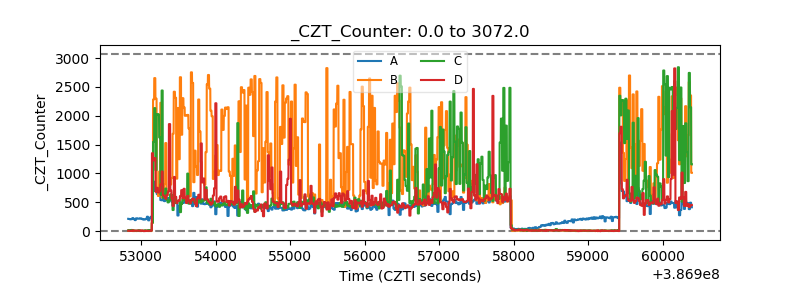 |
| +2.5 Volts monitor | 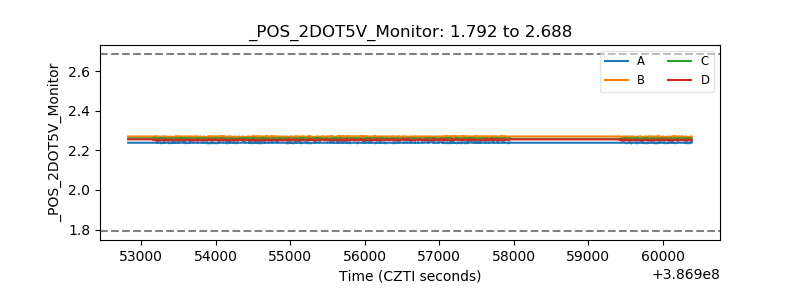 |
| +5 Volts monitor | 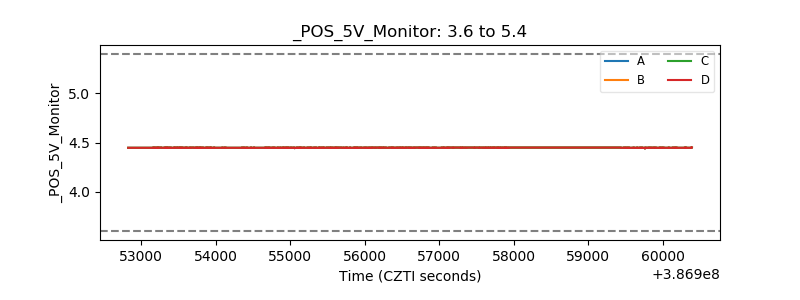 |
| _ROLL_ROT | 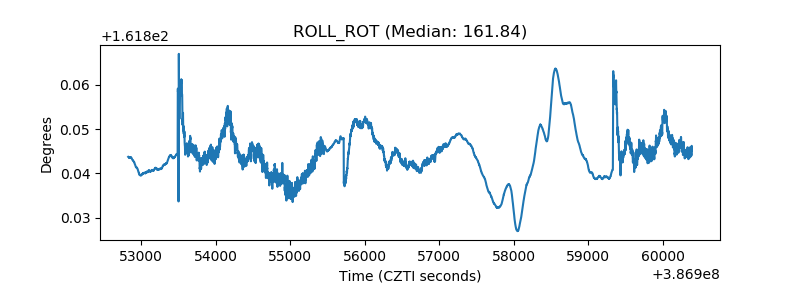 |
| _Roll_DEC | 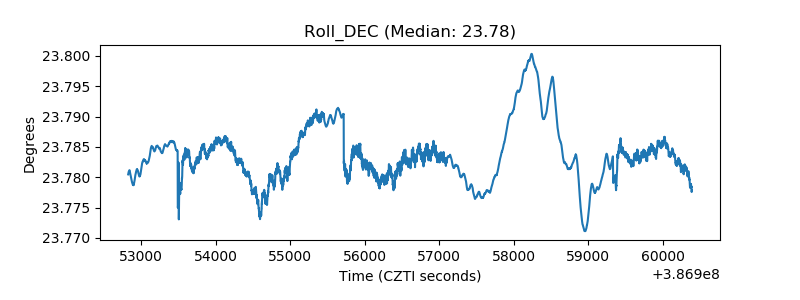 |
| _Roll_RA | 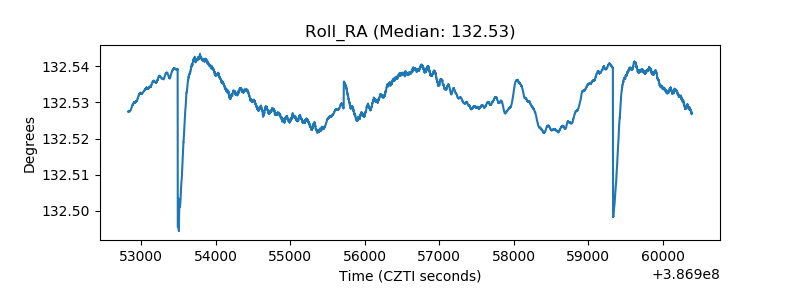 |
| Veto Counter | 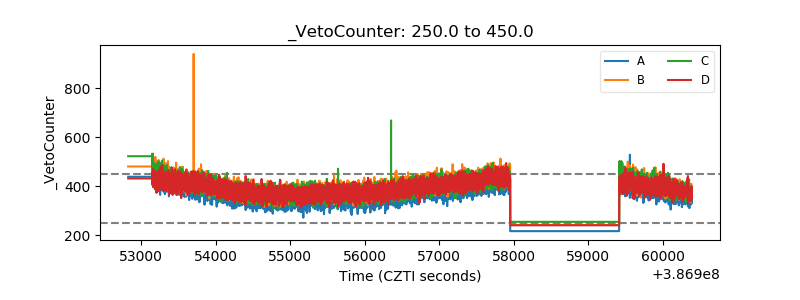 |