| Param | Original file | Final file |
|---|---|---|
| Filename | modeM0/AS1A11_047T09_9000005054_35265cztM0_level2.evt | modeM0/AS1A11_047T09_9000005054_35265cztM0_level2_quad_clean.evt |
| Size (bytes) | 653,483,520 | 73,509,120 |
| Size | 623.2 MB | 70.1 MB |
| Events in quadrant A | 2,494,219 | 512,465 |
| Events in quadrant B | 7,769,112 | 396,332 |
| Events in quadrant C | 4,892,912 | 485,585 |
| Events in quadrant D | 4,280,309 | 463,443 |
| Mode M9 | |||
|---|---|---|---|
| Quadrant | BADHDUFLAG | Total packets | Discarded packets |
| A | 0 | 18 | 0 |
| B | 0 | 18 | 0 |
| C | 0 | 18 | 0 |
| D | 0 | 18 | 0 |
| Mode M0 | |||
|---|---|---|---|
| Quadrant | BADHDUFLAG | Total packets | Discarded packets |
| A | 0 | 10686 | 2 |
| B | 0 | 26725 | 1 |
| C | 0 | 17898 | 1 |
| D | 0 | 16185 | 1 |
| Mode SS | |||
|---|---|---|---|
| Quadrant | BADHDUFLAG | Total packets | Discarded packets |
| A | 0 | 106 | 0 |
| B | 0 | 106 | 0 |
| C | 0 | 106 | 0 |
| D | 0 | 106 | 0 |
| Quadrant | Total seconds | Saturated seconds | Saturation percentage |
|---|---|---|---|
| A | 5245 | 9 | 0.171592% |
| B | 5245 | 1963 | 37.426120% |
| C | 5245 | 514 | 9.799809% |
| D | 5245 | 321 | 6.120114% |
Noise dominated data is calculated using 1-second bins in cleaned event files. If a bin has >2000 counts, and if more than 50% of those come from <1% of pixels, then it is considered to be noise-dominated and hence unusable.
| Quadrant | # 1 sec bins | Bins with >0 counts | Bins with >2000 counts | High rate bins dominated by noise | Noise dominated (total time) | Noise dominated (detector-on time) | Marked lightcurve |
|---|---|---|---|---|---|---|---|
| A | 7038 | 5246 | 0 | 0 | 0.00% | 0.00% | 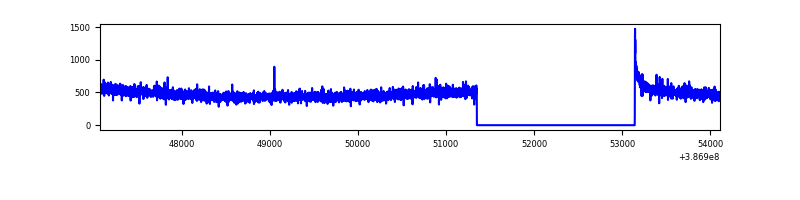 |
| B | 7038 | 5246 | 1545 | 1545 | 21.95% | 29.45% | 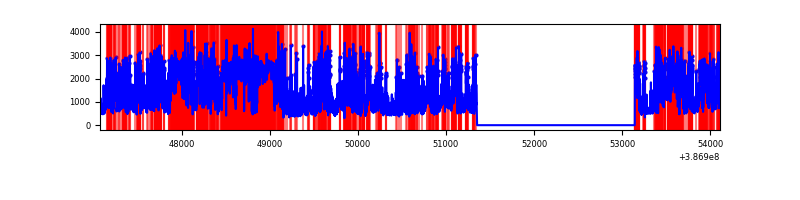 |
| C | 7038 | 5246 | 490 | 490 | 6.96% | 9.34% | 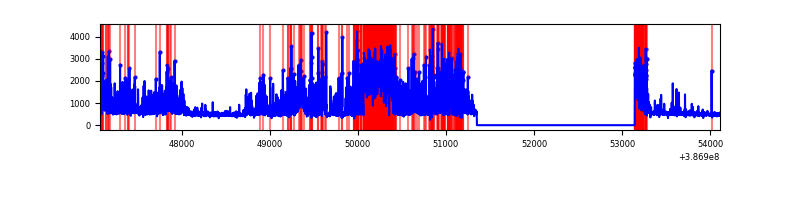 |
| D | 7038 | 5246 | 317 | 317 | 4.50% | 6.04% | 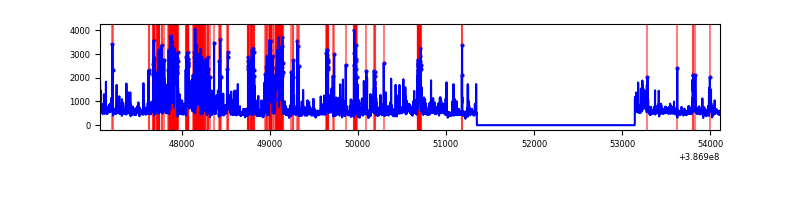 |
Top three noisy pixels from each quadrant. If the there are fewer than three noisy pixels in the level2.evt file, extra rows are filled as -1
| Pixel properties | Quadrant properties | ||||||
|---|---|---|---|---|---|---|---|
| Quadrant | DetID | PixID | Counts | Sigma | Mean | Median | Sigma |
| A | 10 | 83 | 74665 | 590.53 | 620 | 608 | 125.4 |
| A | 13 | 6 | 14384 | 109.85 | 620 | 608 | 125.4 |
| A | 13 | 254 | 9982 | 74.75 | 620 | 608 | 125.4 |
| B | 5 | 236 | 4455609 | 45147.37 | 513 | 500 | 98.7 |
| B | 5 | 172 | 1077126 | 10910.36 | 513 | 500 | 98.7 |
| B | 4 | 232 | 166459 | 1681.8 | 513 | 500 | 98.7 |
| C | 0 | 10 | 1701540 | 12523.82 | 581 | 585 | 135.8 |
| C | 15 | 208 | 682252 | 5018.99 | 581 | 585 | 135.8 |
| C | 15 | 214 | 213263 | 1565.91 | 581 | 585 | 135.8 |
| D | 7 | 80 | 1137146 | 7818.25 | 591 | 574 | 145.4 |
| D | 2 | 249 | 232198 | 1593.29 | 591 | 574 | 145.4 |
| D | 10 | 118 | 164609 | 1128.36 | 591 | 574 | 145.4 |
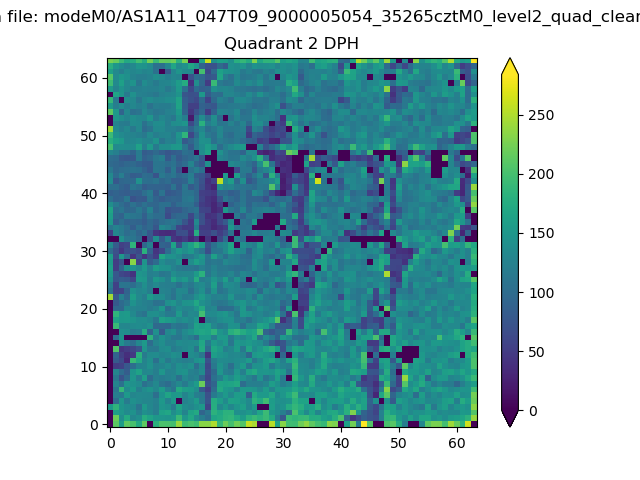
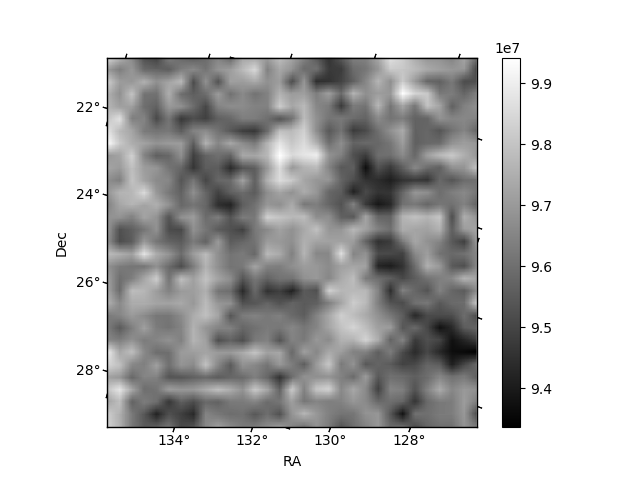
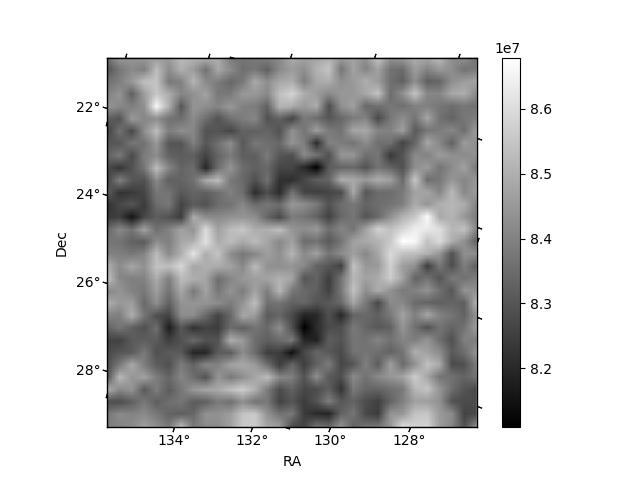
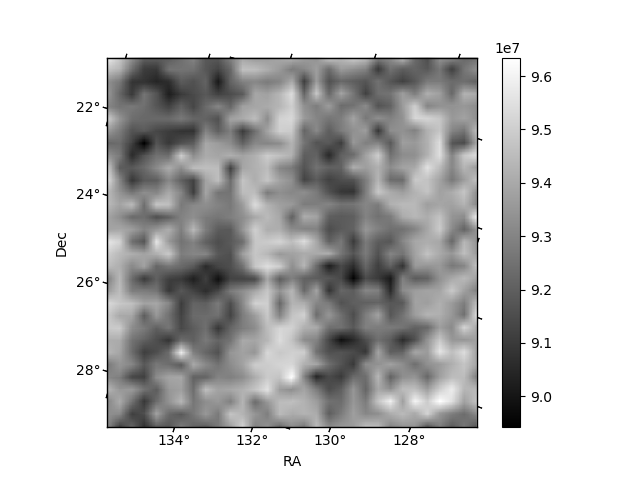
Histogram calculated using DETX and DETY for each event in the final _common_clean file
| Quadrant A | 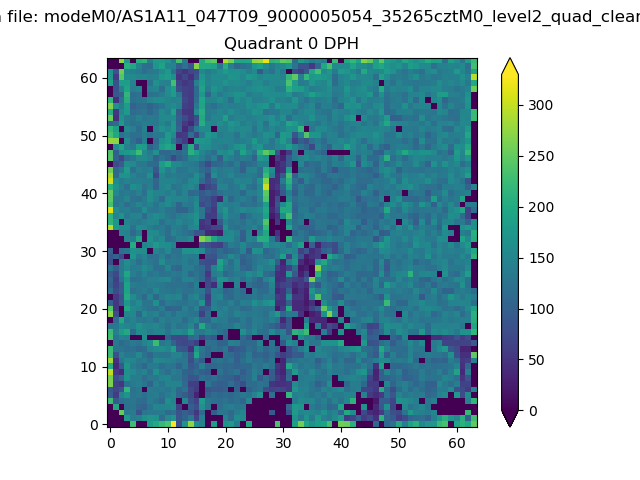 |
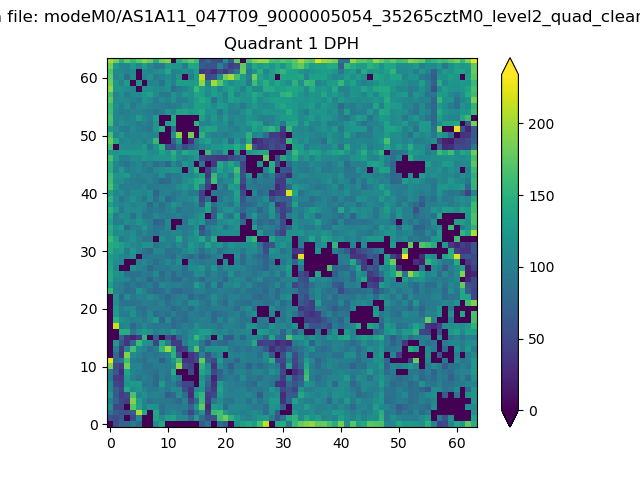 |
Quadrant B |
|---|---|---|---|
| Quadrant D | 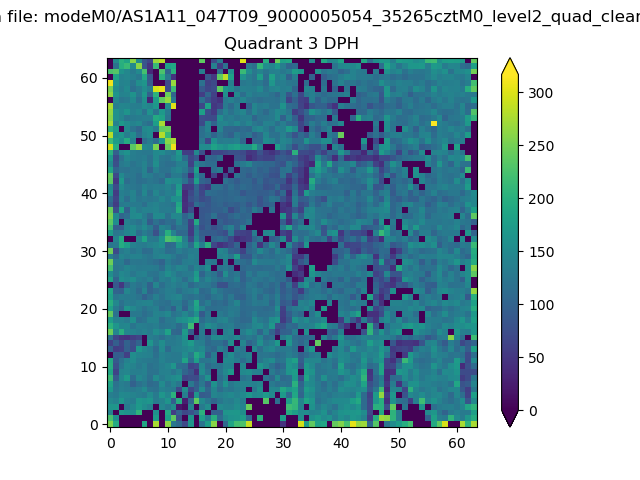 |
 |
Quadrant C |
| Plot type | Count rate plots | Images |
|---|---|---|
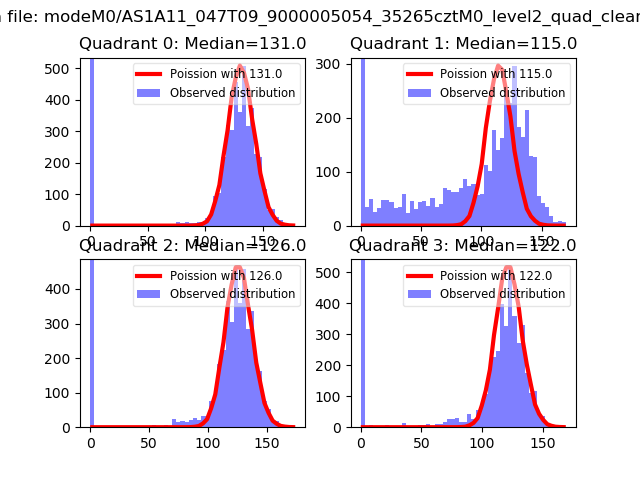
| Comparison with Poisson distribution Blue bars denote a histogram of data divided into 1 sec bins. Red curve is a Poisson curve with rate = median count rate of data. |
 |
 |
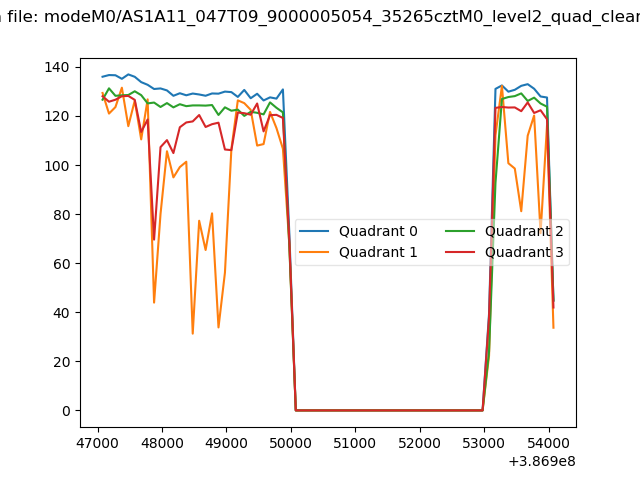
| Quadrant-wise count rates Data is divided into 100 sec bins |
 |
|
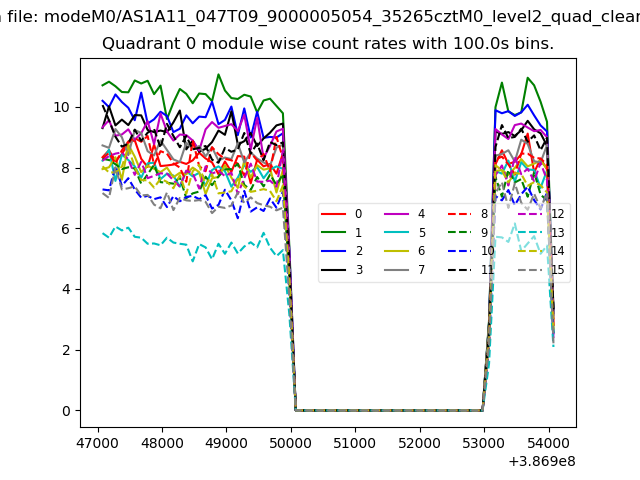
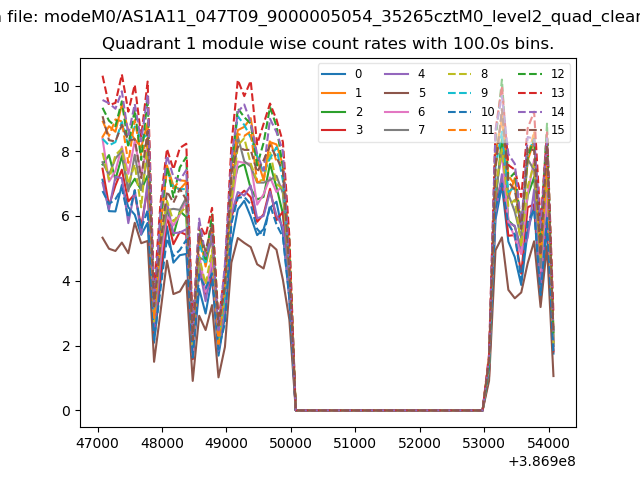
| Module-wise count rates for Quadrant A Data is divided into 100 sec bins |
 |
 |
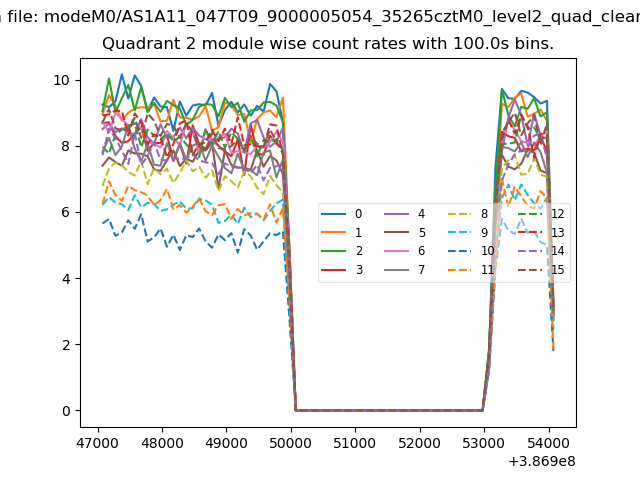
| Module-wise count rates for Quadrant B Data is divided into 100 sec bins |
 |
 |
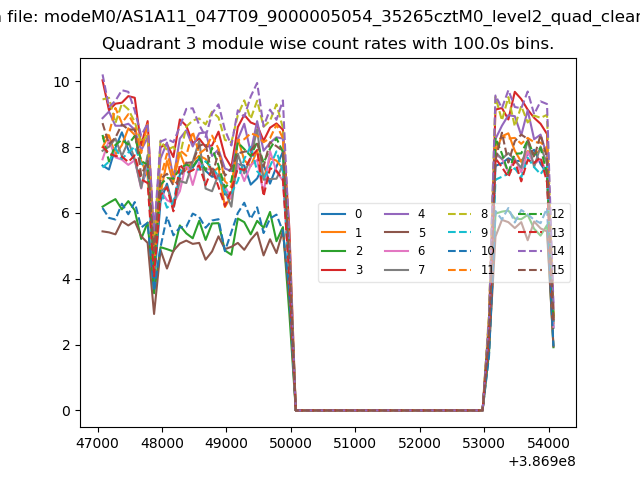
| Module-wise count rates for Quadrant C Data is divided into 100 sec bins |
 |
 |
| Module-wise count rates for Quadrant D Data is divided into 100 sec bins |
 |
 |
| Parameter | Plot |
|---|---|
| CZT HV Monitor | 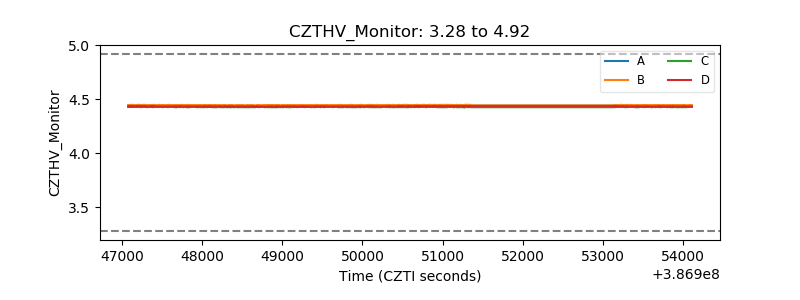 |
| D_VDD | 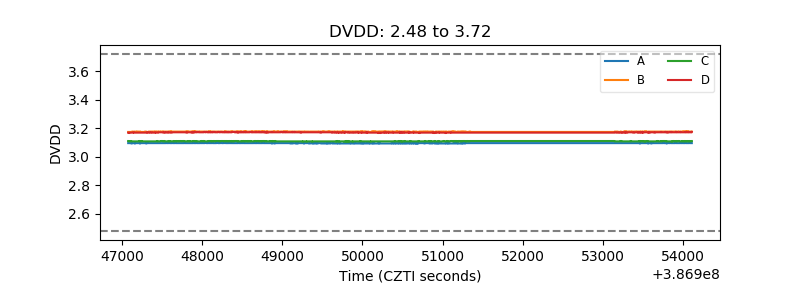 |
| Temperature 1 | 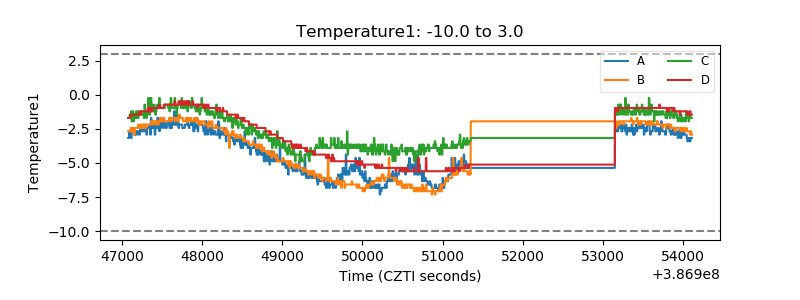 |
| Veto HV Monitor | 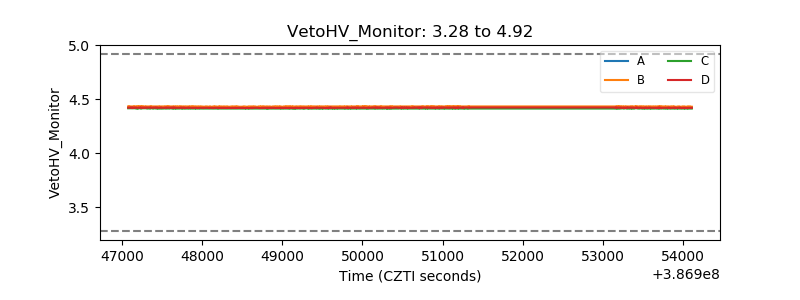 |
| Veto LLD | 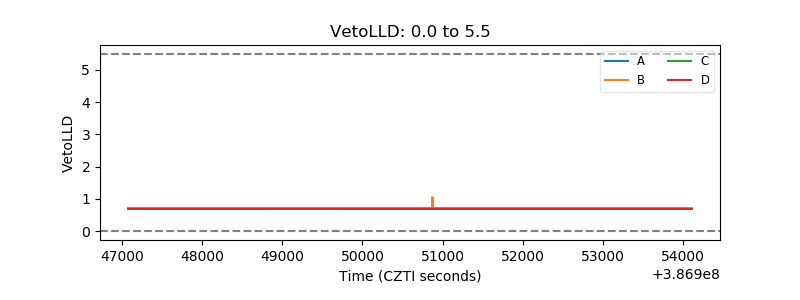 |
| Alpha Counter | 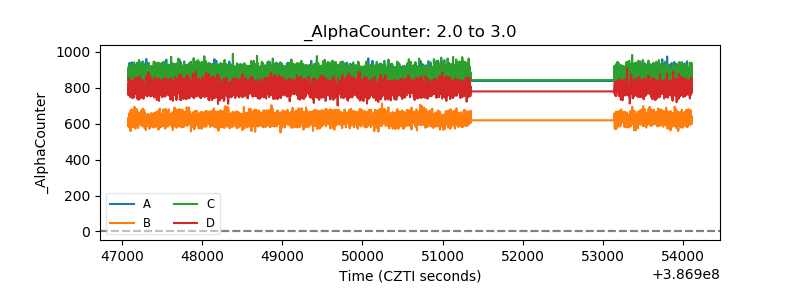 |
| _CPM_Rate | 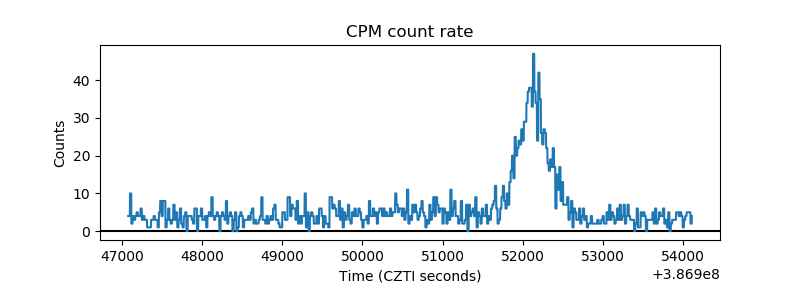 |
| CZT Counter | 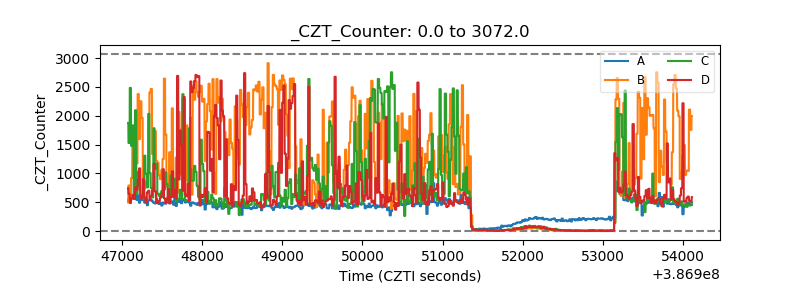 |
| +2.5 Volts monitor | 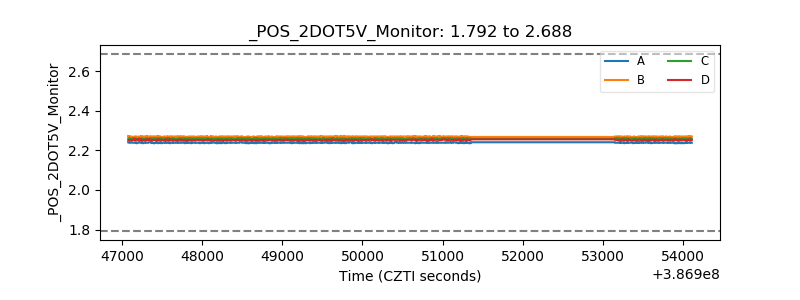 |
| +5 Volts monitor | 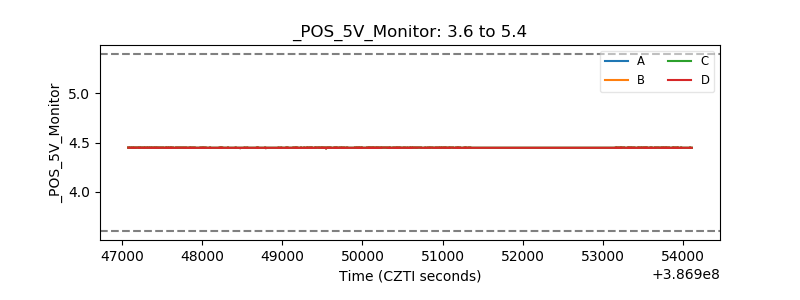 |
| _ROLL_ROT | 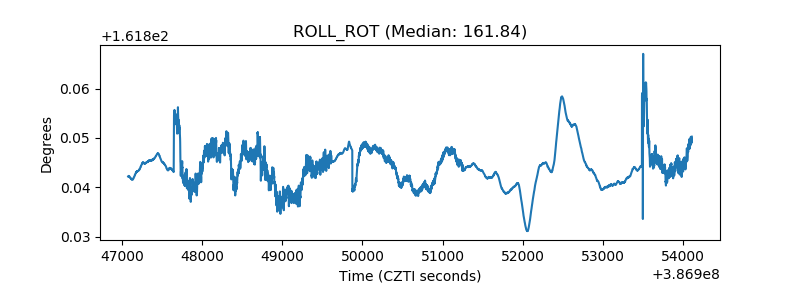 |
| _Roll_DEC | 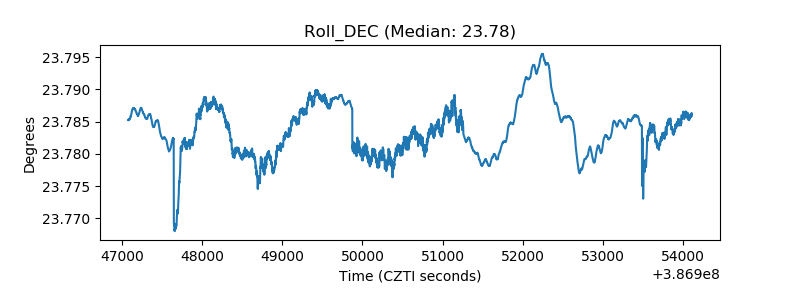 |
| _Roll_RA | 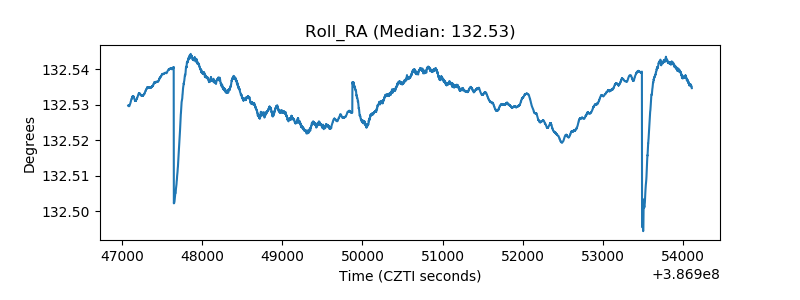 |
| Veto Counter | 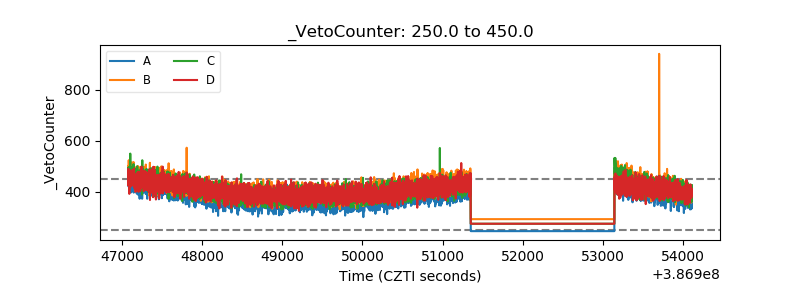 |