| Param | Original file | Final file |
|---|---|---|
| Filename | modeM0/AS1A11_047T09_9000005054_35261cztM0_level2.evt | modeM0/AS1A11_047T09_9000005054_35261cztM0_level2_quad_clean.evt |
| Size (bytes) | 604,379,520 | 64,002,240 |
| Size | 576.4 MB | 61.0 MB |
| Events in quadrant A | 2,777,953 | 431,157 |
| Events in quadrant B | 7,221,810 | 362,709 |
| Events in quadrant C | 3,243,346 | 418,528 |
| Events in quadrant D | 4,718,297 | 369,947 |
| Mode M9 | |||
|---|---|---|---|
| Quadrant | BADHDUFLAG | Total packets | Discarded packets |
| A | 0 | 30 | 0 |
| B | 0 | 30 | 0 |
| C | 0 | 30 | 0 |
| D | 0 | 31 | 0 |
| Mode M0 | |||
|---|---|---|---|
| Quadrant | BADHDUFLAG | Total packets | Discarded packets |
| A | 0 | 11148 | 3 |
| B | 0 | 25043 | 2 |
| C | 0 | 12479 | 2 |
| D | 0 | 17217 | 2 |
| Mode SS | |||
|---|---|---|---|
| Quadrant | BADHDUFLAG | Total packets | Discarded packets |
| A | 0 | 104 | 0 |
| B | 0 | 104 | 0 |
| C | 0 | 104 | 0 |
| D | 0 | 104 | 0 |
| Quadrant | Total seconds | Saturated seconds | Saturation percentage |
|---|---|---|---|
| A | 5060 | 5 | 0.098814% |
| B | 5060 | 1706 | 33.715415% |
| C | 5060 | 169 | 3.339921% |
| D | 5060 | 518 | 10.237154% |
Noise dominated data is calculated using 1-second bins in cleaned event files. If a bin has >2000 counts, and if more than 50% of those come from <1% of pixels, then it is considered to be noise-dominated and hence unusable.
| Quadrant | # 1 sec bins | Bins with >0 counts | Bins with >2000 counts | High rate bins dominated by noise | Noise dominated (total time) | Noise dominated (detector-on time) | Marked lightcurve |
|---|---|---|---|---|---|---|---|
| A | 7093 | 5061 | 0 | 0 | 0.00% | 0.00% | 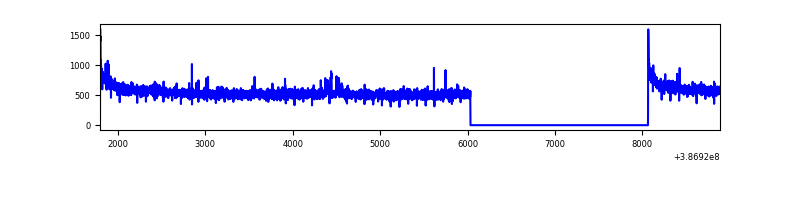 |
| B | 7093 | 5061 | 1205 | 1205 | 16.99% | 23.81% | 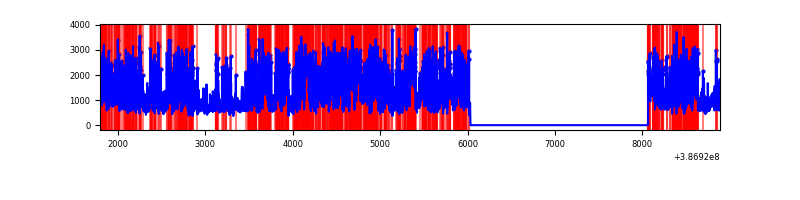 |
| C | 7093 | 5061 | 133 | 133 | 1.88% | 2.63% | 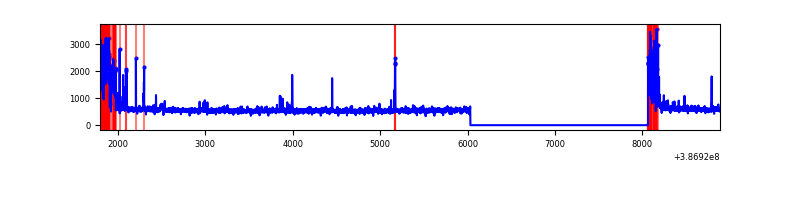 |
| D | 7093 | 5061 | 497 | 497 | 7.01% | 9.82% | 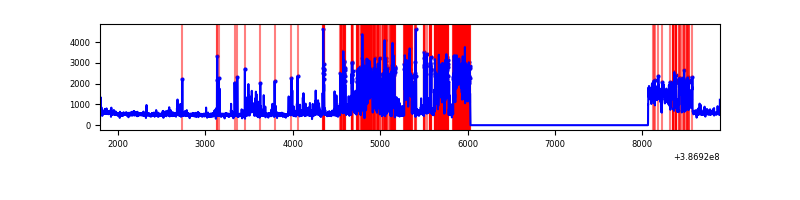 |
Top three noisy pixels from each quadrant. If the there are fewer than three noisy pixels in the level2.evt file, extra rows are filled as -1
| Pixel properties | Quadrant properties | ||||||
|---|---|---|---|---|---|---|---|
| Quadrant | DetID | PixID | Counts | Sigma | Mean | Median | Sigma |
| A | 10 | 83 | 95858 | 702.03 | 682 | 672 | 135.6 |
| A | 7 | 16 | 19541 | 139.16 | 682 | 672 | 135.6 |
| A | 13 | 6 | 15968 | 112.81 | 682 | 672 | 135.6 |
| B | 5 | 236 | 4044494 | 36421.07 | 592 | 580 | 111.0 |
| B | 5 | 172 | 805409 | 7248.61 | 592 | 580 | 111.0 |
| B | 12 | 111 | 13214 | 113.79 | 592 | 580 | 111.0 |
| C | 0 | 10 | 307244 | 2088.03 | 637 | 642 | 146.8 |
| C | 15 | 214 | 214410 | 1455.81 | 637 | 642 | 146.8 |
| C | 10 | 49 | 183515 | 1245.41 | 637 | 642 | 146.8 |
| D | 7 | 80 | 1795496 | 11729.65 | 631 | 616 | 153.0 |
| D | 12 | 233 | 209284 | 1363.66 | 631 | 616 | 153.0 |
| D | 8 | 195 | 88229 | 572.56 | 631 | 616 | 153.0 |
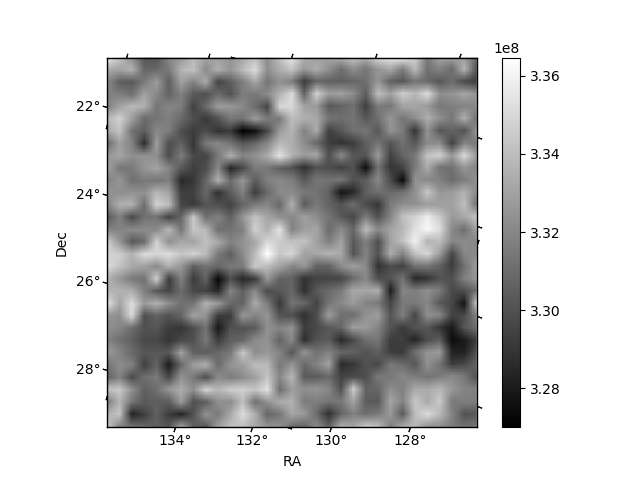
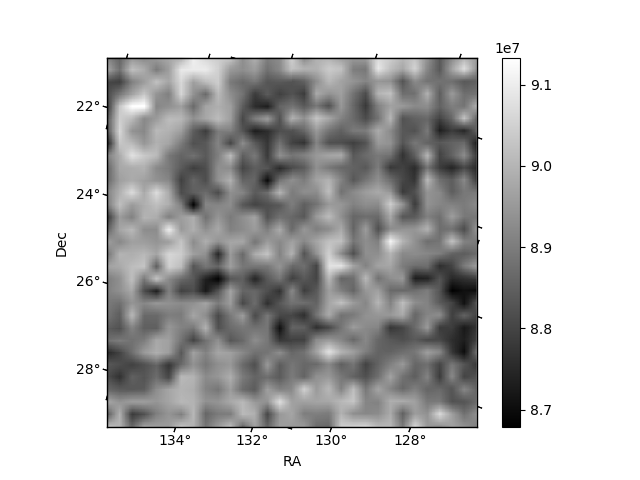
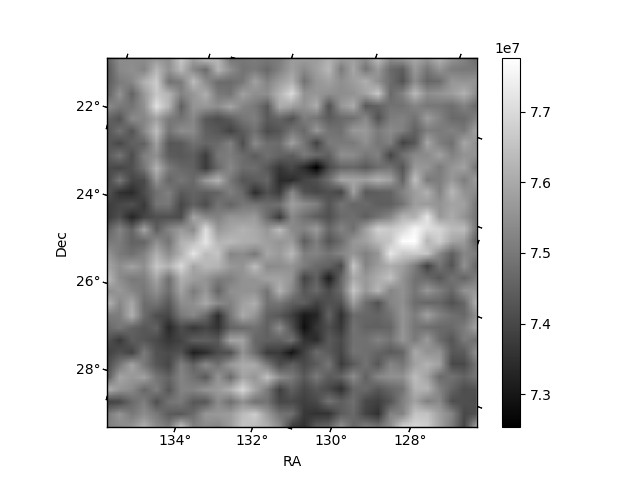
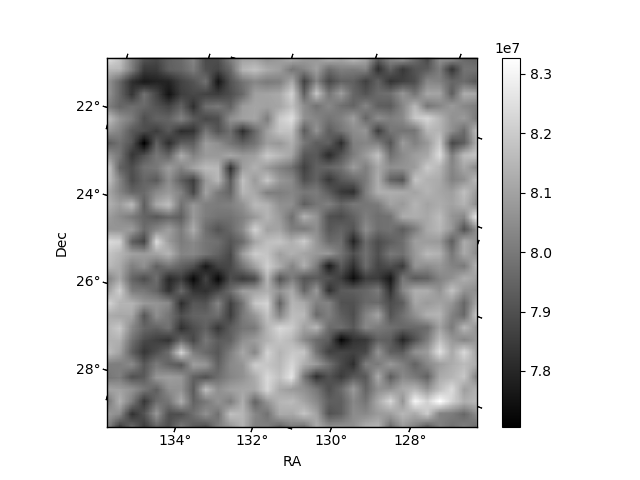
Histogram calculated using DETX and DETY for each event in the final _common_clean file
| Quadrant A | 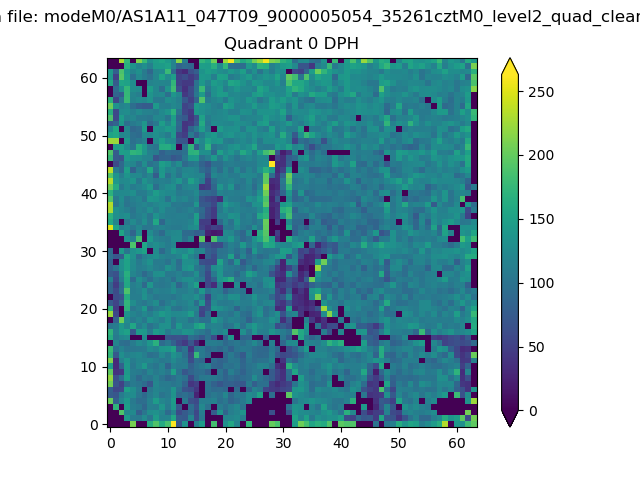 |
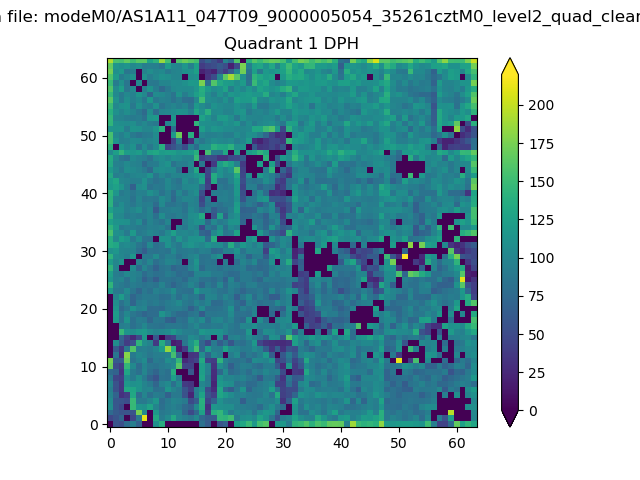 |
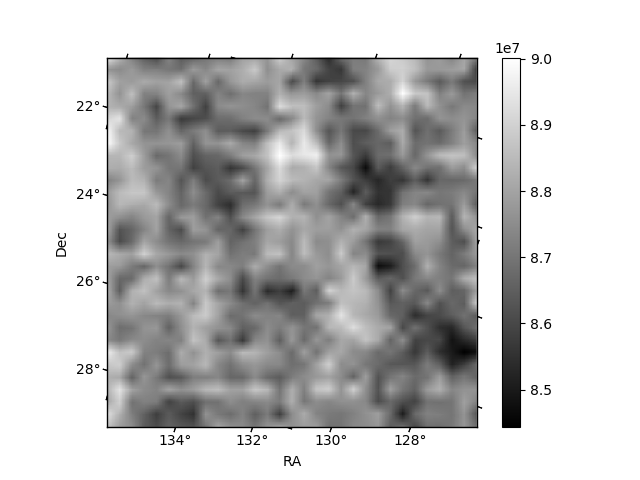
Quadrant B |
|---|---|---|---|
| Quadrant D | 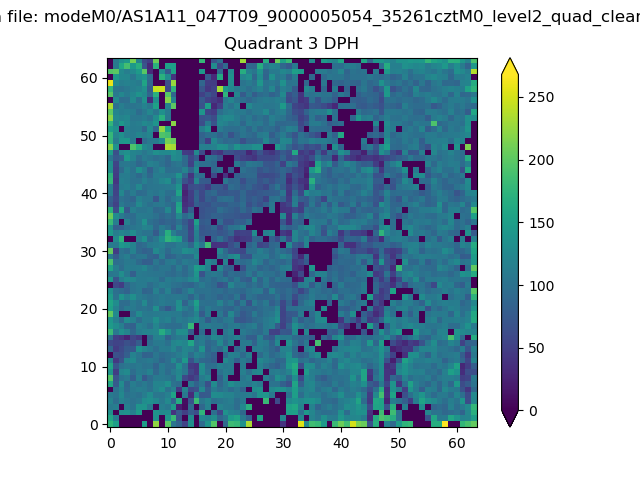 |
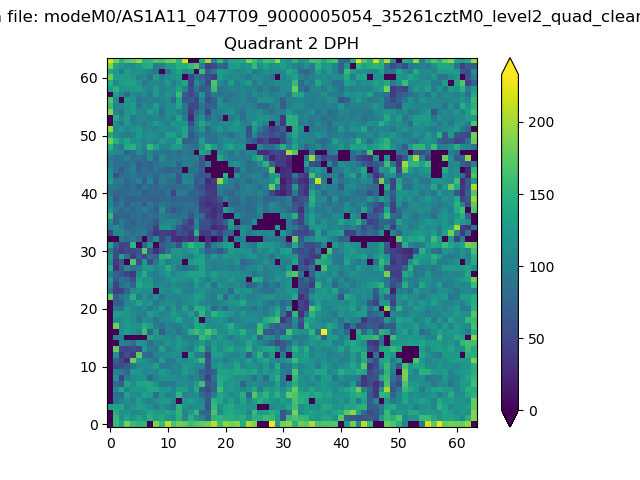 |
Quadrant C |
| Plot type | Count rate plots | Images |
|---|---|---|
| Comparison with Poisson distribution Blue bars denote a histogram of data divided into 1 sec bins. Red curve is a Poisson curve with rate = median count rate of data. |
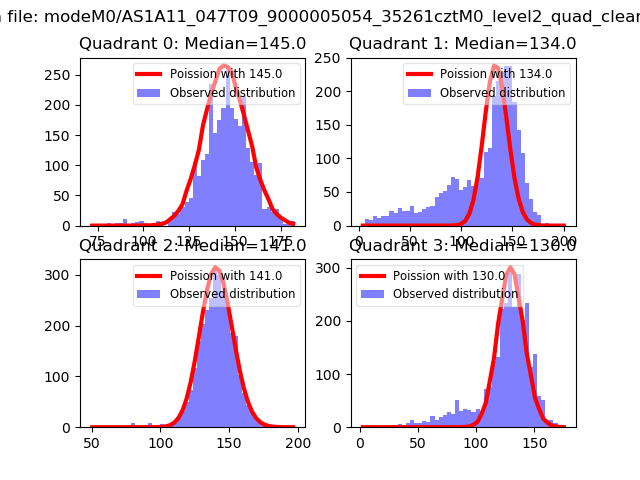 |
 |
| Quadrant-wise count rates Data is divided into 100 sec bins |
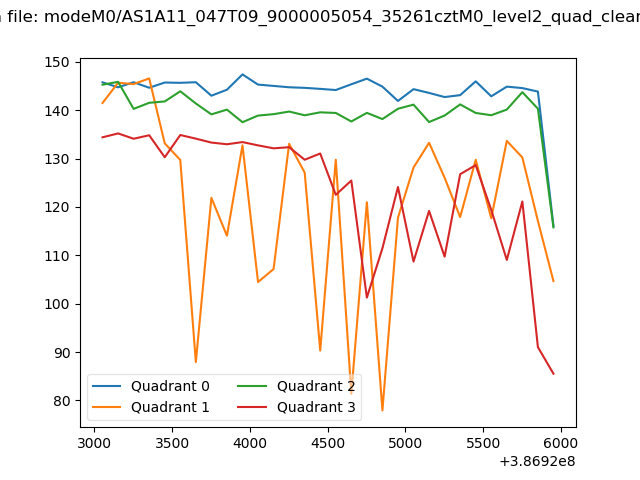 |
|
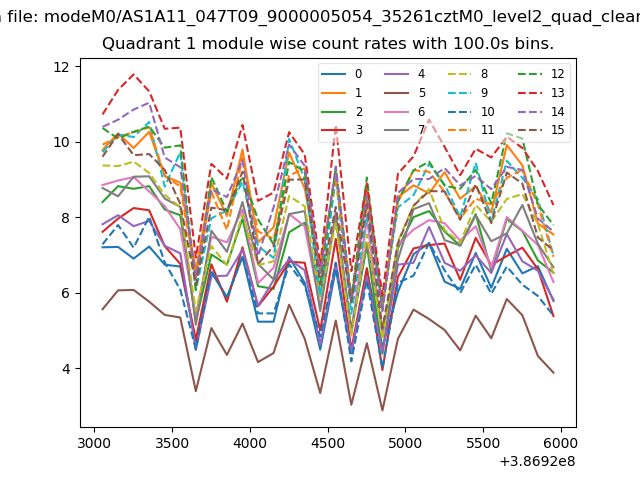
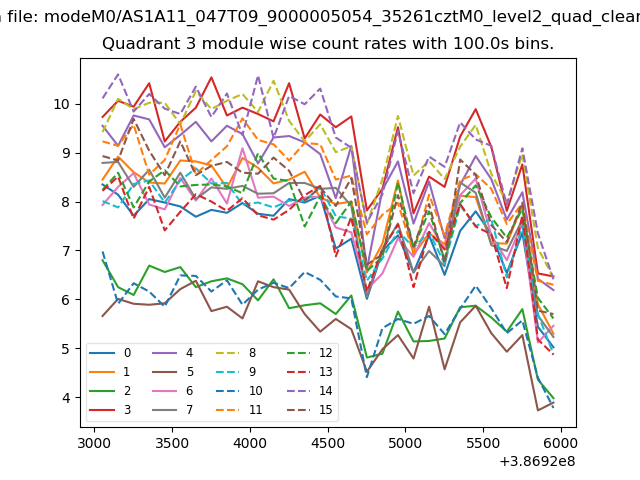
| Module-wise count rates for Quadrant A Data is divided into 100 sec bins |
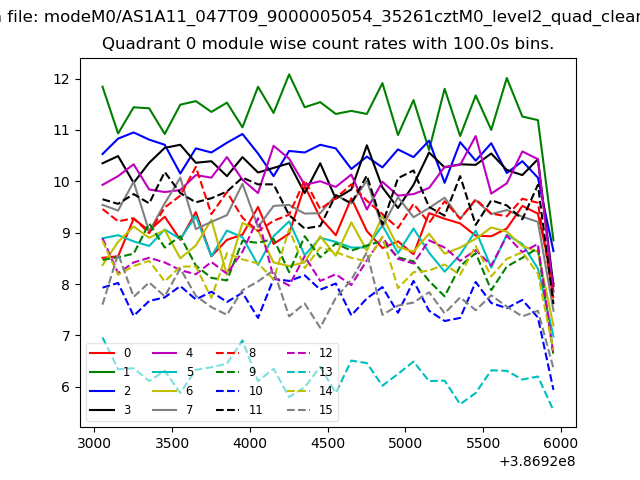 |
 |
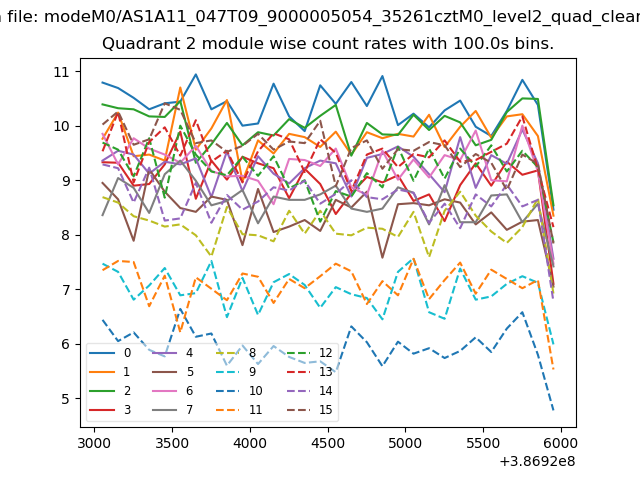
| Module-wise count rates for Quadrant B Data is divided into 100 sec bins |
 |
 |
| Module-wise count rates for Quadrant C Data is divided into 100 sec bins |
 |
 |
| Module-wise count rates for Quadrant D Data is divided into 100 sec bins |
 |
 |
| Parameter | Plot |
|---|---|
| CZT HV Monitor |  |
| D_VDD | 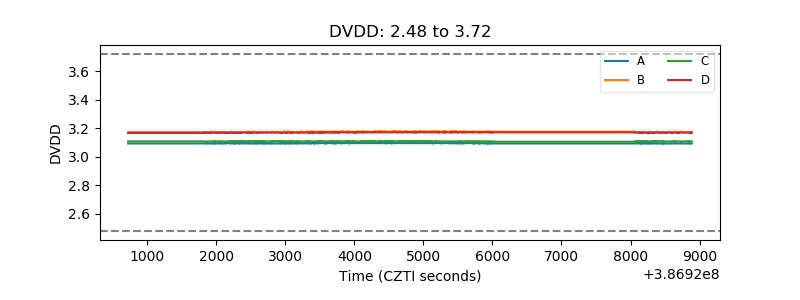 |
| Temperature 1 | 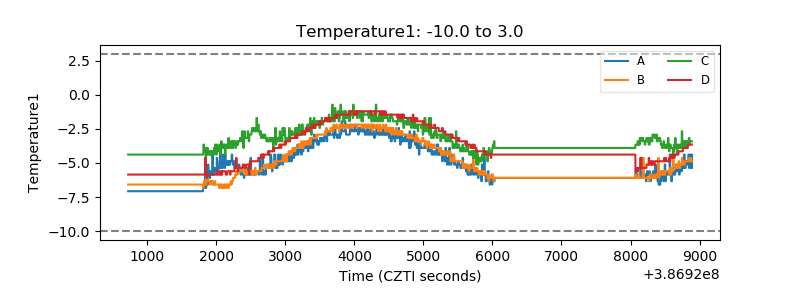 |
| Veto HV Monitor | 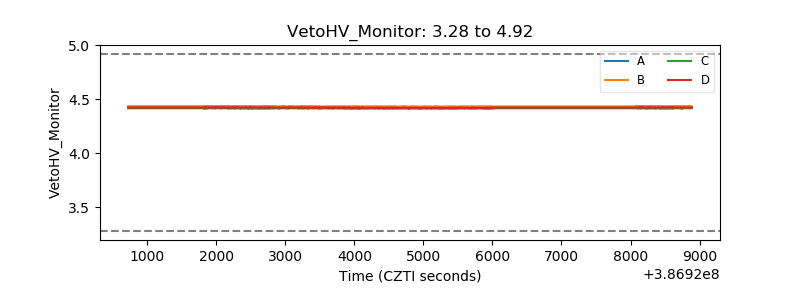 |
| Veto LLD | 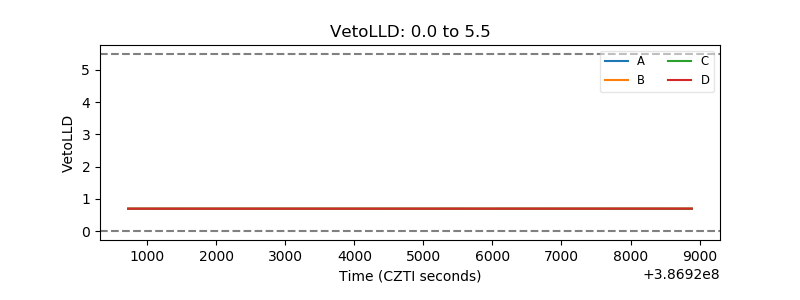 |
| Alpha Counter | 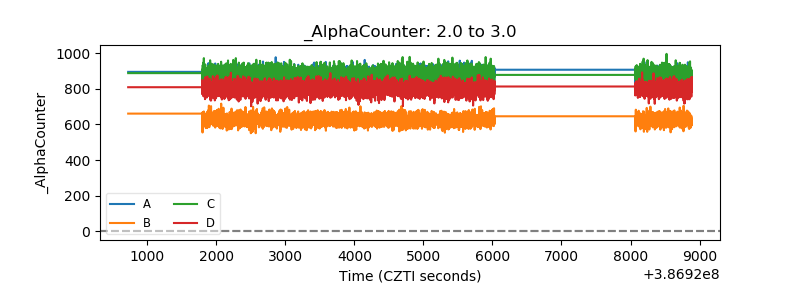 |
| _CPM_Rate | 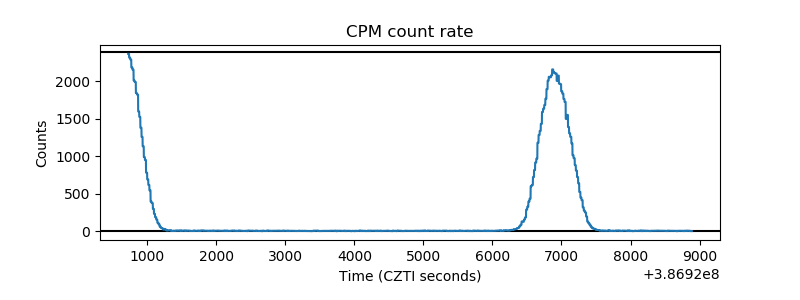 |
| CZT Counter | 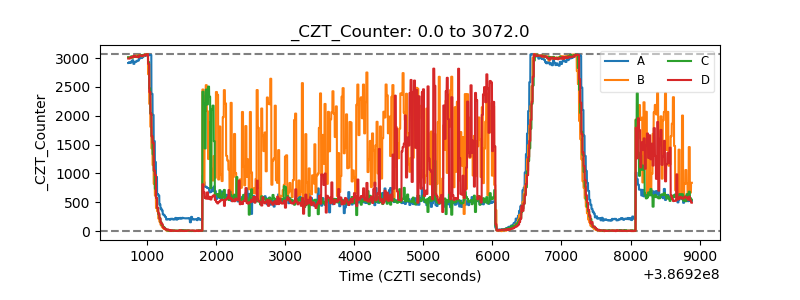 |
| +2.5 Volts monitor | 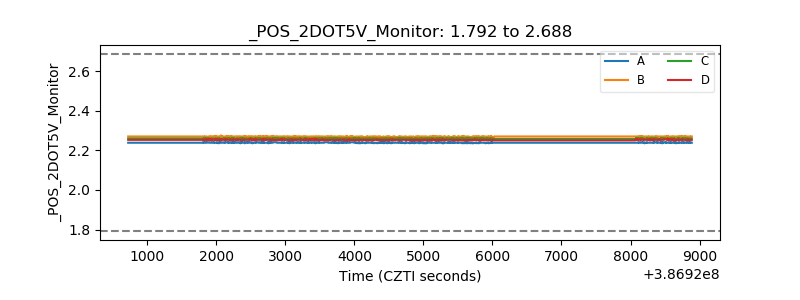 |
| +5 Volts monitor | 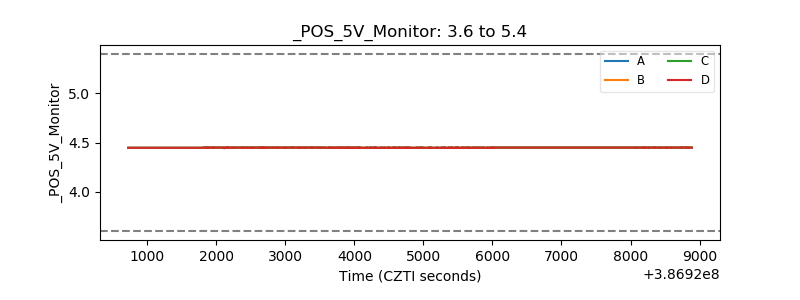 |
| _ROLL_ROT | 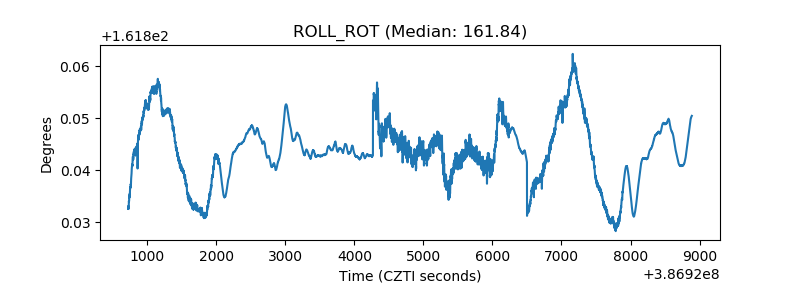 |
| _Roll_DEC | 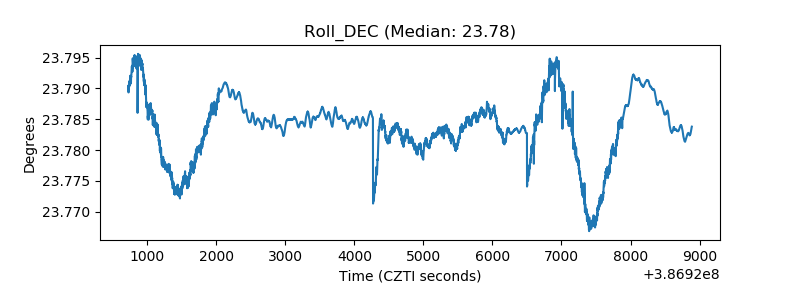 |
| _Roll_RA | 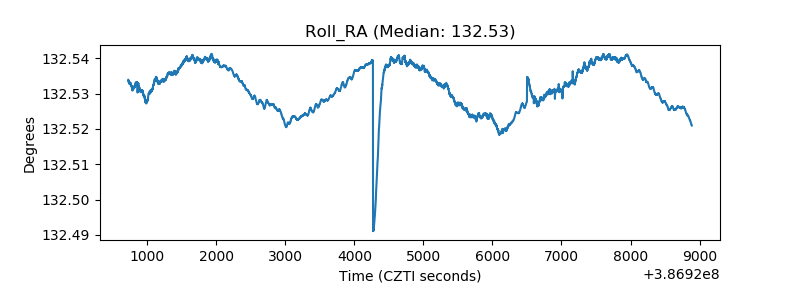 |
| Veto Counter | 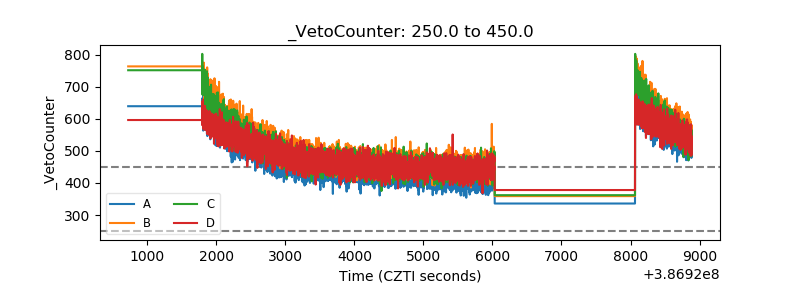 |