| Param | Original file | Final file |
|---|---|---|
| Filename | modeM0/AS1A11_047T09_9000005054_35259cztM0_level2.evt | modeM0/AS1A11_047T09_9000005054_35259cztM0_level2_quad_clean.evt |
| Size (bytes) | 647,539,200 | 50,140,800 |
| Size | 617.5 MB | 47.8 MB |
| Events in quadrant A | 2,719,549 | 310,419 |
| Events in quadrant B | 4,472,439 | 298,807 |
| Events in quadrant C | 3,015,459 | 305,878 |
| Events in quadrant D | 9,033,590 | 219,819 |
| Mode M9 | |||
|---|---|---|---|
| Quadrant | BADHDUFLAG | Total packets | Discarded packets |
| A | 0 | 28 | 0 |
| B | 0 | 28 | 0 |
| C | 0 | 28 | 0 |
| D | 0 | 29 | 0 |
| Mode M0 | |||
|---|---|---|---|
| Quadrant | BADHDUFLAG | Total packets | Discarded packets |
| A | 0 | 11338 | 3 |
| B | 0 | 16883 | 2 |
| C | 0 | 11972 | 2 |
| D | 0 | 30560 | 2 |
| Mode SS | |||
|---|---|---|---|
| Quadrant | BADHDUFLAG | Total packets | Discarded packets |
| A | 0 | 110 | 0 |
| B | 0 | 110 | 0 |
| C | 0 | 110 | 0 |
| D | 0 | 110 | 0 |
| Quadrant | Total seconds | Saturated seconds | Saturation percentage |
|---|---|---|---|
| A | 5465 | 10 | 0.182983% |
| B | 5465 | 564 | 10.320220% |
| C | 5465 | 58 | 1.061299% |
| D | 5465 | 2516 | 46.038426% |
Noise dominated data is calculated using 1-second bins in cleaned event files. If a bin has >2000 counts, and if more than 50% of those come from <1% of pixels, then it is considered to be noise-dominated and hence unusable.
| Quadrant | # 1 sec bins | Bins with >0 counts | Bins with >2000 counts | High rate bins dominated by noise | Noise dominated (total time) | Noise dominated (detector-on time) | Marked lightcurve |
|---|---|---|---|---|---|---|---|
| A | 7259 | 5466 | 0 | 0 | 0.00% | 0.00% | 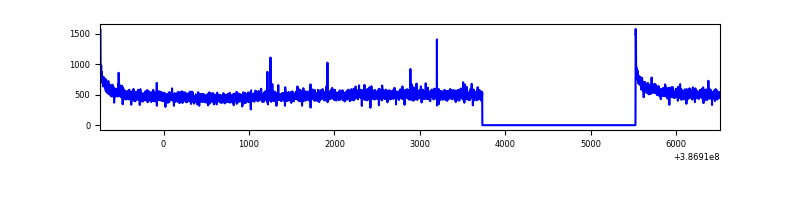 |
| B | 7259 | 5466 | 385 | 385 | 5.30% | 7.04% | 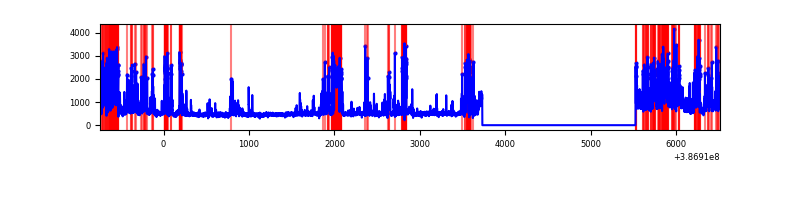 |
| C | 7259 | 5466 | 44 | 44 | 0.61% | 0.80% | 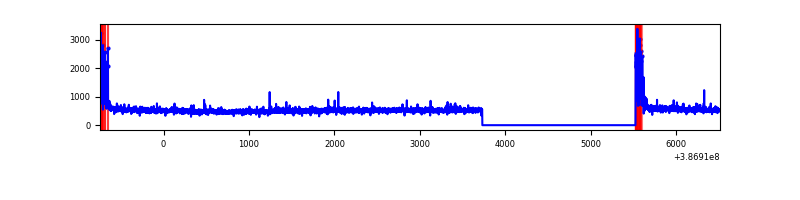 |
| D | 7259 | 5466 | 2290 | 2290 | 31.55% | 41.90% | 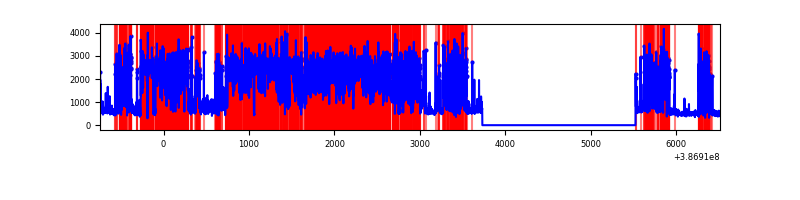 |
Top three noisy pixels from each quadrant. If the there are fewer than three noisy pixels in the level2.evt file, extra rows are filled as -1
| Pixel properties | Quadrant properties | ||||||
|---|---|---|---|---|---|---|---|
| Quadrant | DetID | PixID | Counts | Sigma | Mean | Median | Sigma |
| A | 10 | 83 | 98788 | 723.75 | 670 | 657 | 135.6 |
| A | 13 | 254 | 9373 | 64.28 | 670 | 657 | 135.6 |
| A | 13 | 6 | 7970 | 53.94 | 670 | 657 | 135.6 |
| B | 5 | 236 | 1120553 | 9217.23 | 639 | 625 | 121.5 |
| B | 5 | 172 | 632494 | 5200.41 | 639 | 625 | 121.5 |
| B | 3 | 112 | 108404 | 887.04 | 639 | 625 | 121.5 |
| C | 15 | 214 | 234460 | 1562.54 | 645 | 650 | 149.6 |
| C | 0 | 10 | 232707 | 1550.83 | 645 | 650 | 149.6 |
| C | 14 | 67 | 17563 | 113.03 | 645 | 650 | 149.6 |
| D | 7 | 80 | 5483881 | 41815.38 | 530 | 514 | 131.1 |
| D | 12 | 235 | 599054 | 4564.38 | 530 | 514 | 131.1 |
| D | 10 | 118 | 349041 | 2657.82 | 530 | 514 | 131.1 |
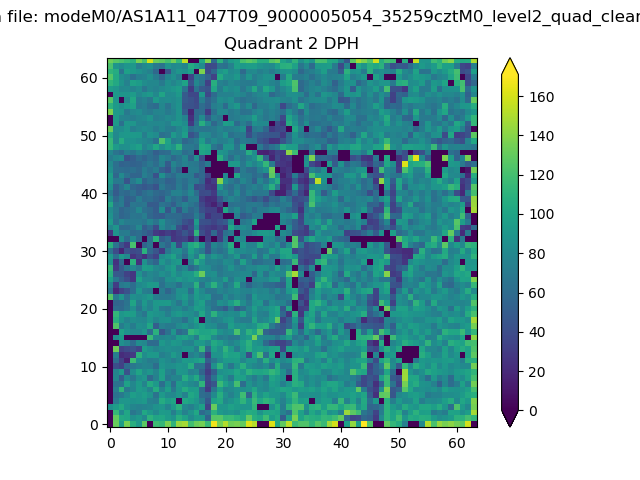
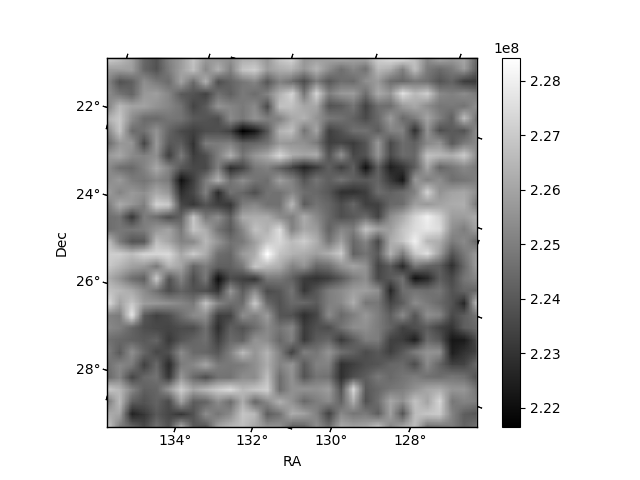
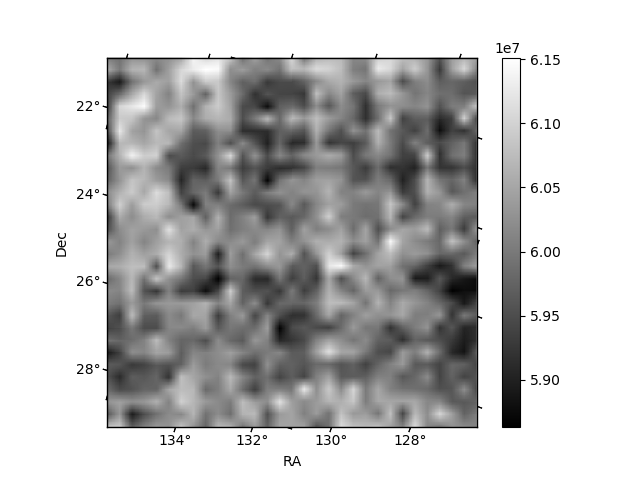
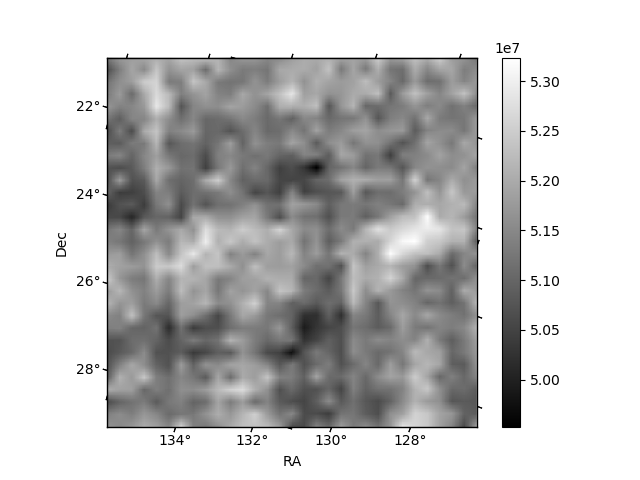
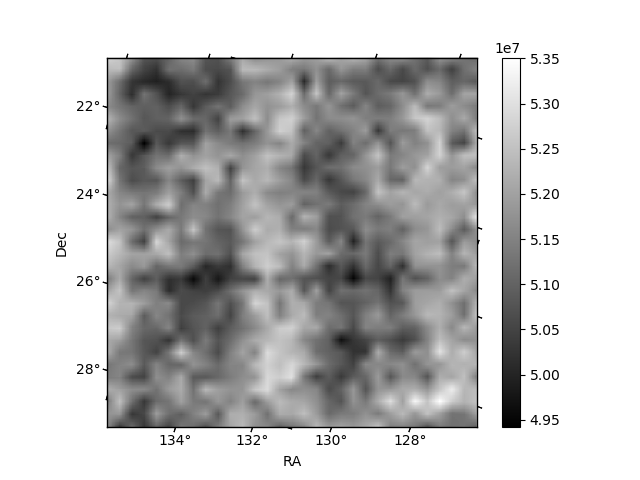
Histogram calculated using DETX and DETY for each event in the final _common_clean file
| Quadrant A | 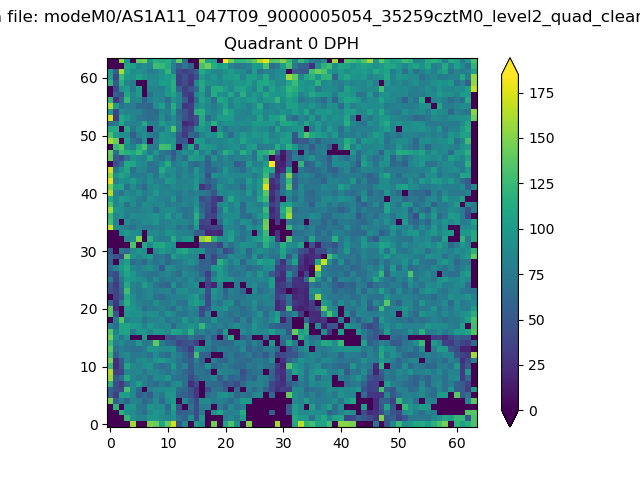 |
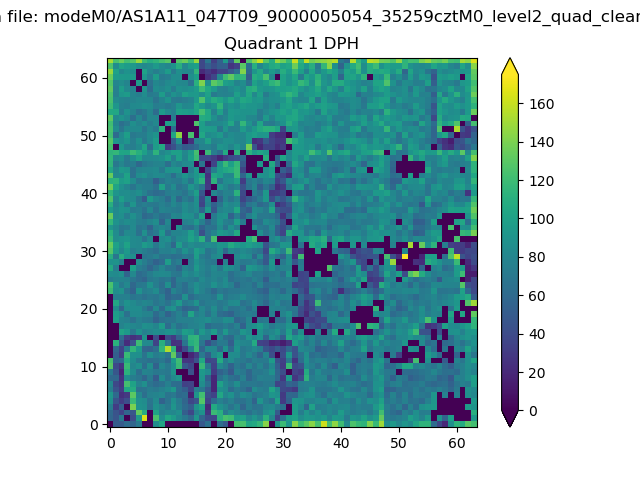 |
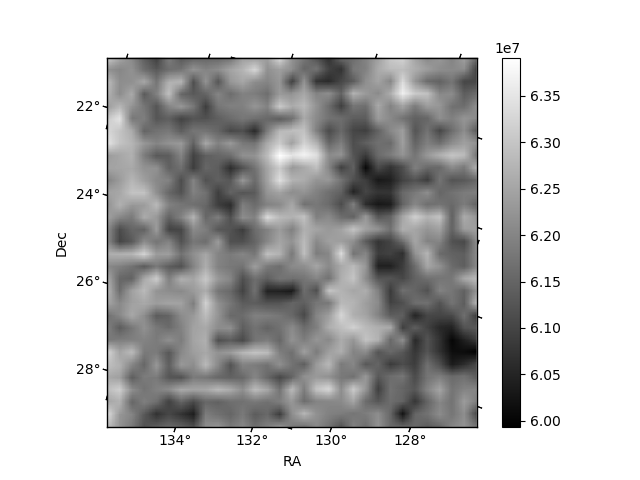
Quadrant B |
|---|---|---|---|
| Quadrant D | 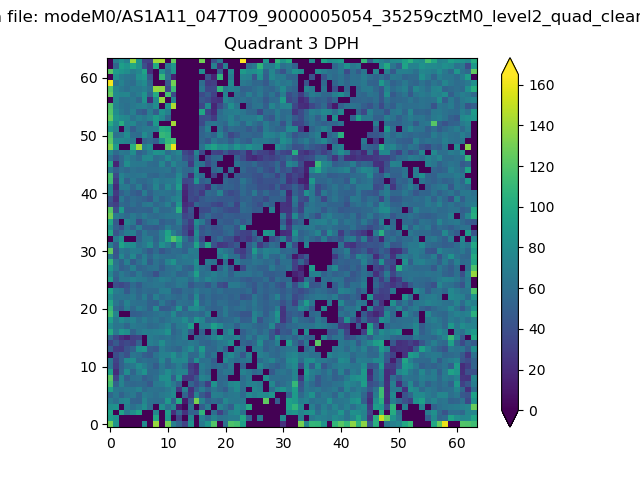 |
 |
Quadrant C |
| Plot type | Count rate plots | Images |
|---|---|---|
| Comparison with Poisson distribution Blue bars denote a histogram of data divided into 1 sec bins. Red curve is a Poisson curve with rate = median count rate of data. |
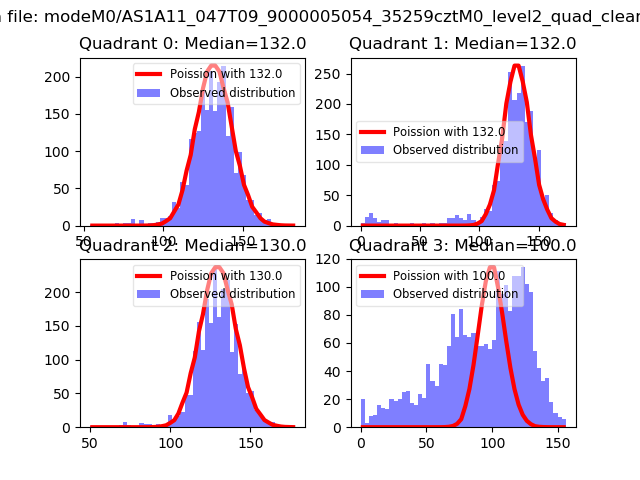 |
 |
| Quadrant-wise count rates Data is divided into 100 sec bins |
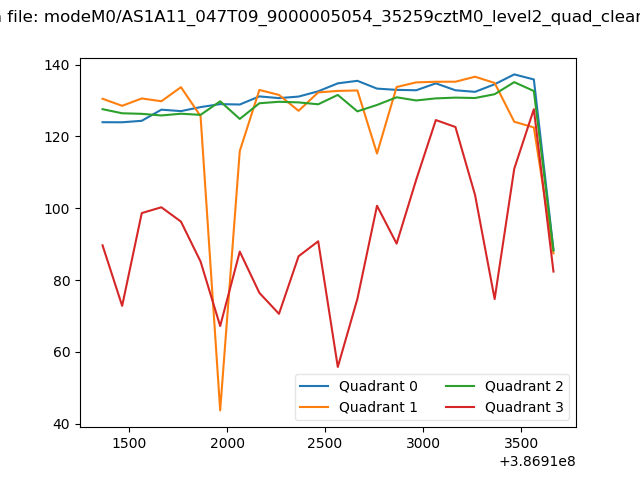 |
|
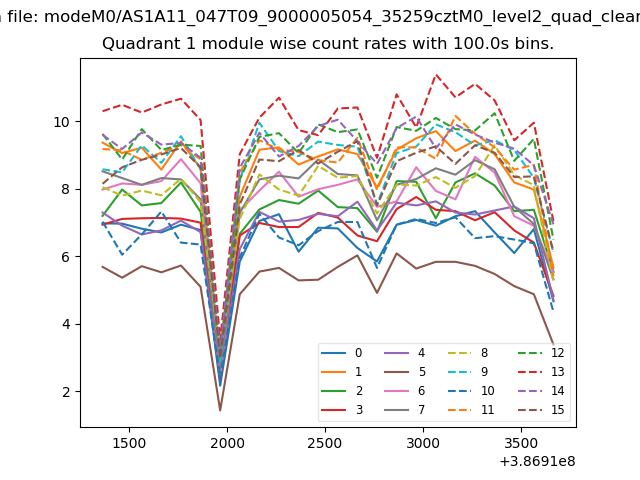
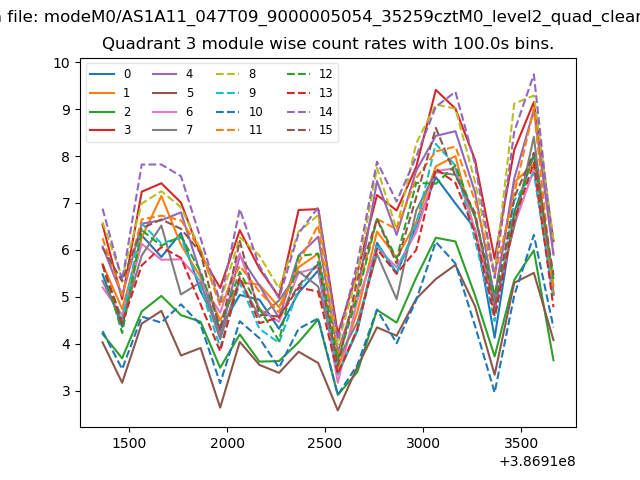
| Module-wise count rates for Quadrant A Data is divided into 100 sec bins |
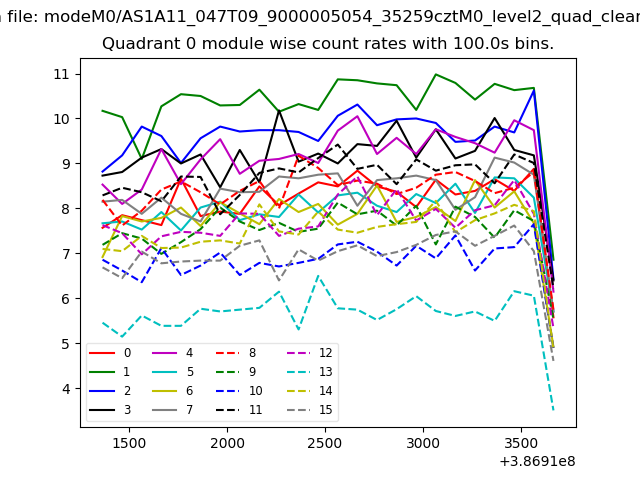 |
 |
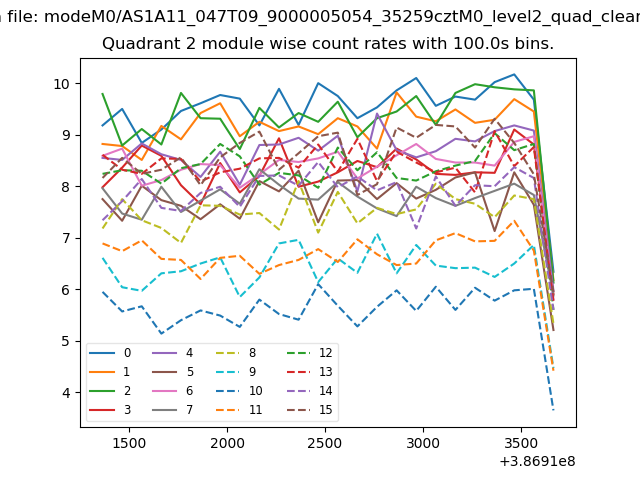
| Module-wise count rates for Quadrant B Data is divided into 100 sec bins |
 |
 |
| Module-wise count rates for Quadrant C Data is divided into 100 sec bins |
 |
 |
| Module-wise count rates for Quadrant D Data is divided into 100 sec bins |
 |
 |
| Parameter | Plot |
|---|---|
| CZT HV Monitor | 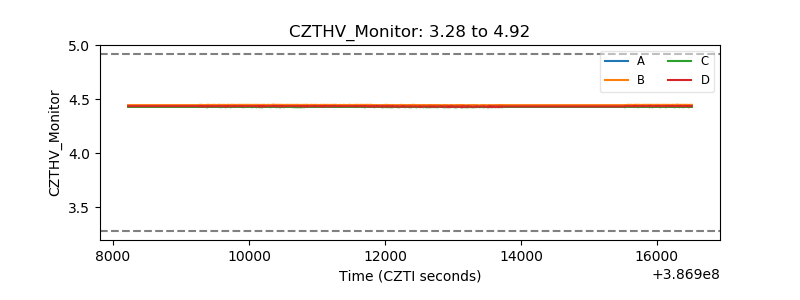 |
| D_VDD | 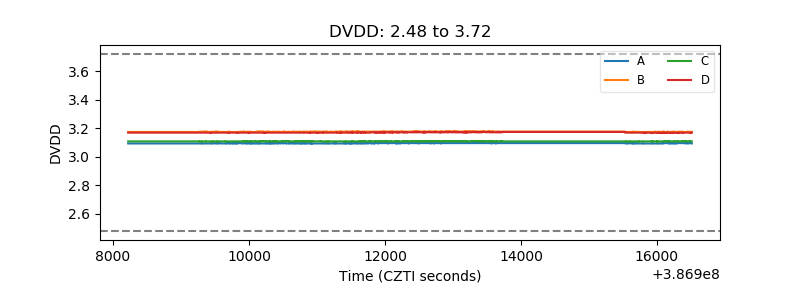 |
| Temperature 1 | 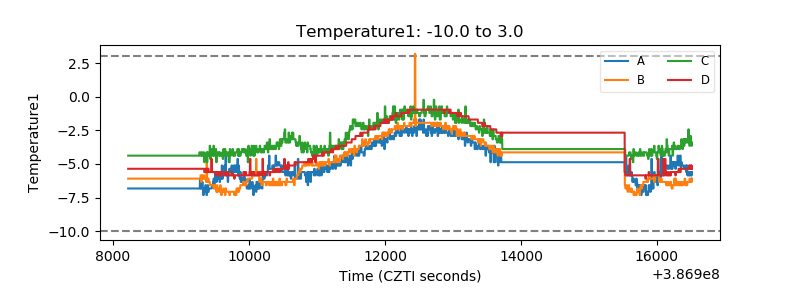 |
| Veto HV Monitor | 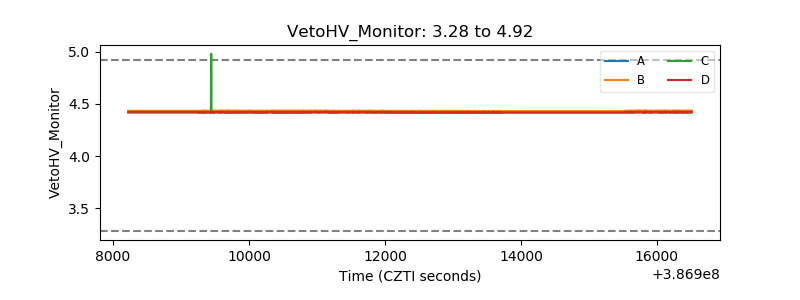 |
| Veto LLD | 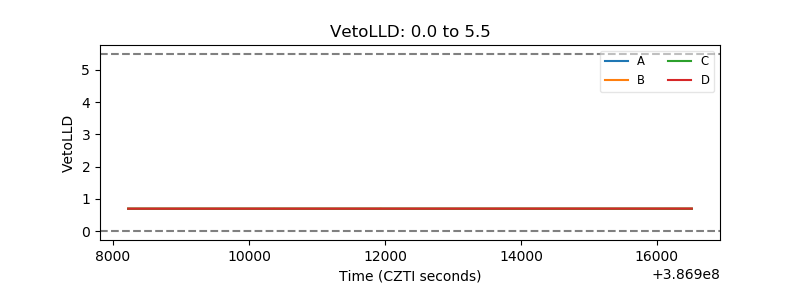 |
| Alpha Counter | 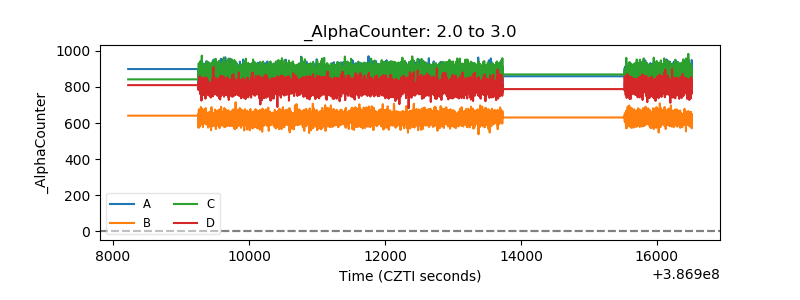 |
| _CPM_Rate | 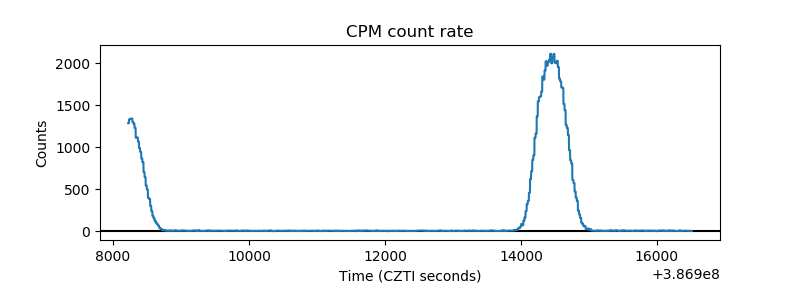 |
| CZT Counter | 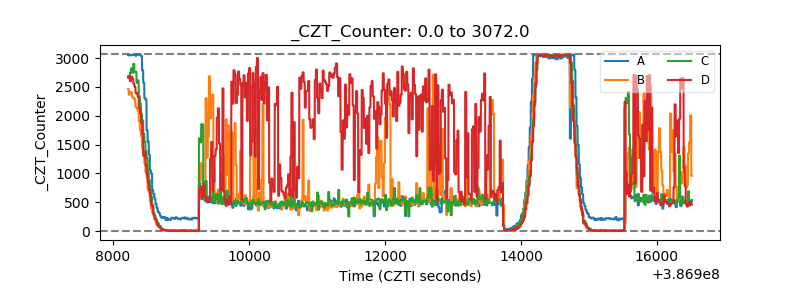 |
| +2.5 Volts monitor | 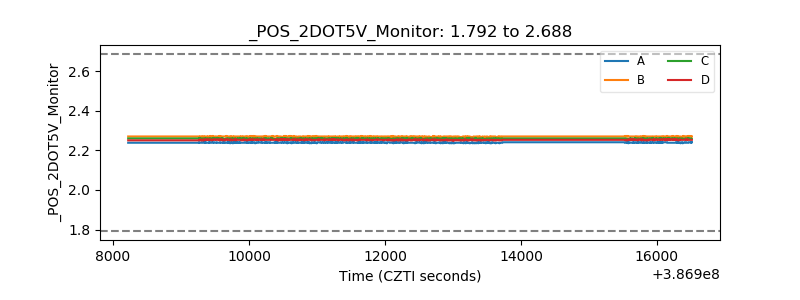 |
| +5 Volts monitor | 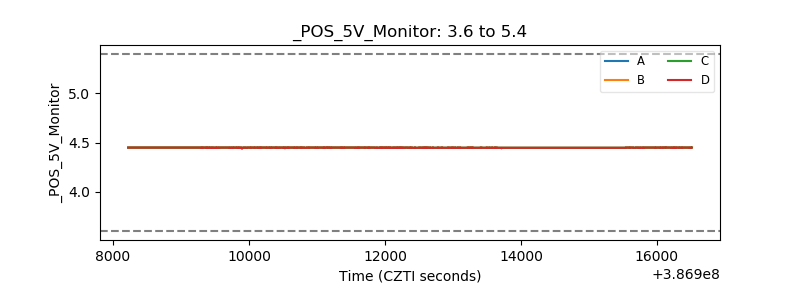 |
| _ROLL_ROT | 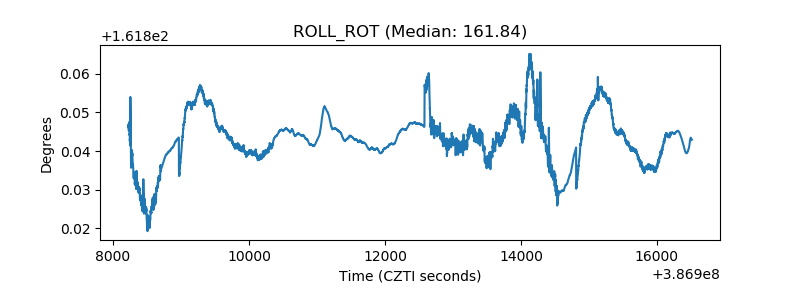 |
| _Roll_DEC | 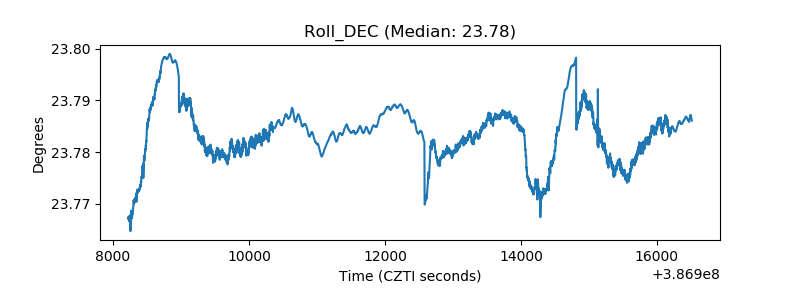 |
| _Roll_RA | 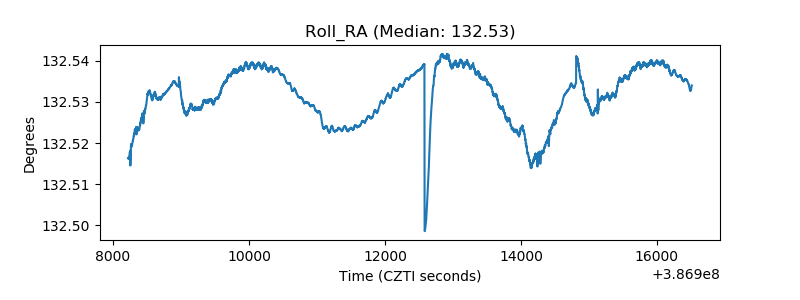 |
| Veto Counter | 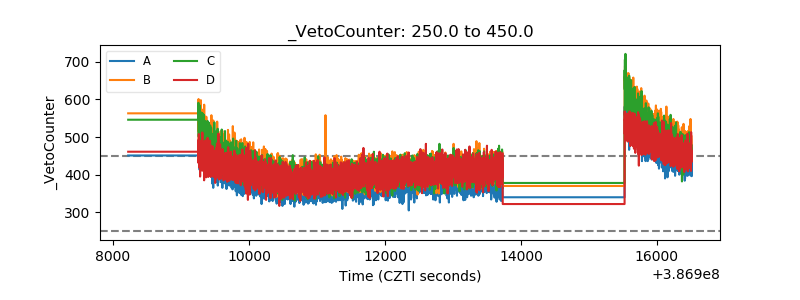 |