| Param | Original file | Final file |
|---|---|---|
| Filename | modeM0/AS1A11_047T09_9000005054_35257cztM0_level2.evt | modeM0/AS1A11_047T09_9000005054_35257cztM0_level2_quad_clean.evt |
| Size (bytes) | 745,966,080 | 56,177,280 |
| Size | 711.4 MB | 53.6 MB |
| Events in quadrant A | 2,862,193 | 358,033 |
| Events in quadrant B | 6,693,912 | 309,415 |
| Events in quadrant C | 3,211,430 | 352,008 |
| Events in quadrant D | 9,425,047 | 267,254 |
| Mode M9 | |||
|---|---|---|---|
| Quadrant | BADHDUFLAG | Total packets | Discarded packets |
| A | 0 | 32 | 0 |
| B | 0 | 32 | 0 |
| C | 0 | 32 | 0 |
| D | 0 | 32 | 0 |
| Mode M0 | |||
|---|---|---|---|
| Quadrant | BADHDUFLAG | Total packets | Discarded packets |
| A | 0 | 12160 | 3 |
| B | 0 | 23888 | 2 |
| C | 0 | 12892 | 2 |
| D | 0 | 32083 | 2 |
| Mode SS | |||
|---|---|---|---|
| Quadrant | BADHDUFLAG | Total packets | Discarded packets |
| A | 0 | 122 | 0 |
| B | 0 | 122 | 0 |
| C | 0 | 122 | 0 |
| D | 0 | 122 | 0 |
| Quadrant | Total seconds | Saturated seconds | Saturation percentage |
|---|---|---|---|
| A | 5912 | 6 | 0.101488% |
| B | 5912 | 1320 | 22.327470% |
| C | 5912 | 70 | 1.184032% |
| D | 5912 | 2143 | 36.248309% |
Noise dominated data is calculated using 1-second bins in cleaned event files. If a bin has >2000 counts, and if more than 50% of those come from <1% of pixels, then it is considered to be noise-dominated and hence unusable.
| Quadrant | # 1 sec bins | Bins with >0 counts | Bins with >2000 counts | High rate bins dominated by noise | Noise dominated (total time) | Noise dominated (detector-on time) | Marked lightcurve |
|---|---|---|---|---|---|---|---|
| A | 9080 | 5914 | 0 | 0 | 0.00% | 0.00% | 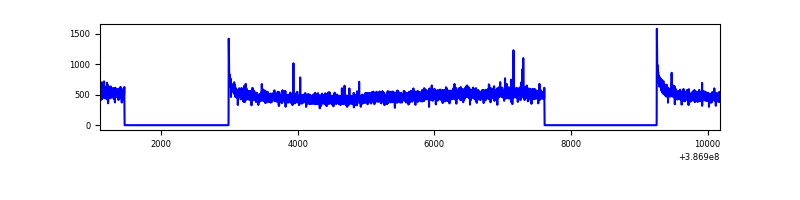 |
| B | 9080 | 5913 | 982 | 982 | 10.81% | 16.61% | 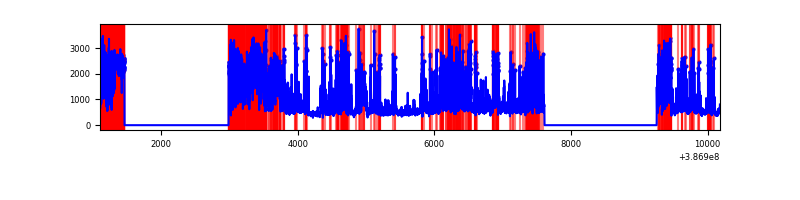 |
| C | 9080 | 5914 | 52 | 52 | 0.57% | 0.88% | 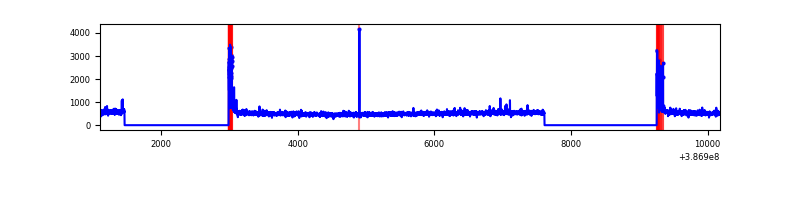 |
| D | 9080 | 5913 | 1880 | 1880 | 20.70% | 31.79% | 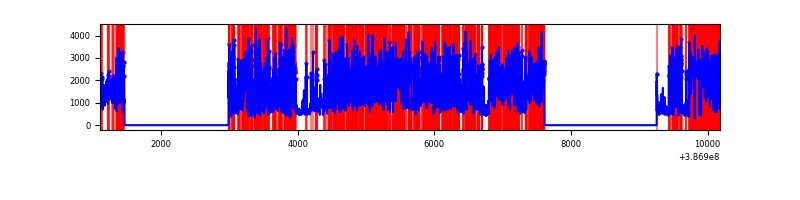 |
Top three noisy pixels from each quadrant. If the there are fewer than three noisy pixels in the level2.evt file, extra rows are filled as -1
| Pixel properties | Quadrant properties | ||||||
|---|---|---|---|---|---|---|---|
| Quadrant | DetID | PixID | Counts | Sigma | Mean | Median | Sigma |
| A | 10 | 83 | 103087 | 713.48 | 706 | 692 | 143.5 |
| A | 13 | 6 | 14157 | 93.82 | 706 | 692 | 143.5 |
| A | 13 | 254 | 10206 | 66.29 | 706 | 692 | 143.5 |
| B | 5 | 236 | 3436649 | 27744.12 | 638 | 623 | 123.8 |
| B | 5 | 172 | 642928 | 5186.28 | 638 | 623 | 123.8 |
| B | 5 | 255 | 47473 | 378.29 | 638 | 623 | 123.8 |
| C | 15 | 214 | 251383 | 1587.52 | 683 | 689 | 157.9 |
| C | 0 | 10 | 230776 | 1457.03 | 683 | 689 | 157.9 |
| C | 14 | 67 | 37855 | 235.35 | 683 | 689 | 157.9 |
| D | 7 | 80 | 5940727 | 40383.14 | 584 | 566 | 147.1 |
| D | 2 | 249 | 391521 | 2657.84 | 584 | 566 | 147.1 |
| D | 12 | 235 | 291894 | 1980.54 | 584 | 566 | 147.1 |
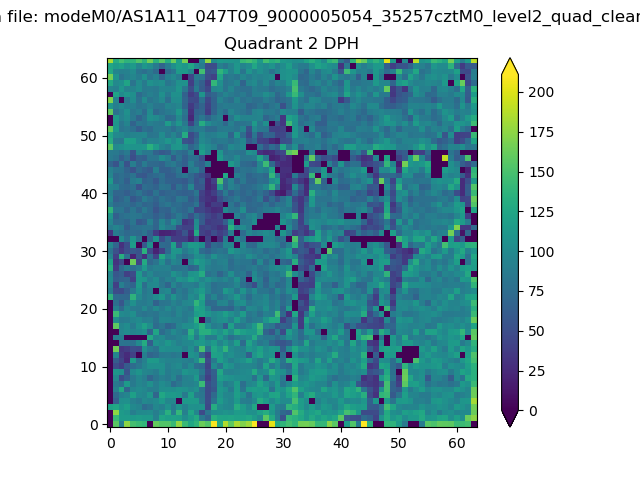
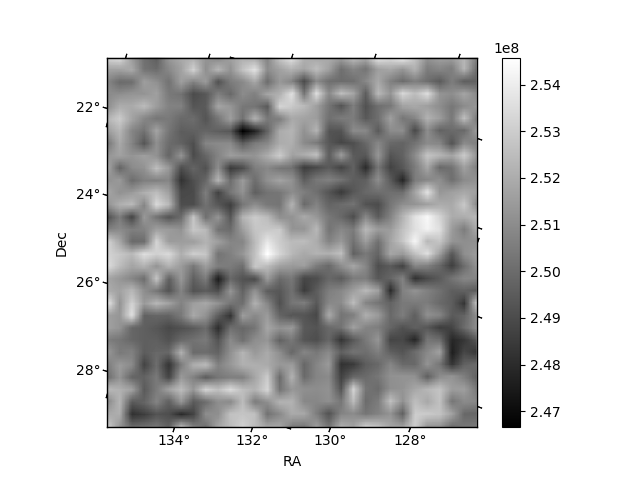
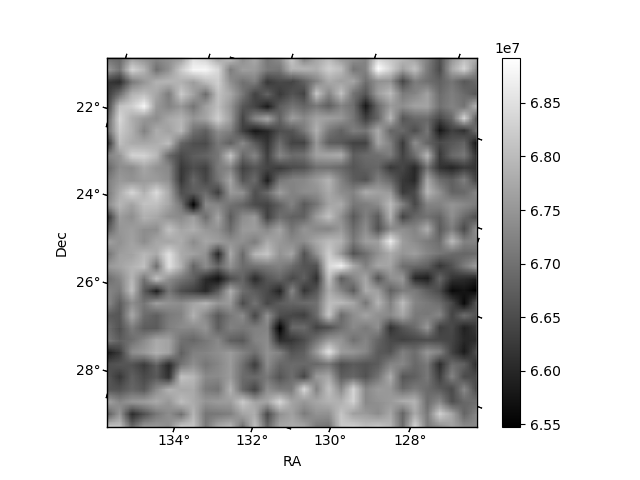
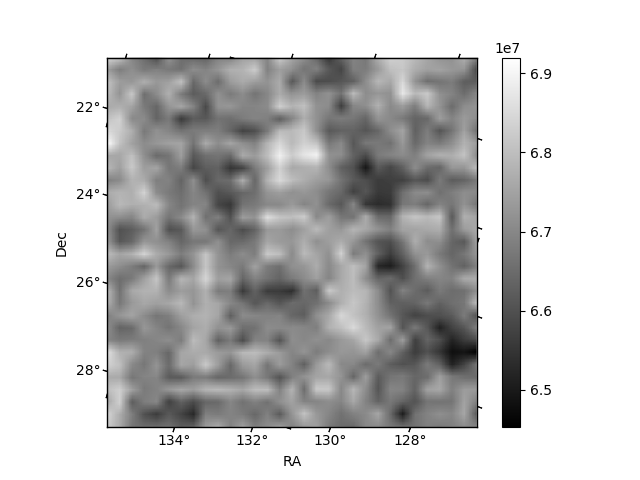
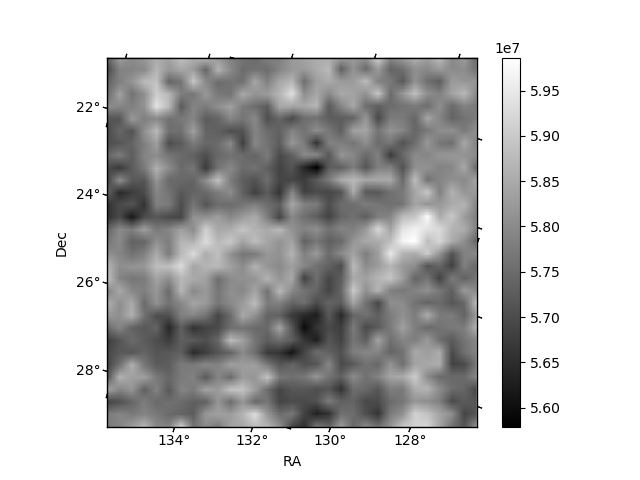
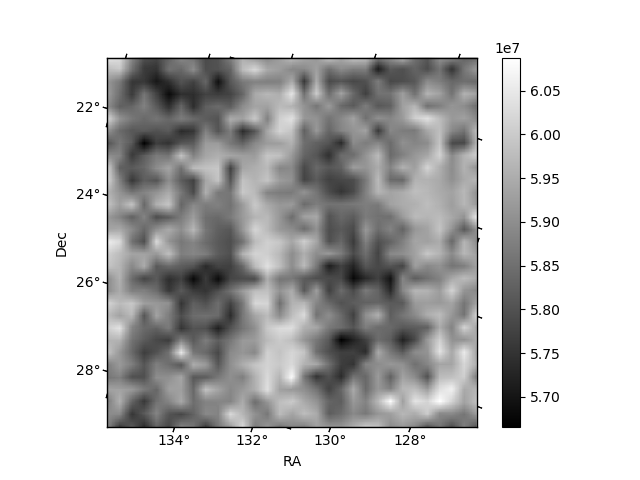
Histogram calculated using DETX and DETY for each event in the final _common_clean file
| Quadrant A | 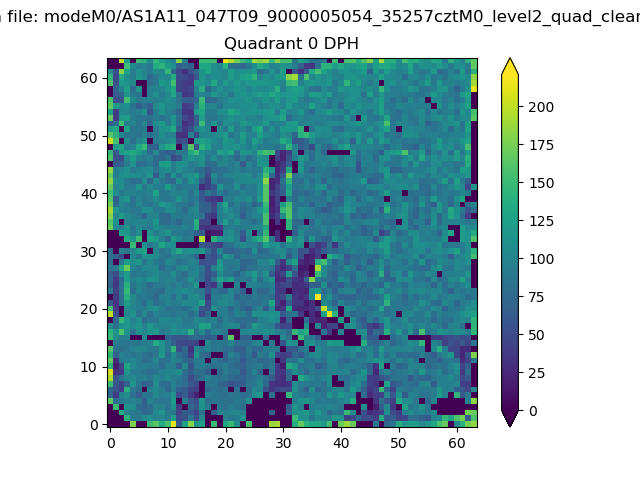 |
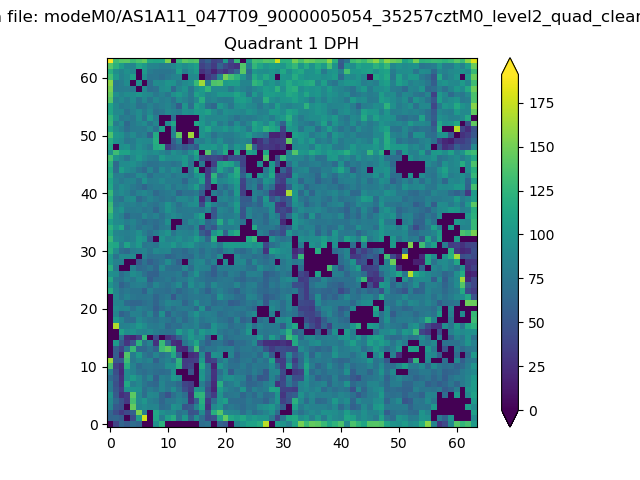 |
Quadrant B |
|---|---|---|---|
| Quadrant D | 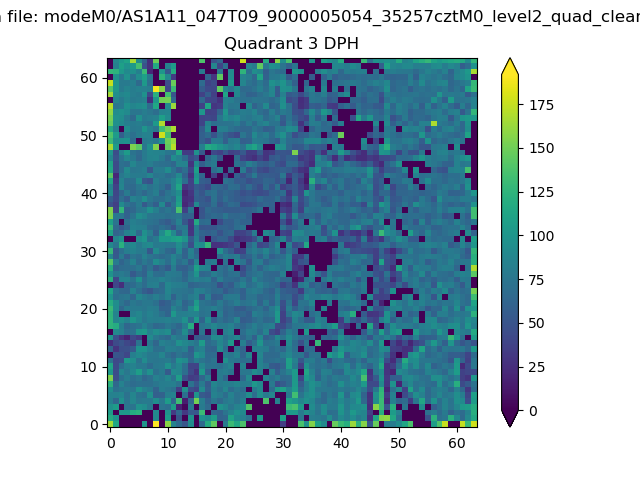 |
 |
Quadrant C |
| Plot type | Count rate plots | Images |
|---|---|---|
| Comparison with Poisson distribution Blue bars denote a histogram of data divided into 1 sec bins. Red curve is a Poisson curve with rate = median count rate of data. |
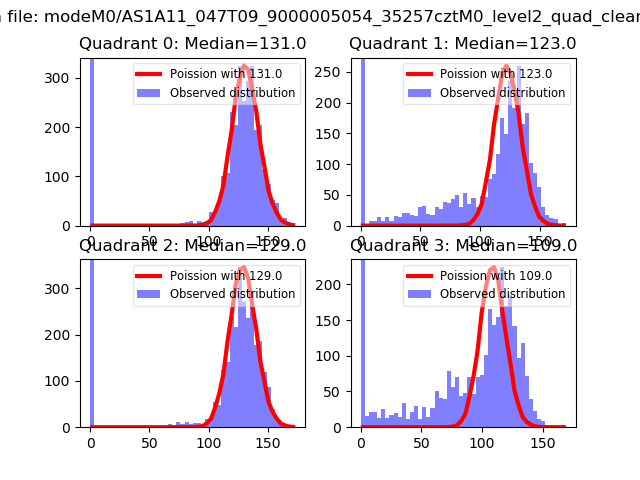 |
 |
| Quadrant-wise count rates Data is divided into 100 sec bins |
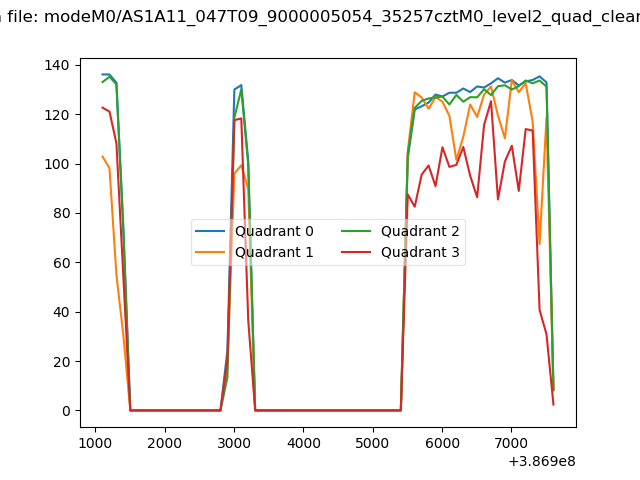 |
|
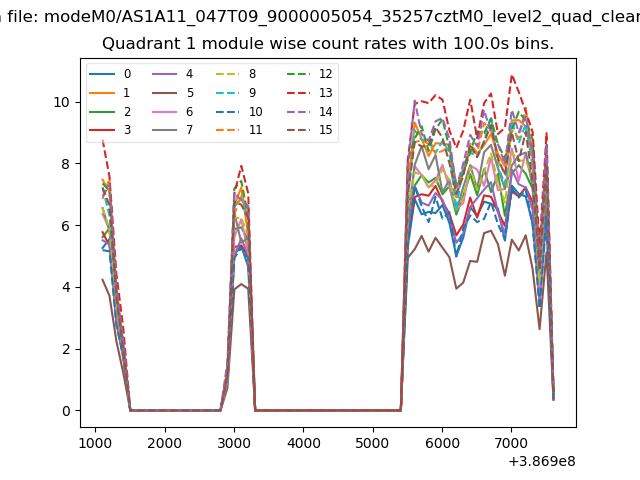
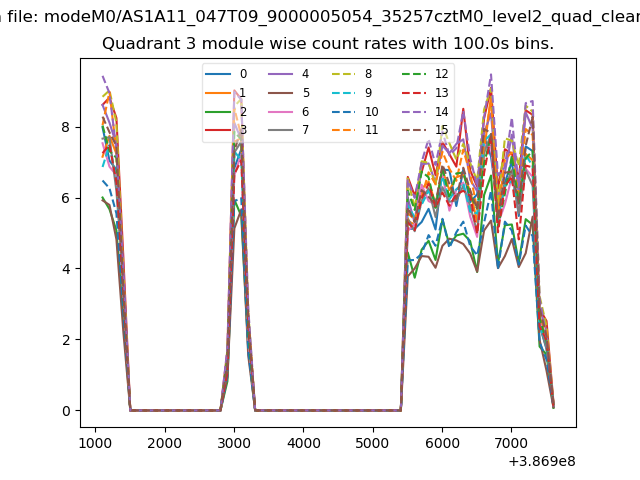
| Module-wise count rates for Quadrant A Data is divided into 100 sec bins |
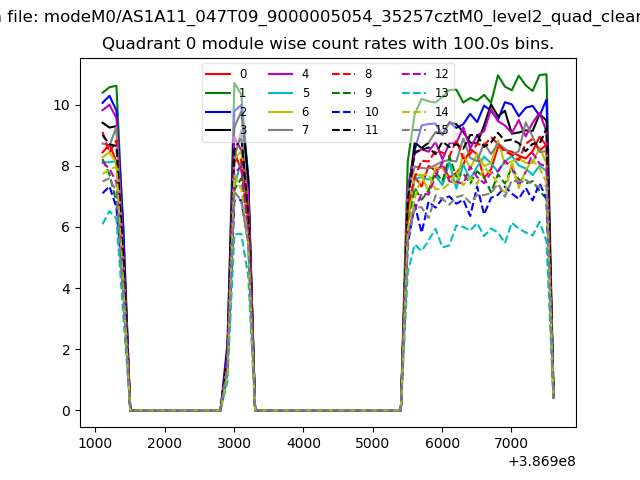 |
 |
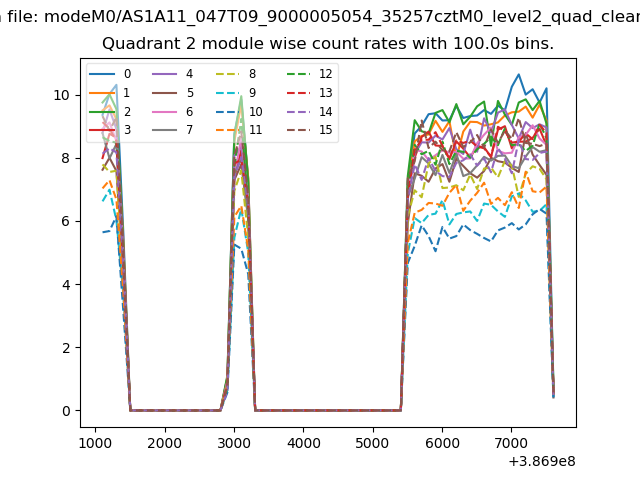
| Module-wise count rates for Quadrant B Data is divided into 100 sec bins |
 |
 |
| Module-wise count rates for Quadrant C Data is divided into 100 sec bins |
 |
 |
| Module-wise count rates for Quadrant D Data is divided into 100 sec bins |
 |
 |
| Parameter | Plot |
|---|---|
| CZT HV Monitor | 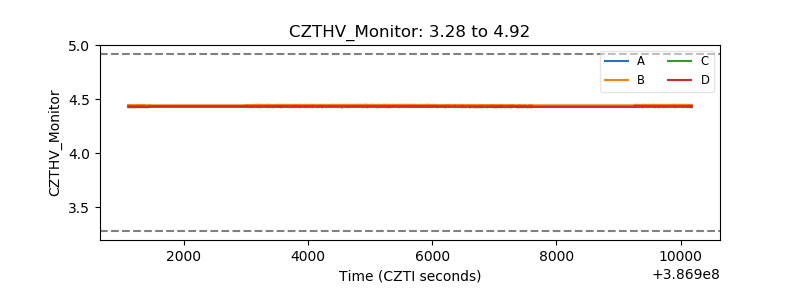 |
| D_VDD | 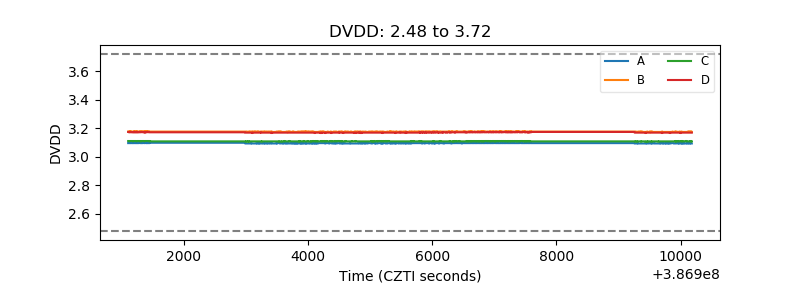 |
| Temperature 1 | 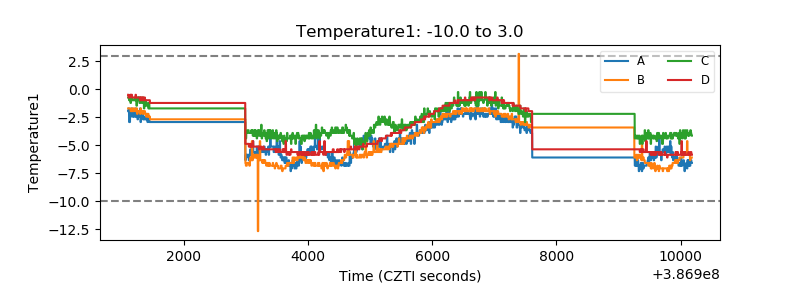 |
| Veto HV Monitor |  |
| Veto LLD | 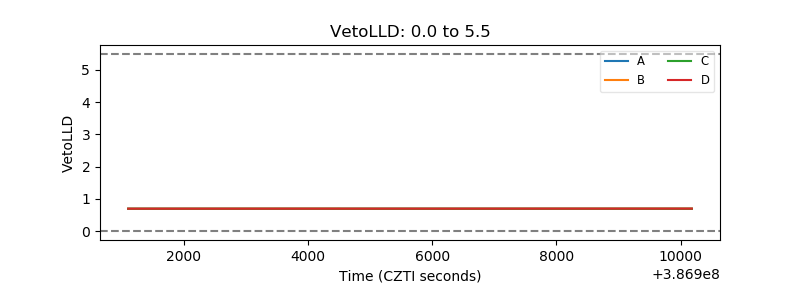 |
| Alpha Counter | 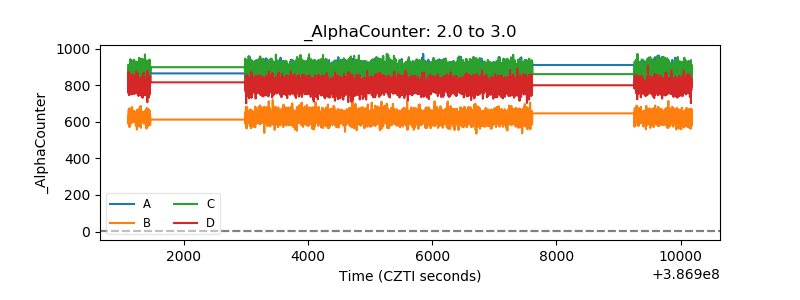 |
| _CPM_Rate | 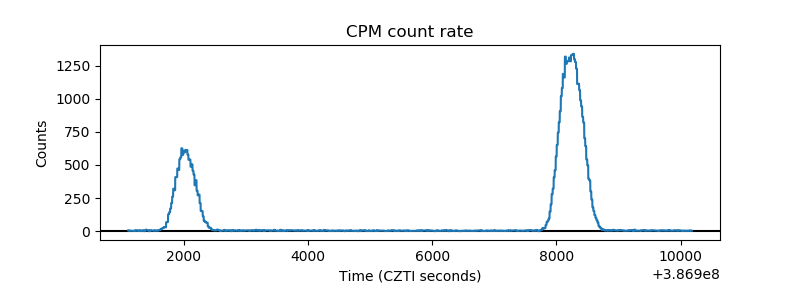 |
| CZT Counter | 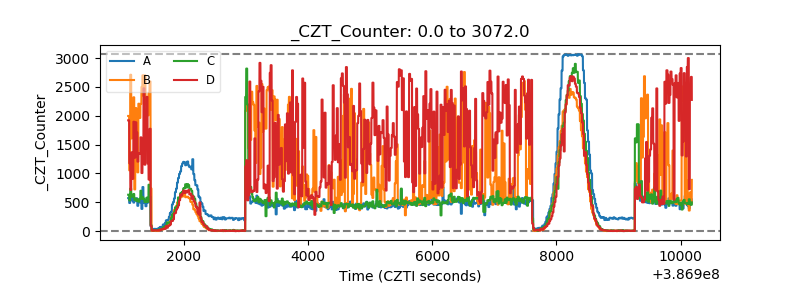 |
| +2.5 Volts monitor | 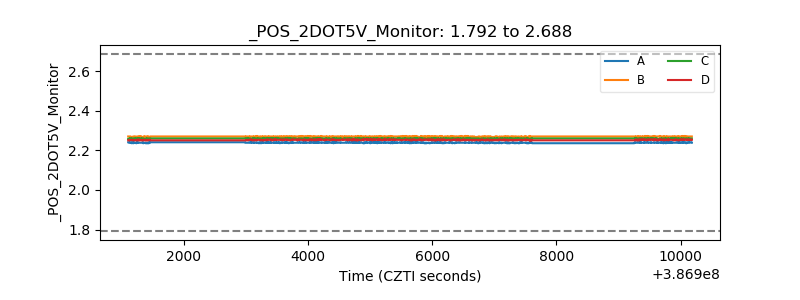 |
| +5 Volts monitor | 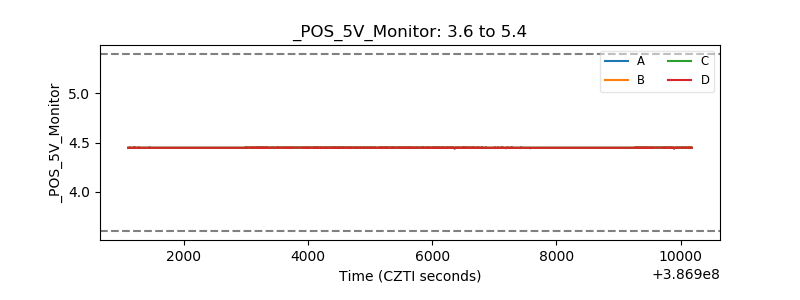 |
| _ROLL_ROT |  |
| _Roll_DEC | 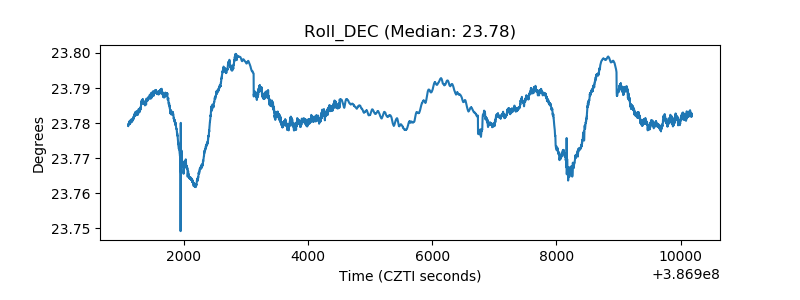 |
| _Roll_RA | 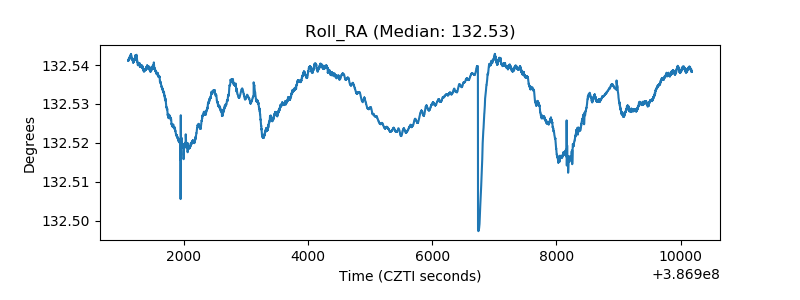 |
| Veto Counter | 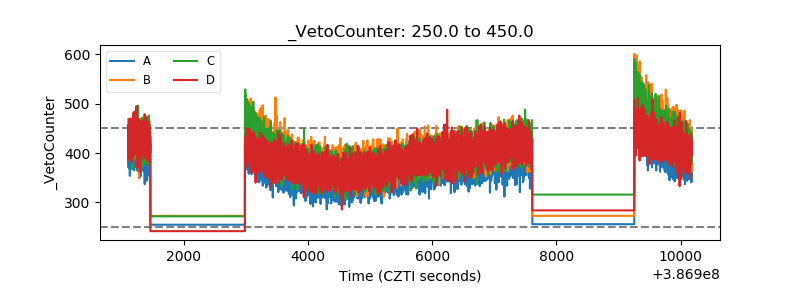 |