| Param | Original file | Final file |
|---|---|---|
| Filename | modeM0/AS1A11_047T09_9000005054_35256cztM0_level2.evt | modeM0/AS1A11_047T09_9000005054_35256cztM0_level2_quad_clean.evt |
| Size (bytes) | 1,410,082,560 | 129,021,120 |
| Size | 1.3 GB | 123.0 MB |
| Events in quadrant A | 5,775,351 | 851,513 |
| Events in quadrant B | 17,152,163 | 663,569 |
| Events in quadrant C | 6,424,233 | 840,732 |
| Events in quadrant D | 12,542,935 | 717,293 |
| Mode M9 | |||
|---|---|---|---|
| Quadrant | BADHDUFLAG | Total packets | Discarded packets |
| A | 0 | 42 | 0 |
| B | 0 | 42 | 0 |
| C | 0 | 42 | 0 |
| D | 0 | 42 | 0 |
| Mode M0 | |||
|---|---|---|---|
| Quadrant | BADHDUFLAG | Total packets | Discarded packets |
| A | 0 | 24784 | 4 |
| B | 0 | 59231 | 3 |
| C | 0 | 26073 | 3 |
| D | 0 | 45618 | 3 |
| Mode SS | |||
|---|---|---|---|
| Quadrant | BADHDUFLAG | Total packets | Discarded packets |
| A | 0 | 248 | 0 |
| B | 0 | 248 | 0 |
| C | 0 | 248 | 0 |
| D | 0 | 248 | 0 |
| Quadrant | Total seconds | Saturated seconds | Saturation percentage |
|---|---|---|---|
| A | 12029 | 17 | 0.141325% |
| B | 12029 | 4494 | 37.359714% |
| C | 12029 | 100 | 0.831324% |
| D | 12029 | 1815 | 15.088536% |
Noise dominated data is calculated using 1-second bins in cleaned event files. If a bin has >2000 counts, and if more than 50% of those come from <1% of pixels, then it is considered to be noise-dominated and hence unusable.
| Quadrant | # 1 sec bins | Bins with >0 counts | Bins with >2000 counts | High rate bins dominated by noise | Noise dominated (total time) | Noise dominated (detector-on time) | Marked lightcurve |
|---|---|---|---|---|---|---|---|
| A | 16267 | 12032 | 1 | 1 | 0.01% | 0.01% | 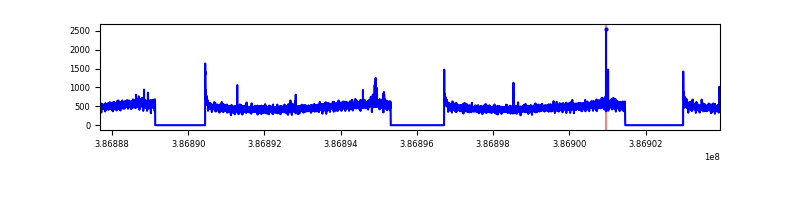 |
| B | 16267 | 12030 | 3065 | 3065 | 18.84% | 25.48% | 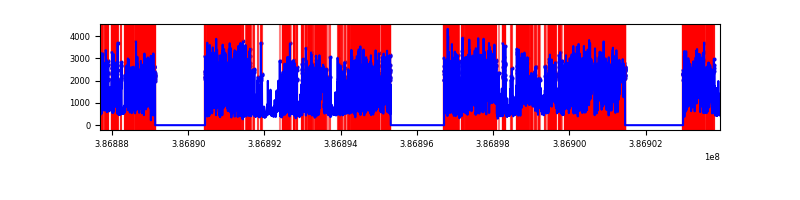 |
| C | 16267 | 12032 | 76 | 76 | 0.47% | 0.63% | 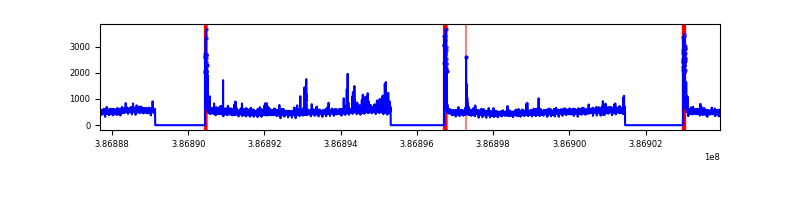 |
| D | 16267 | 12032 | 1579 | 1579 | 9.71% | 13.12% | 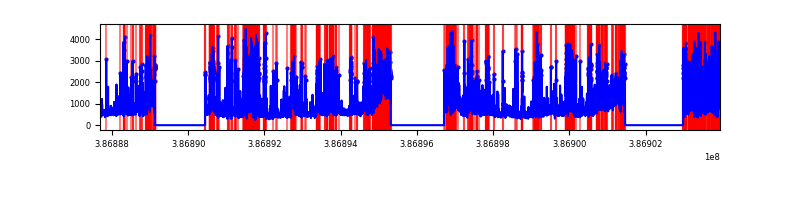 |
Top three noisy pixels from each quadrant. If the there are fewer than three noisy pixels in the level2.evt file, extra rows are filled as -1
| Pixel properties | Quadrant properties | ||||||
|---|---|---|---|---|---|---|---|
| Quadrant | DetID | PixID | Counts | Sigma | Mean | Median | Sigma |
| A | 10 | 83 | 174408 | 596.28 | 1433 | 1404 | 290.1 |
| A | 13 | 6 | 27519 | 90.01 | 1433 | 1404 | 290.1 |
| A | 13 | 254 | 20305 | 65.14 | 1433 | 1404 | 290.1 |
| B | 5 | 236 | 10952158 | 46985.5 | 1207 | 1174 | 233.1 |
| B | 5 | 172 | 1244307 | 5333.7 | 1207 | 1174 | 233.1 |
| B | 4 | 232 | 91973 | 389.58 | 1207 | 1174 | 233.1 |
| C | 15 | 214 | 502341 | 1550.14 | 1387 | 1398 | 323.2 |
| C | 0 | 10 | 404574 | 1247.61 | 1387 | 1398 | 323.2 |
| C | 14 | 67 | 58870 | 177.84 | 1387 | 1398 | 323.2 |
| D | 7 | 80 | 4273893 | 13545.46 | 1294 | 1258 | 315.4 |
| D | 12 | 235 | 915578 | 2898.65 | 1294 | 1258 | 315.4 |
| D | 8 | 195 | 450634 | 1424.65 | 1294 | 1258 | 315.4 |
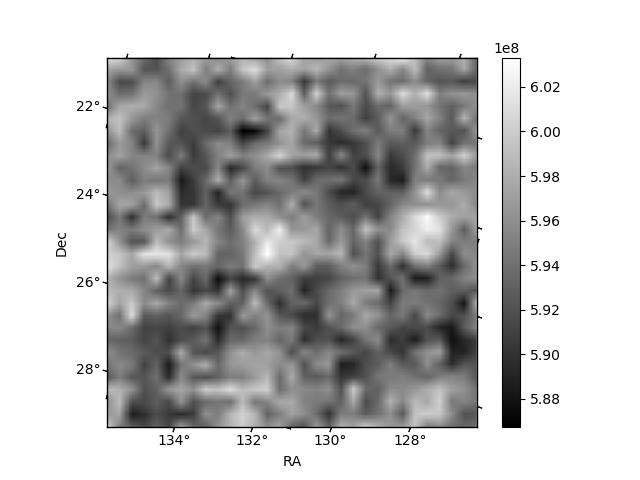
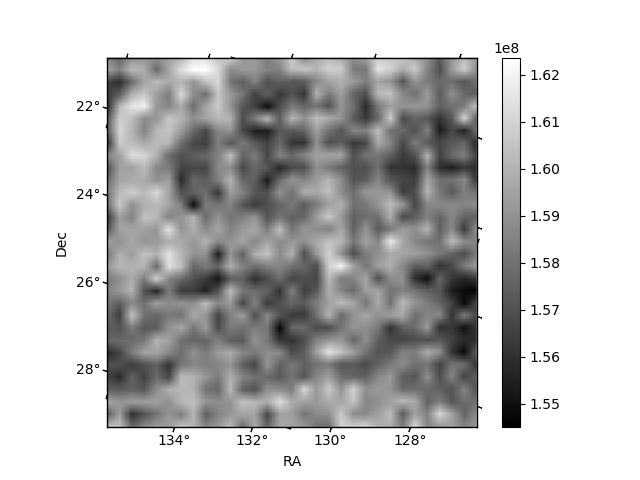
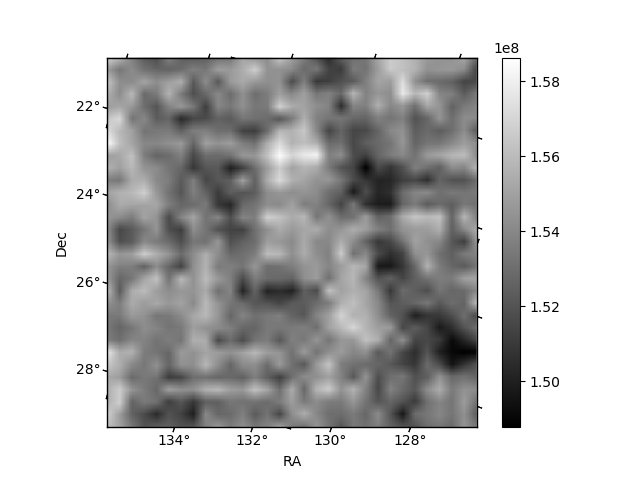
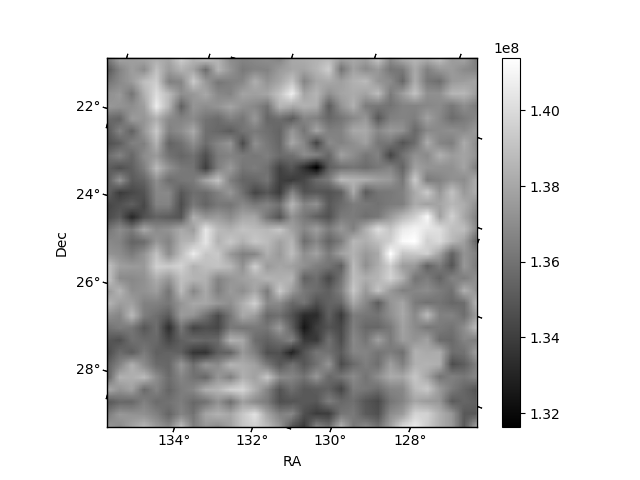
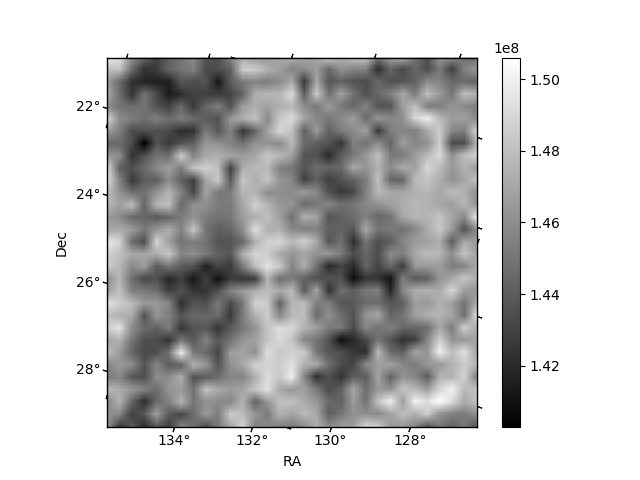
Histogram calculated using DETX and DETY for each event in the final _common_clean file
| Quadrant A | 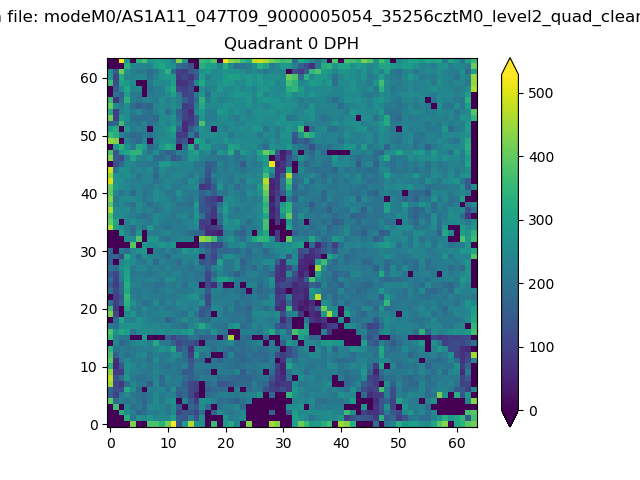 |
 |
Quadrant B |
|---|---|---|---|
| Quadrant D | 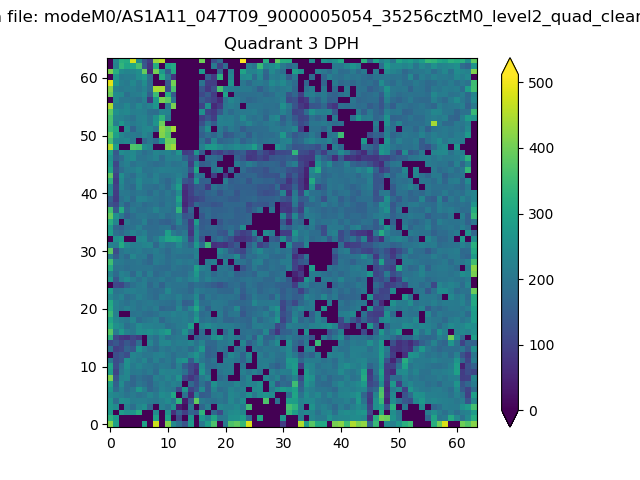 |
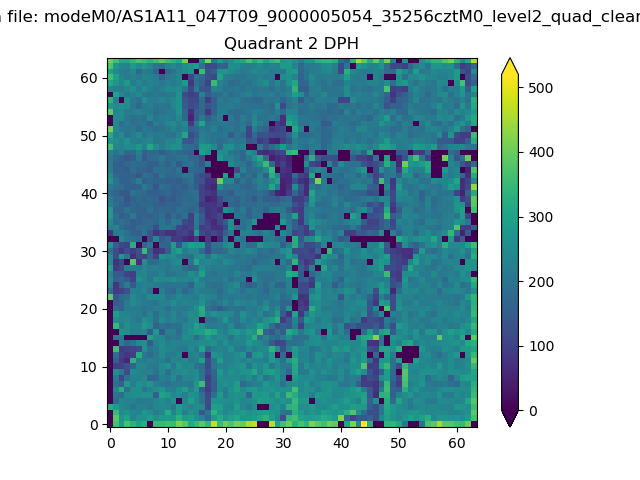 |
Quadrant C |
| Plot type | Count rate plots | Images |
|---|---|---|
| Comparison with Poisson distribution Blue bars denote a histogram of data divided into 1 sec bins. Red curve is a Poisson curve with rate = median count rate of data. |
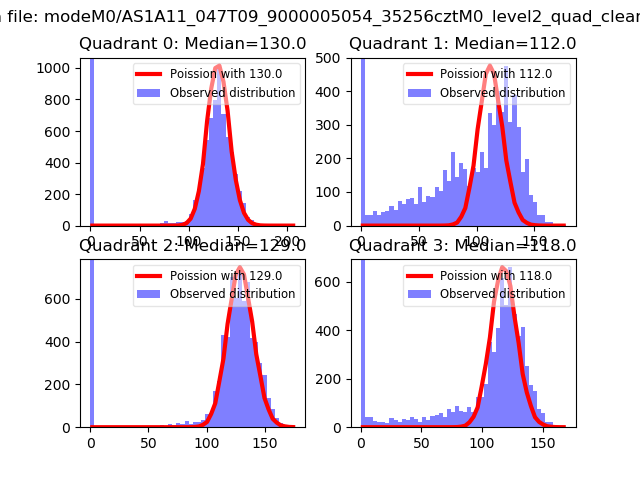 |
 |
| Quadrant-wise count rates Data is divided into 100 sec bins |
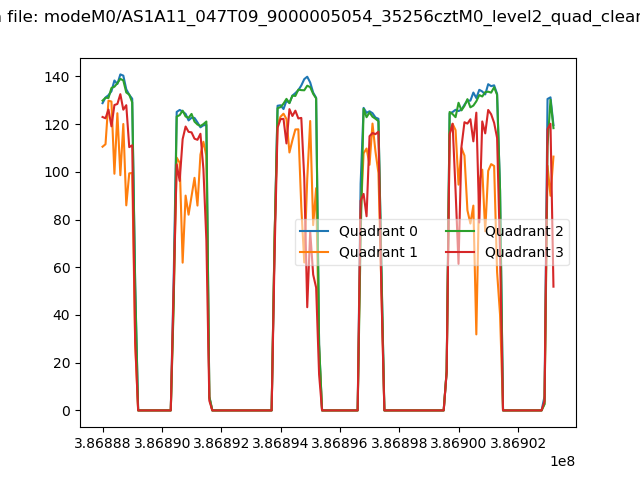 |
|
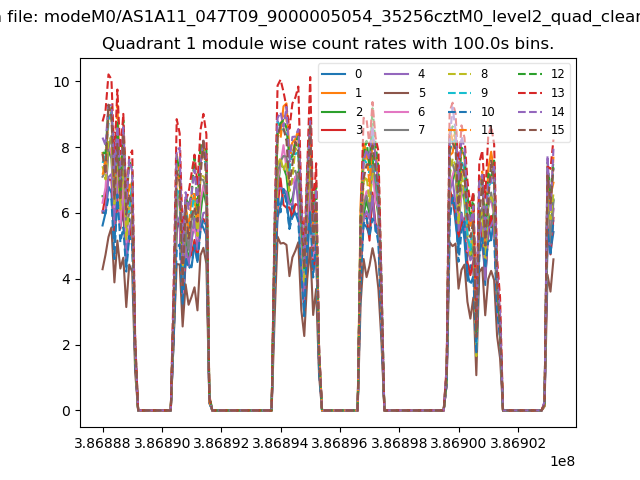
| Module-wise count rates for Quadrant A Data is divided into 100 sec bins |
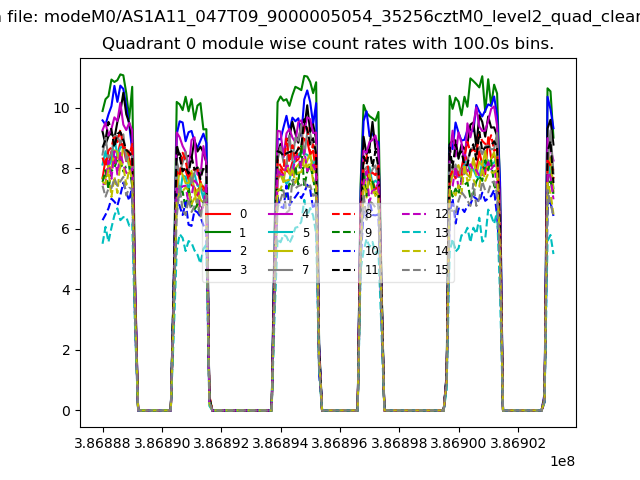 |
 |
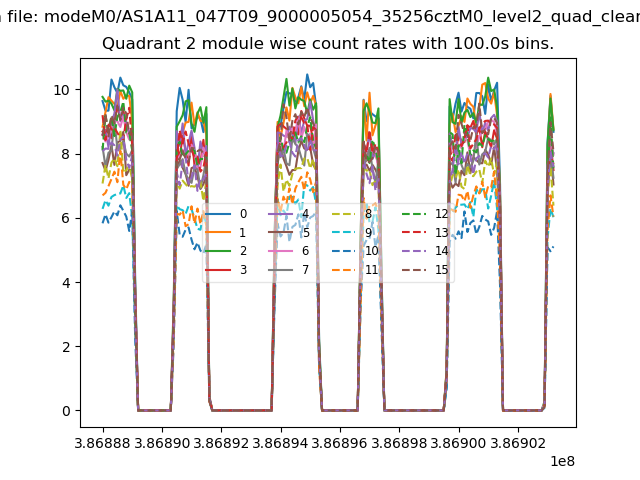
| Module-wise count rates for Quadrant B Data is divided into 100 sec bins |
 |
 |
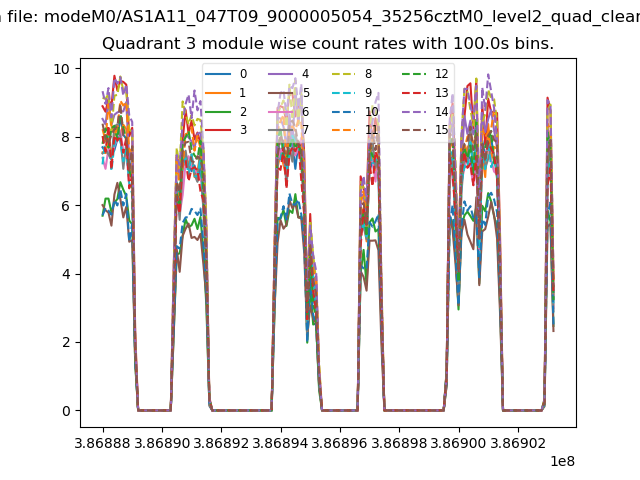
| Module-wise count rates for Quadrant C Data is divided into 100 sec bins |
 |
 |
| Module-wise count rates for Quadrant D Data is divided into 100 sec bins |
 |
 |
| Parameter | Plot |
|---|---|
| CZT HV Monitor | 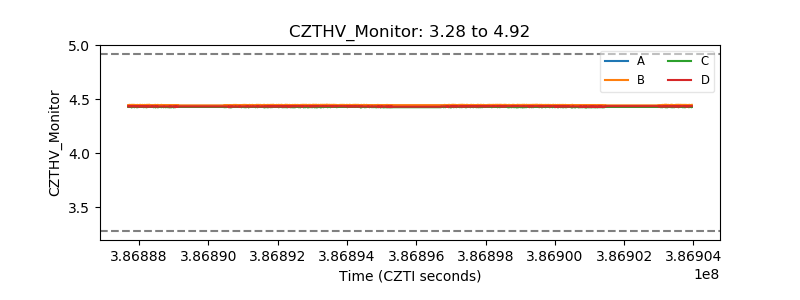 |
| D_VDD | 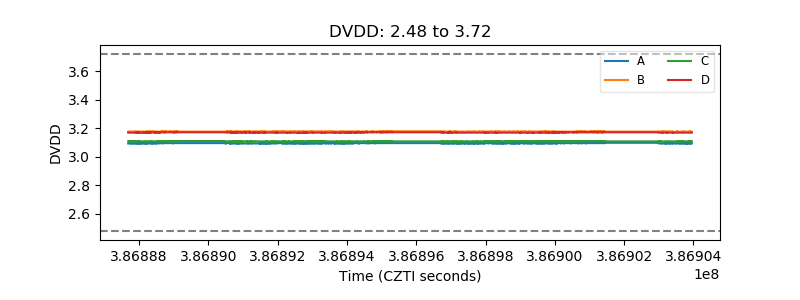 |
| Temperature 1 |  |
| Veto HV Monitor | 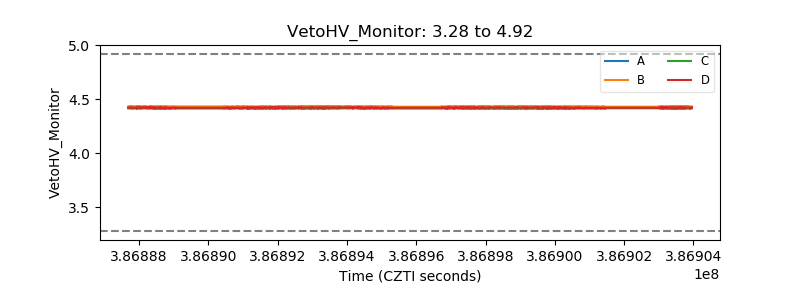 |
| Veto LLD | 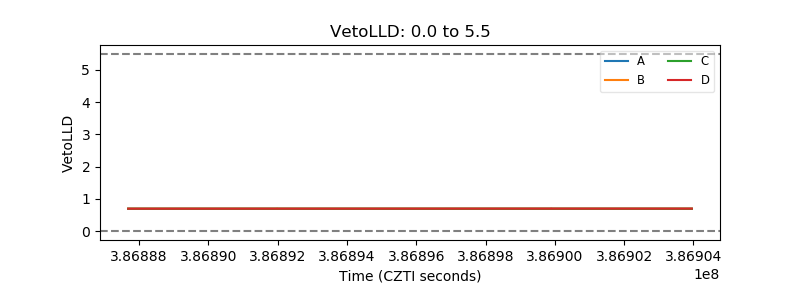 |
| Alpha Counter | 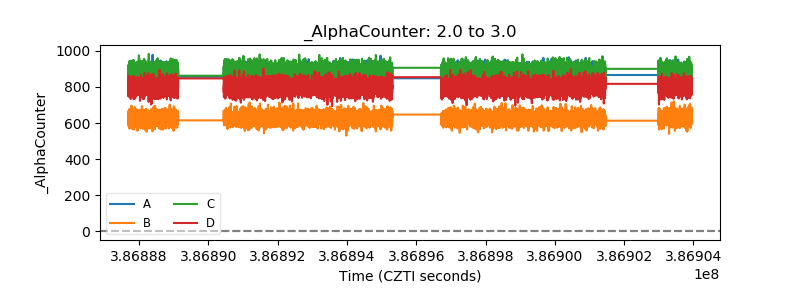 |
| _CPM_Rate | 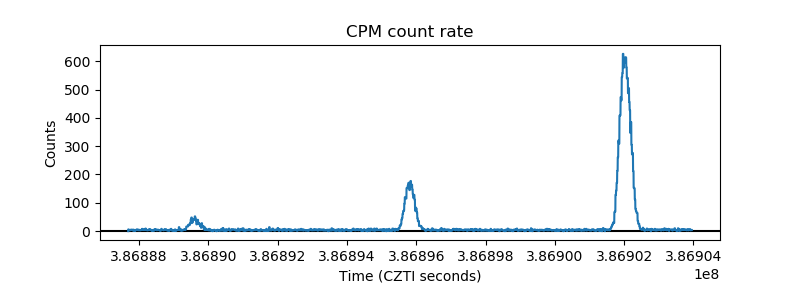 |
| CZT Counter | 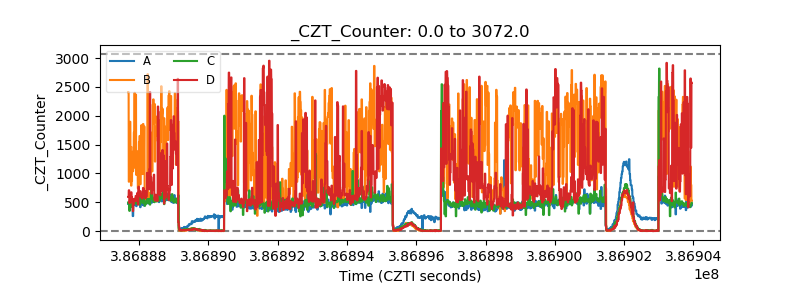 |
| +2.5 Volts monitor | 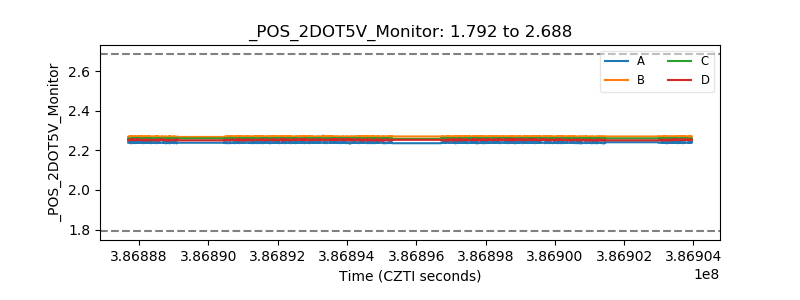 |
| +5 Volts monitor | 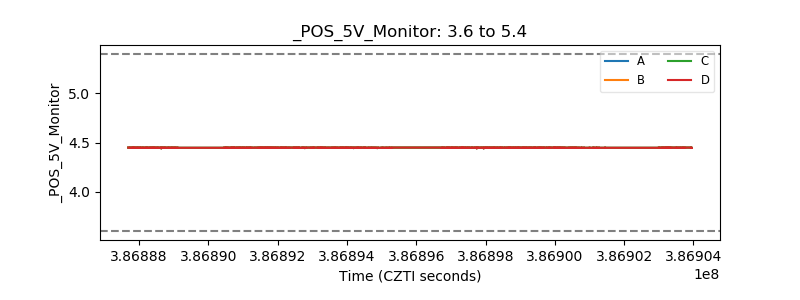 |
| _ROLL_ROT | 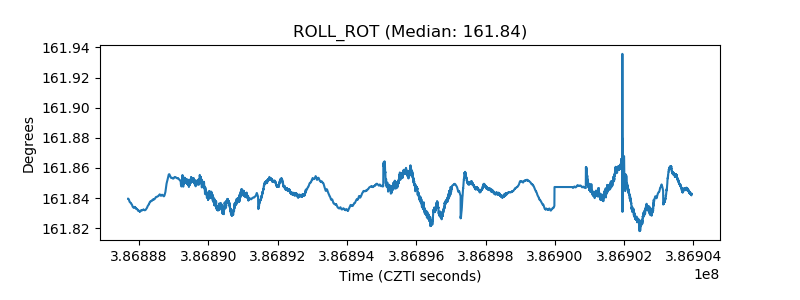 |
| _Roll_DEC | 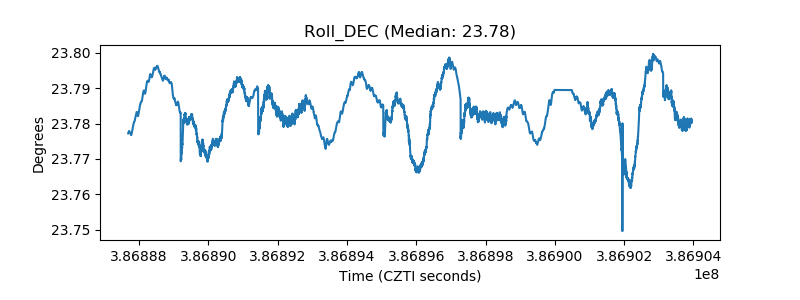 |
| _Roll_RA | 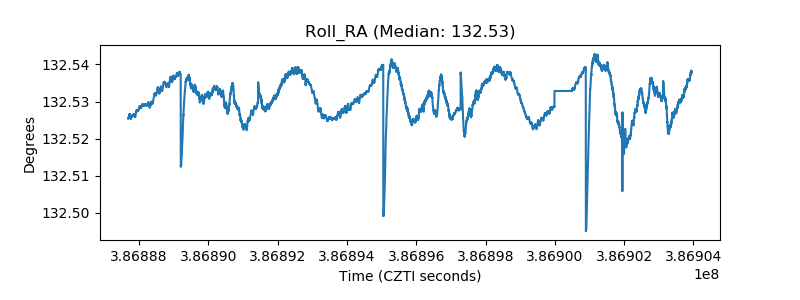 |
| Veto Counter |  |