| Param | Original file | Final file |
|---|---|---|
| Filename | modeM0/AS1A11_047T09_9000005054_35252cztM0_level2.evt | modeM0/AS1A11_047T09_9000005054_35252cztM0_level2_quad_clean.evt |
| Size (bytes) | 678,801,600 | 66,542,400 |
| Size | 647.4 MB | 63.5 MB |
| Events in quadrant A | 2,756,773 | 448,189 |
| Events in quadrant B | 8,353,969 | 349,292 |
| Events in quadrant C | 3,153,206 | 436,866 |
| Events in quadrant D | 5,900,210 | 372,525 |
| Mode M9 | |||
|---|---|---|---|
| Quadrant | BADHDUFLAG | Total packets | Discarded packets |
| A | 0 | 15 | 0 |
| B | 0 | 15 | 0 |
| C | 0 | 15 | 0 |
| D | 0 | 16 | 0 |
| Mode M0 | |||
|---|---|---|---|
| Quadrant | BADHDUFLAG | Total packets | Discarded packets |
| A | 0 | 12015 | 3 |
| B | 0 | 28856 | 2 |
| C | 0 | 12774 | 2 |
| D | 0 | 21535 | 2 |
| Mode SS | |||
|---|---|---|---|
| Quadrant | BADHDUFLAG | Total packets | Discarded packets |
| A | 0 | 120 | 0 |
| B | 0 | 120 | 0 |
| C | 0 | 120 | 0 |
| D | 0 | 120 | 0 |
| Quadrant | Total seconds | Saturated seconds | Saturation percentage |
|---|---|---|---|
| A | 5815 | 14 | 0.240757% |
| B | 5815 | 1954 | 33.602752% |
| C | 5815 | 119 | 2.046432% |
| D | 5815 | 805 | 13.843508% |
Noise dominated data is calculated using 1-second bins in cleaned event files. If a bin has >2000 counts, and if more than 50% of those come from <1% of pixels, then it is considered to be noise-dominated and hence unusable.
| Quadrant | # 1 sec bins | Bins with >0 counts | Bins with >2000 counts | High rate bins dominated by noise | Noise dominated (total time) | Noise dominated (detector-on time) | Marked lightcurve |
|---|---|---|---|---|---|---|---|
| A | 7188 | 5816 | 2 | 2 | 0.03% | 0.03% | 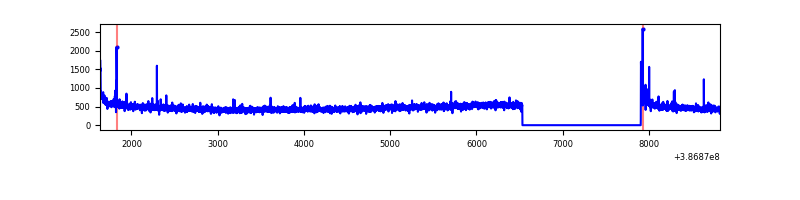 |
| B | 7188 | 5816 | 1489 | 1489 | 20.72% | 25.60% | 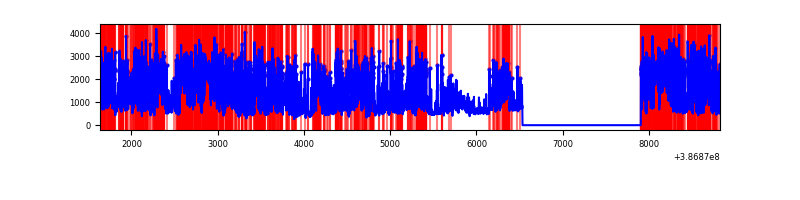 |
| C | 7188 | 5816 | 91 | 91 | 1.27% | 1.56% | 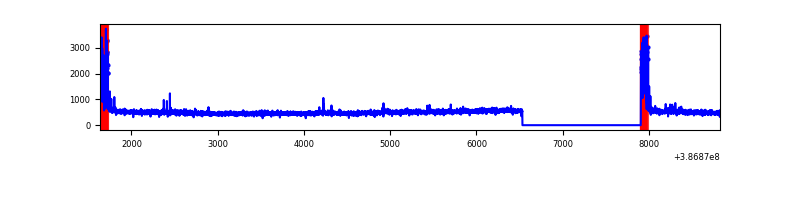 |
| D | 7187 | 5815 | 716 | 716 | 9.96% | 12.31% | 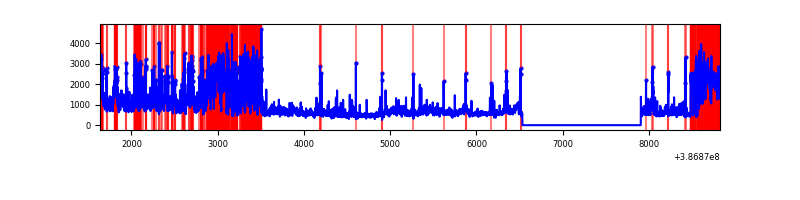 |
Top three noisy pixels from each quadrant. If the there are fewer than three noisy pixels in the level2.evt file, extra rows are filled as -1
| Pixel properties | Quadrant properties | ||||||
|---|---|---|---|---|---|---|---|
| Quadrant | DetID | PixID | Counts | Sigma | Mean | Median | Sigma |
| A | 10 | 83 | 105649 | 764.54 | 673 | 661 | 137.3 |
| A | 7 | 191 | 16003 | 111.72 | 673 | 661 | 137.3 |
| A | 13 | 6 | 13217 | 91.43 | 673 | 661 | 137.3 |
| B | 5 | 236 | 5015943 | 45242.11 | 579 | 567 | 110.9 |
| B | 5 | 172 | 891140 | 8033.57 | 579 | 567 | 110.9 |
| B | 4 | 232 | 77868 | 697.31 | 579 | 567 | 110.9 |
| C | 0 | 10 | 327659 | 2161.25 | 651 | 657 | 151.3 |
| C | 15 | 214 | 244060 | 1608.72 | 651 | 657 | 151.3 |
| C | 14 | 67 | 26935 | 173.68 | 651 | 657 | 151.3 |
| D | 10 | 118 | 1386300 | 9205.95 | 619 | 604 | 150.5 |
| D | 8 | 195 | 1193355 | 7924.1 | 619 | 604 | 150.5 |
| D | 12 | 227 | 478892 | 3177.53 | 619 | 604 | 150.5 |
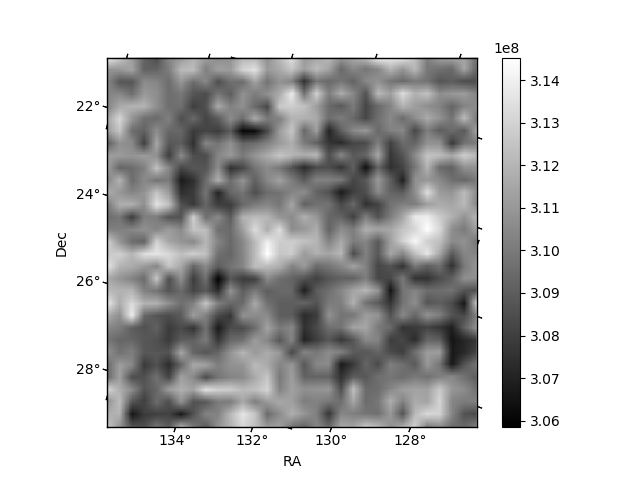
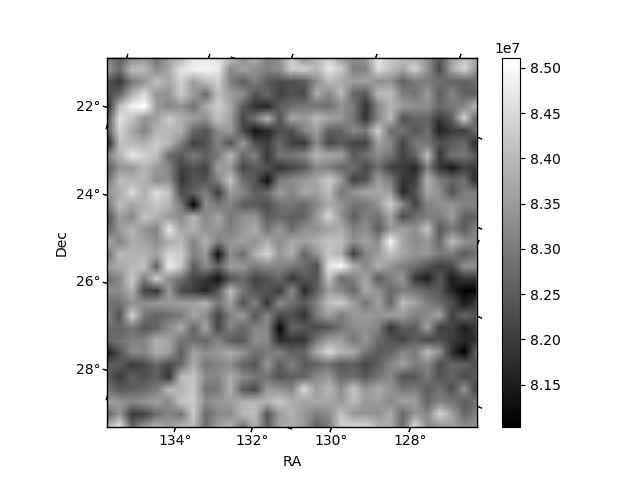
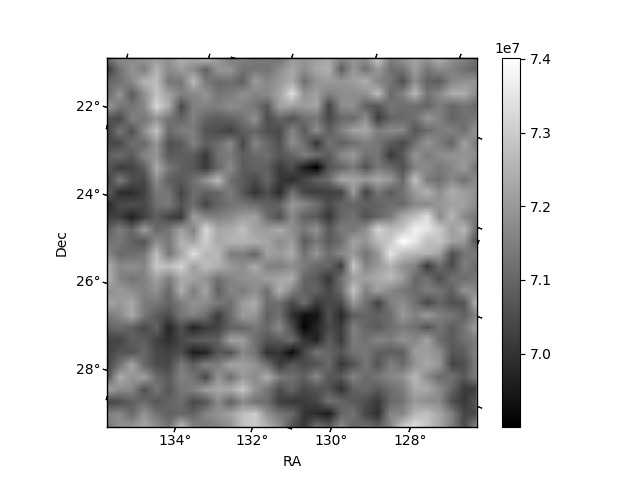
Histogram calculated using DETX and DETY for each event in the final _common_clean file
| Quadrant A | 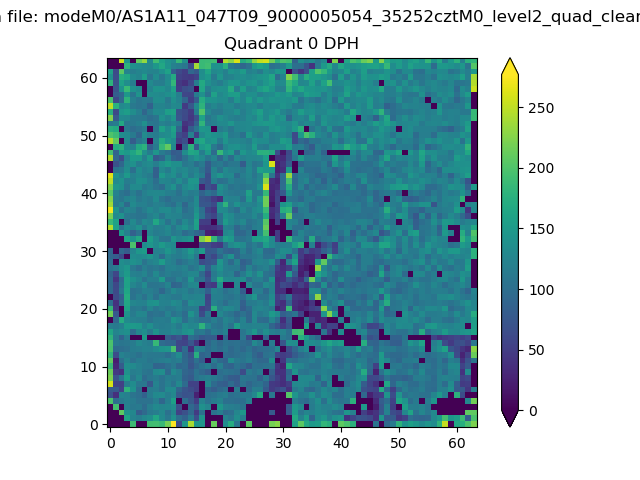 |
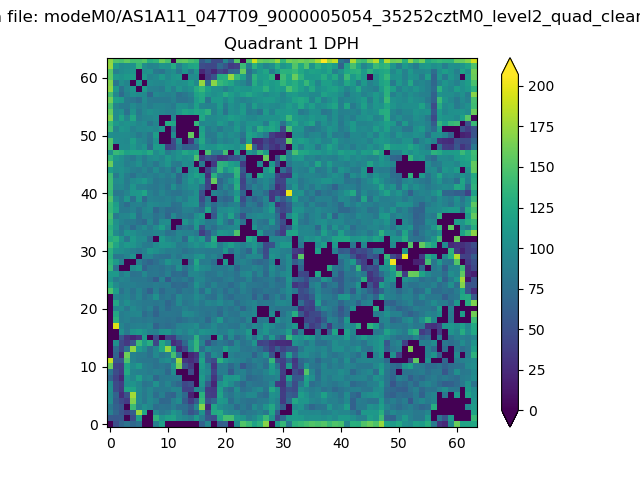 |
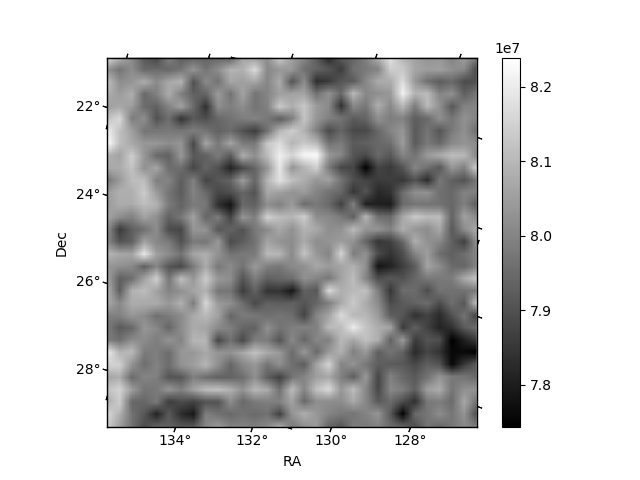
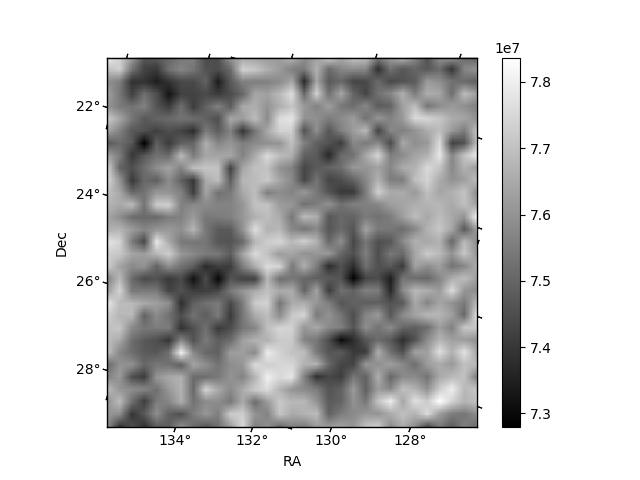
Quadrant B |
|---|---|---|---|
| Quadrant D | 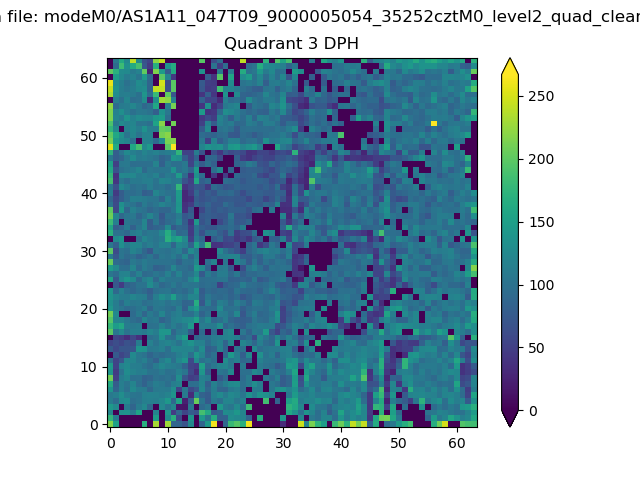 |
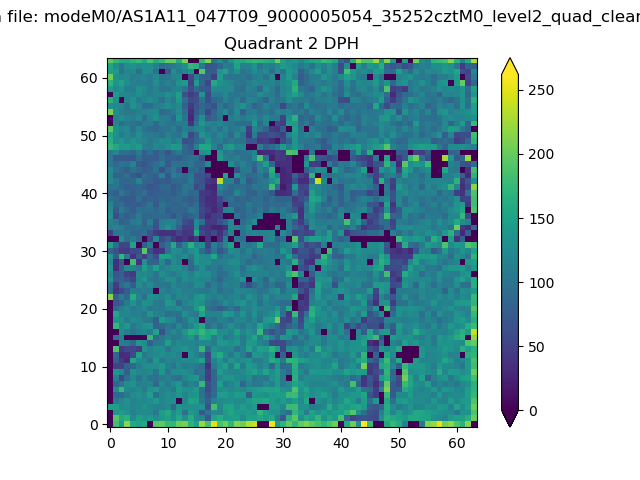 |
Quadrant C |
| Plot type | Count rate plots | Images |
|---|---|---|
| Comparison with Poisson distribution Blue bars denote a histogram of data divided into 1 sec bins. Red curve is a Poisson curve with rate = median count rate of data. |
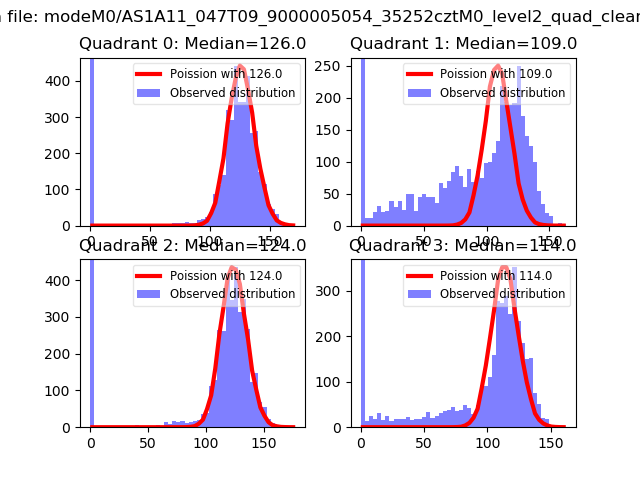 |
 |
| Quadrant-wise count rates Data is divided into 100 sec bins |
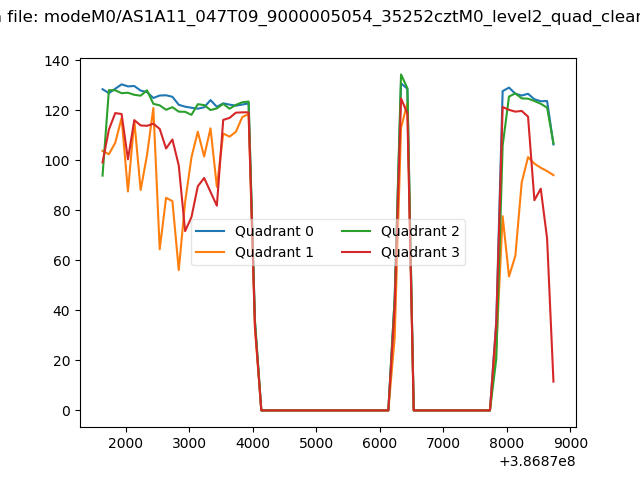 |
|
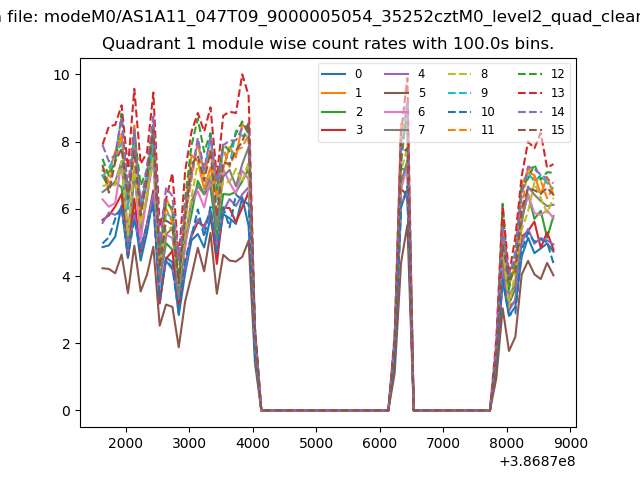
| Module-wise count rates for Quadrant A Data is divided into 100 sec bins |
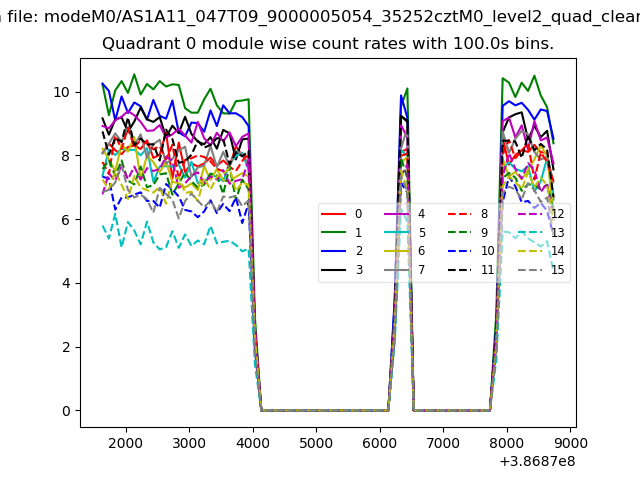 |
 |
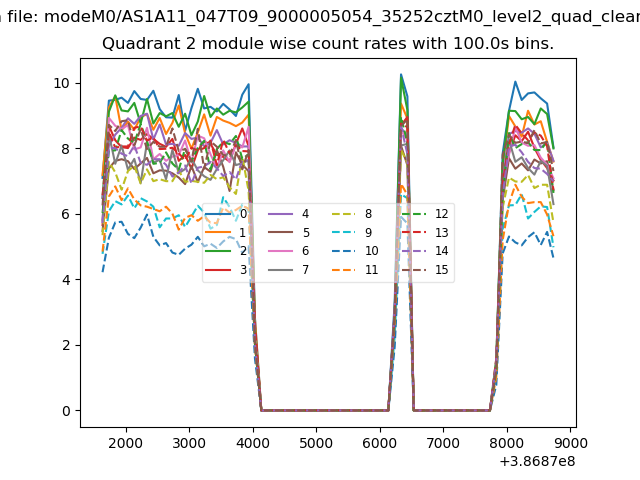
| Module-wise count rates for Quadrant B Data is divided into 100 sec bins |
 |
 |
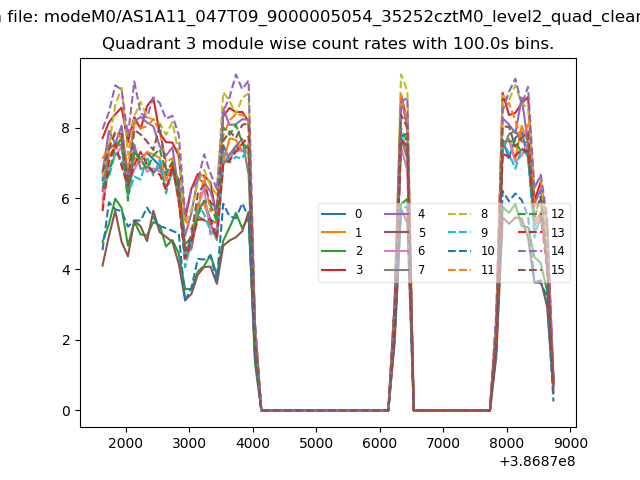
| Module-wise count rates for Quadrant C Data is divided into 100 sec bins |
 |
 |
| Module-wise count rates for Quadrant D Data is divided into 100 sec bins |
 |
 |
| Parameter | Plot |
|---|---|
| CZT HV Monitor | 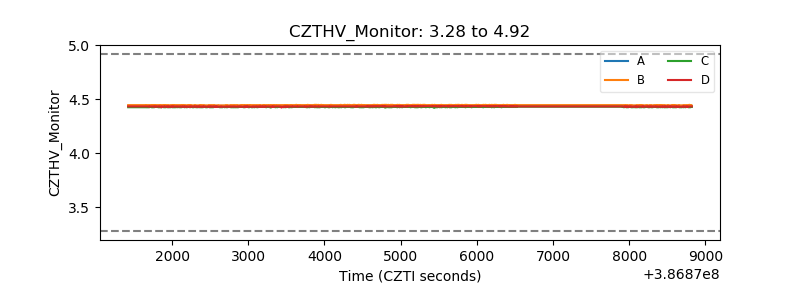 |
| D_VDD | 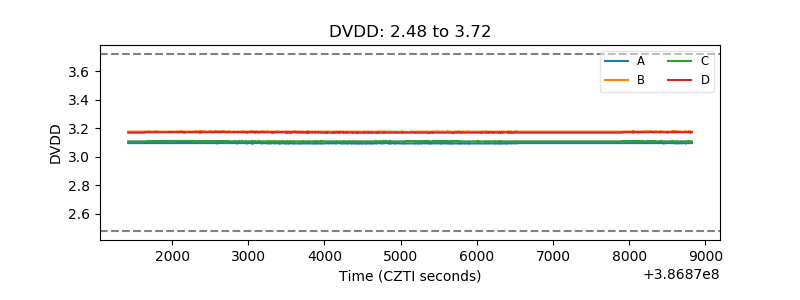 |
| Temperature 1 | 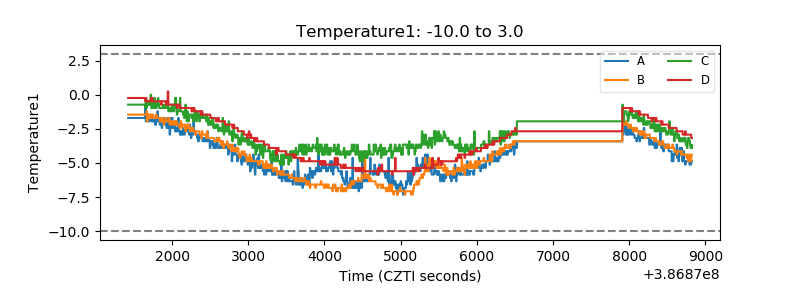 |
| Veto HV Monitor | 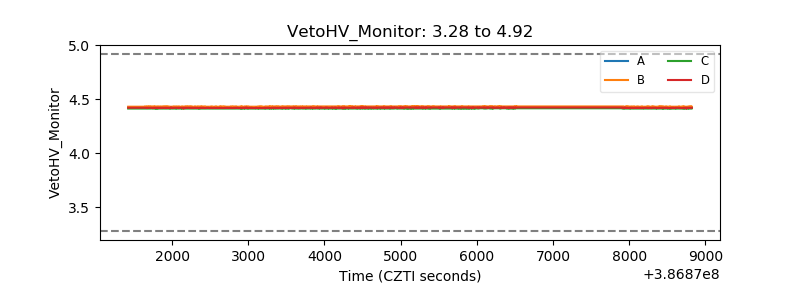 |
| Veto LLD | 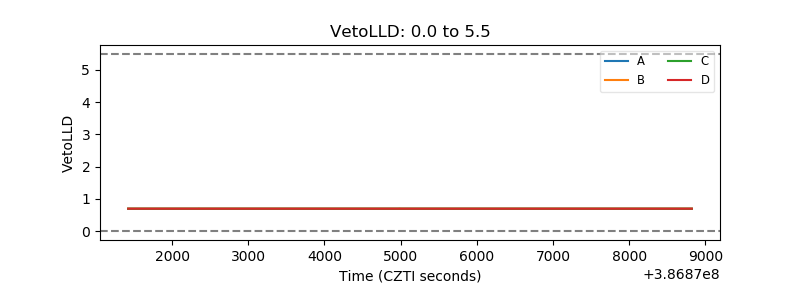 |
| Alpha Counter | 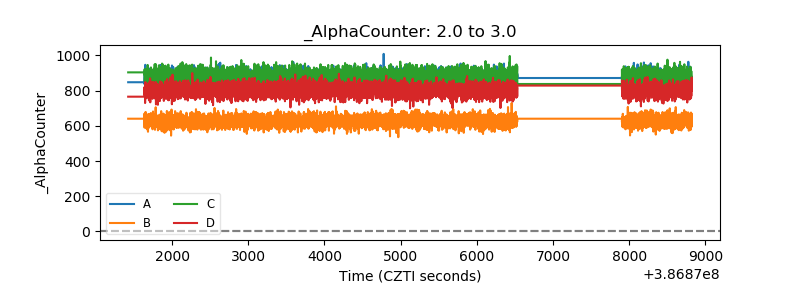 |
| _CPM_Rate | 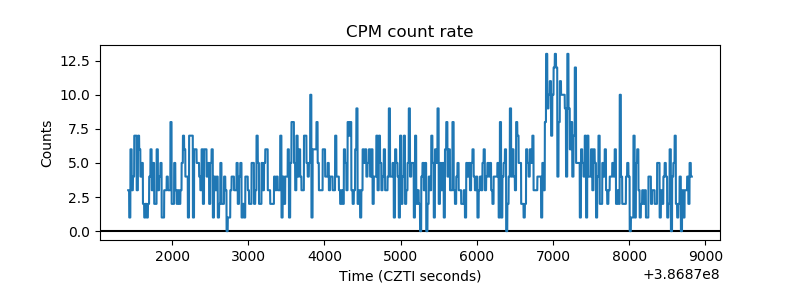 |
| CZT Counter | 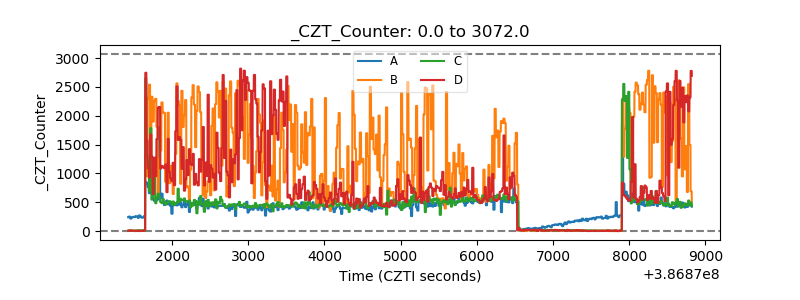 |
| +2.5 Volts monitor | 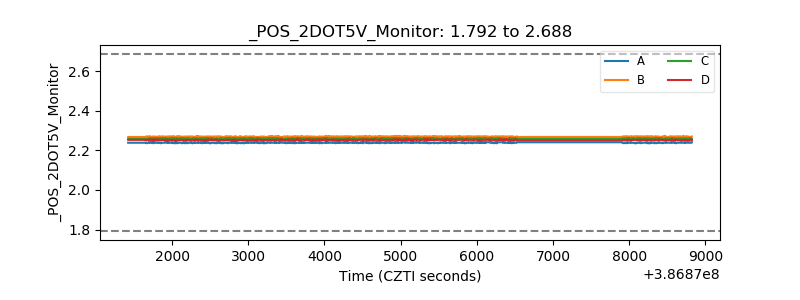 |
| +5 Volts monitor | 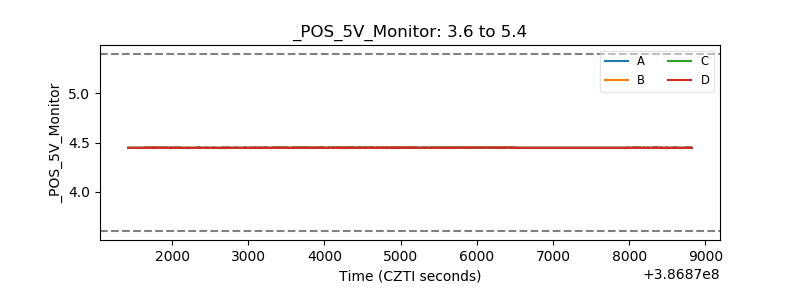 |
| _ROLL_ROT | 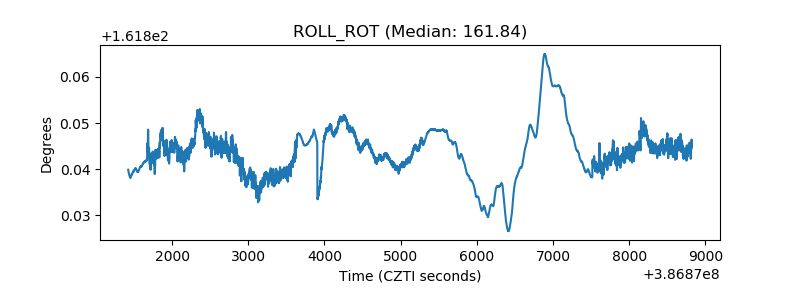 |
| _Roll_DEC | 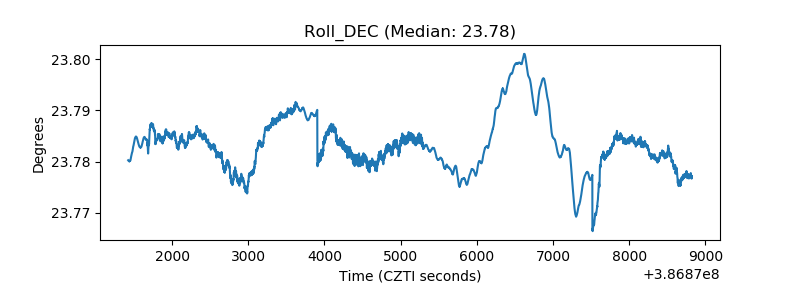 |
| _Roll_RA | 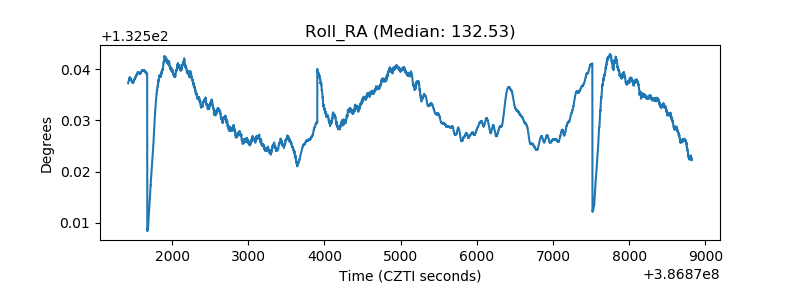 |
| Veto Counter | 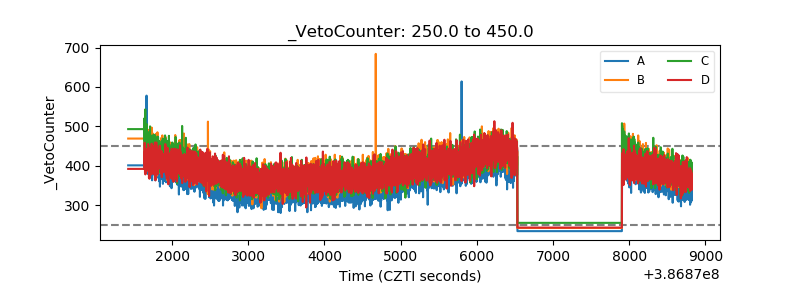 |