| Param | Original file | Final file |
|---|---|---|
| Filename | modeM0/AS1A11_047T09_9000005054_35251cztM0_level2.evt | modeM0/AS1A11_047T09_9000005054_35251cztM0_level2_quad_clean.evt |
| Size (bytes) | 751,495,680 | 69,937,920 |
| Size | 716.7 MB | 66.7 MB |
| Events in quadrant A | 3,118,236 | 476,414 |
| Events in quadrant B | 8,383,592 | 388,130 |
| Events in quadrant C | 3,108,985 | 467,781 |
| Events in quadrant D | 7,771,416 | 393,010 |
| Mode M9 | |||
|---|---|---|---|
| Quadrant | BADHDUFLAG | Total packets | Discarded packets |
| A | 0 | 20 | 0 |
| B | 0 | 20 | 0 |
| C | 0 | 20 | 0 |
| D | 0 | 21 | 0 |
| Mode M0 | |||
|---|---|---|---|
| Quadrant | BADHDUFLAG | Total packets | Discarded packets |
| A | 0 | 12858 | 3 |
| B | 0 | 28795 | 2 |
| C | 0 | 12488 | 2 |
| D | 0 | 27040 | 2 |
| Mode SS | |||
|---|---|---|---|
| Quadrant | BADHDUFLAG | Total packets | Discarded packets |
| A | 0 | 112 | 0 |
| B | 0 | 112 | 0 |
| C | 0 | 112 | 0 |
| D | 0 | 112 | 0 |
| Quadrant | Total seconds | Saturated seconds | Saturation percentage |
|---|---|---|---|
| A | 5590 | 132 | 2.361360% |
| B | 5590 | 2044 | 36.565295% |
| C | 5590 | 131 | 2.343470% |
| D | 5590 | 1202 | 21.502683% |
Noise dominated data is calculated using 1-second bins in cleaned event files. If a bin has >2000 counts, and if more than 50% of those come from <1% of pixels, then it is considered to be noise-dominated and hence unusable.
| Quadrant | # 1 sec bins | Bins with >0 counts | Bins with >2000 counts | High rate bins dominated by noise | Noise dominated (total time) | Noise dominated (detector-on time) | Marked lightcurve |
|---|---|---|---|---|---|---|---|
| A | 7203 | 5591 | 105 | 105 | 1.46% | 1.88% | 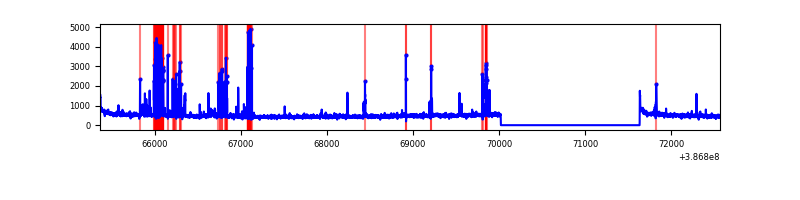 |
| B | 7202 | 5590 | 1528 | 1528 | 21.22% | 27.33% | 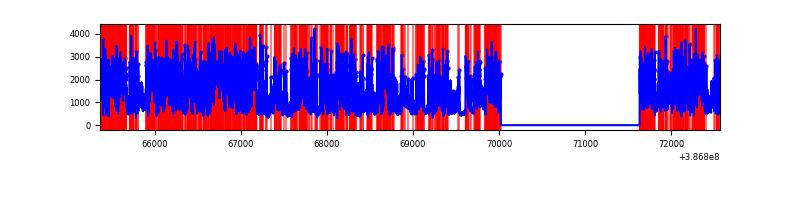 |
| C | 7203 | 5591 | 109 | 109 | 1.51% | 1.95% | 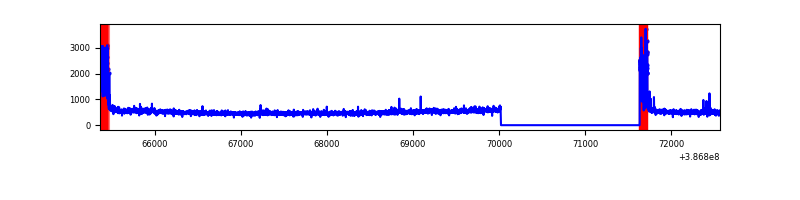 |
| D | 7203 | 5591 | 1276 | 1276 | 17.71% | 22.82% | 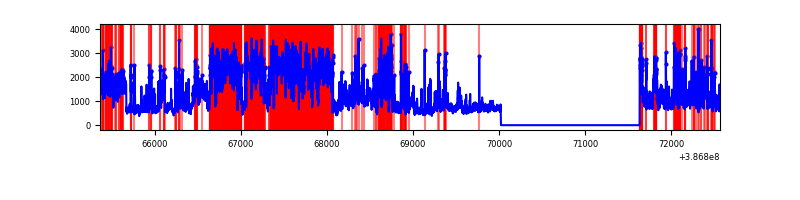 |
Top three noisy pixels from each quadrant. If the there are fewer than three noisy pixels in the level2.evt file, extra rows are filled as -1
| Pixel properties | Quadrant properties | ||||||
|---|---|---|---|---|---|---|---|
| Quadrant | DetID | PixID | Counts | Sigma | Mean | Median | Sigma |
| A | 7 | 3 | 448526 | 3412.9 | 648 | 635 | 131.2 |
| A | 10 | 83 | 103527 | 784.03 | 648 | 635 | 131.2 |
| A | 7 | 191 | 26984 | 200.77 | 648 | 635 | 131.2 |
| B | 5 | 236 | 5409297 | 50593.66 | 555 | 541 | 106.9 |
| B | 5 | 172 | 530619 | 4958.36 | 555 | 541 | 106.9 |
| B | 5 | 200 | 152794 | 1424.18 | 555 | 541 | 106.9 |
| C | 0 | 10 | 377440 | 2589.59 | 627 | 633 | 145.5 |
| C | 15 | 214 | 234386 | 1606.46 | 627 | 633 | 145.5 |
| C | 14 | 67 | 16026 | 105.79 | 627 | 633 | 145.5 |
| D | 12 | 227 | 2515957 | 17243.14 | 595 | 578 | 145.9 |
| D | 8 | 195 | 1513315 | 10369.94 | 595 | 578 | 145.9 |
| D | 10 | 118 | 563386 | 3858.1 | 595 | 578 | 145.9 |
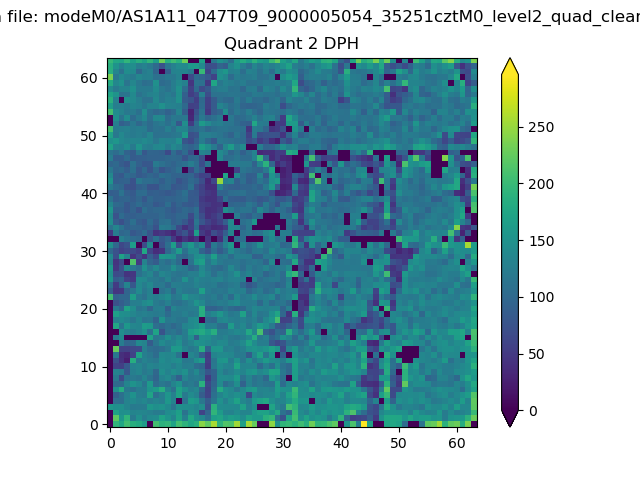
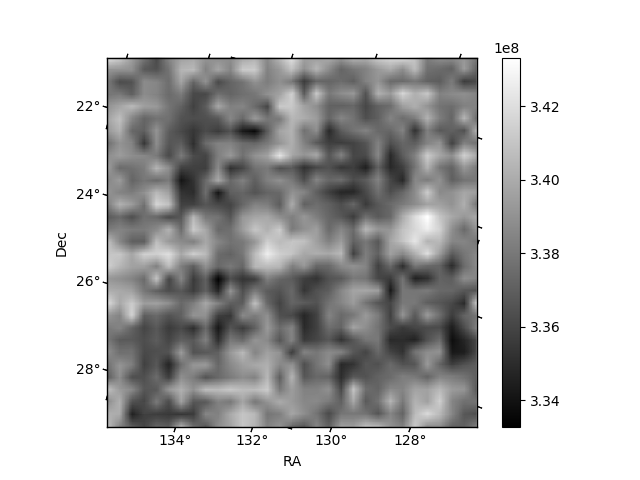
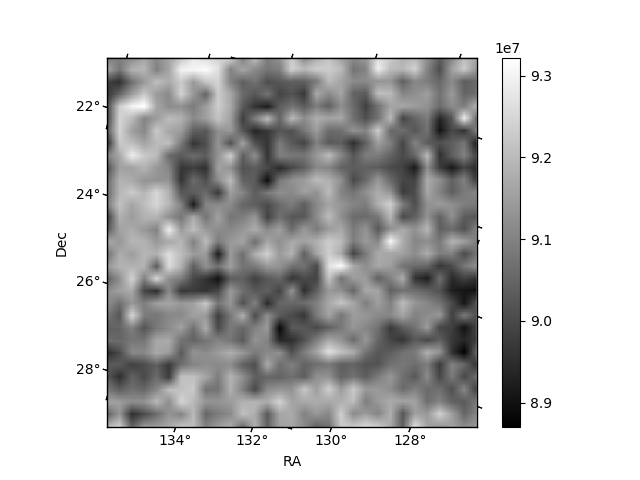
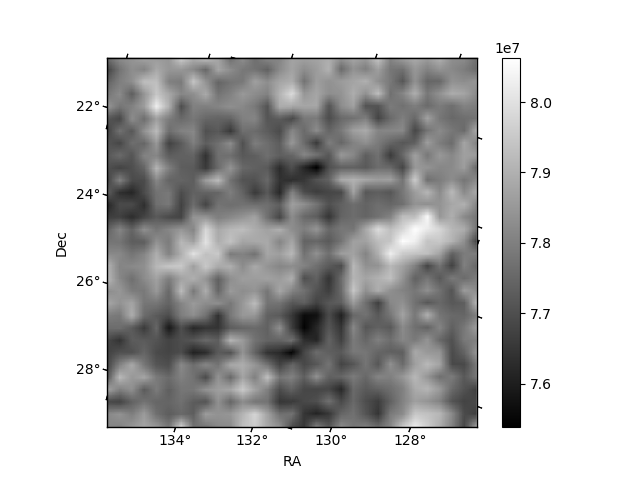
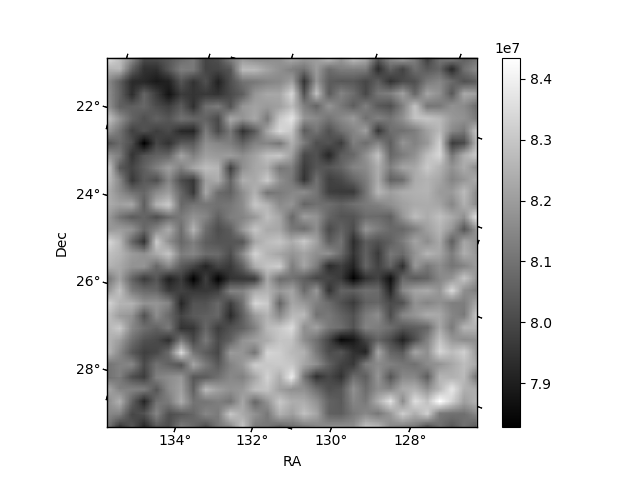
Histogram calculated using DETX and DETY for each event in the final _common_clean file
| Quadrant A | 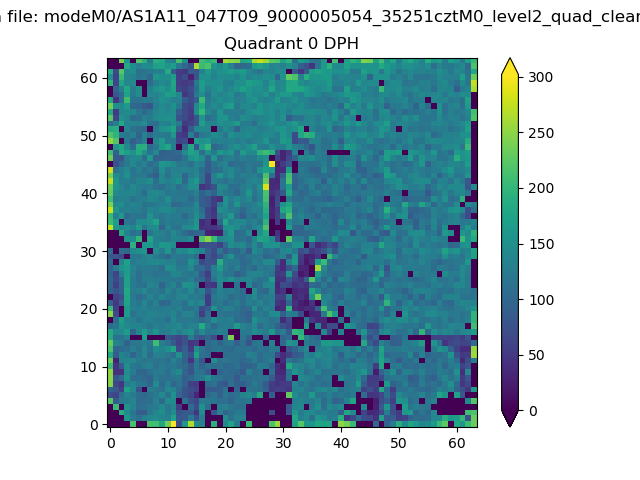 |
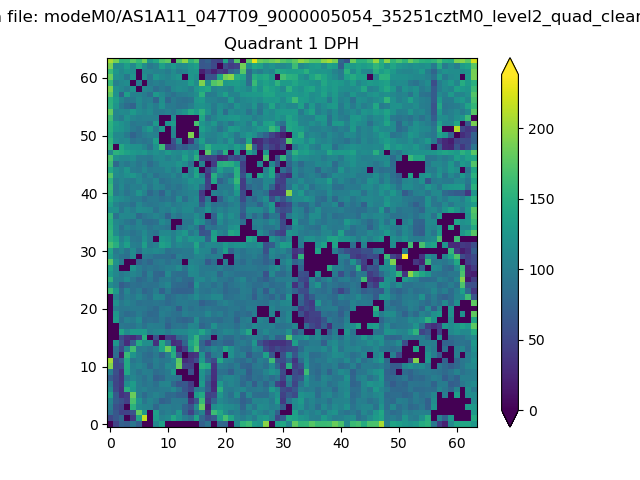 |
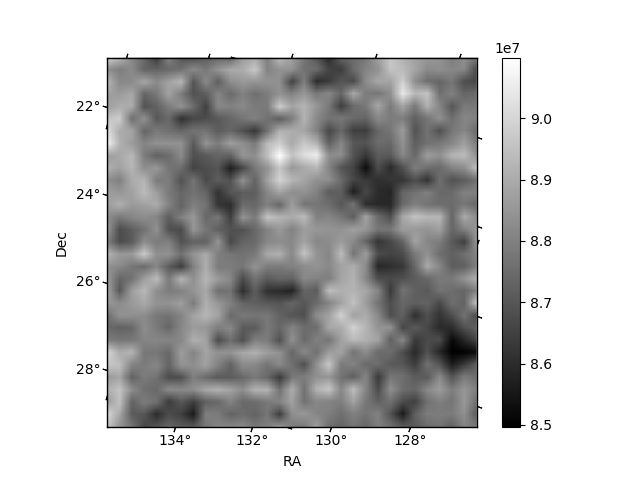
Quadrant B |
|---|---|---|---|
| Quadrant D | 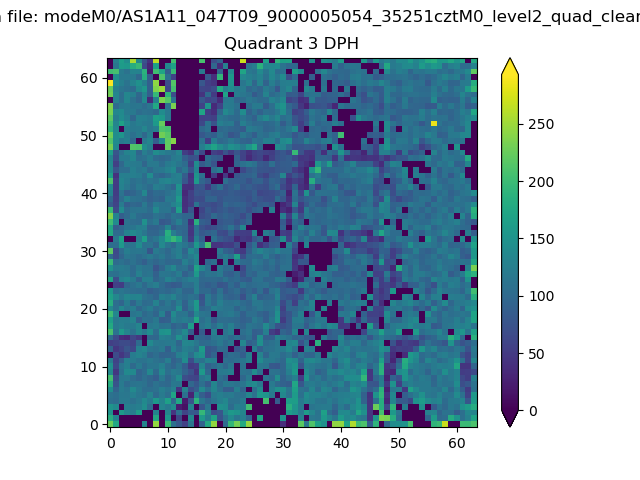 |
 |
Quadrant C |
| Plot type | Count rate plots | Images |
|---|---|---|
| Comparison with Poisson distribution Blue bars denote a histogram of data divided into 1 sec bins. Red curve is a Poisson curve with rate = median count rate of data. |
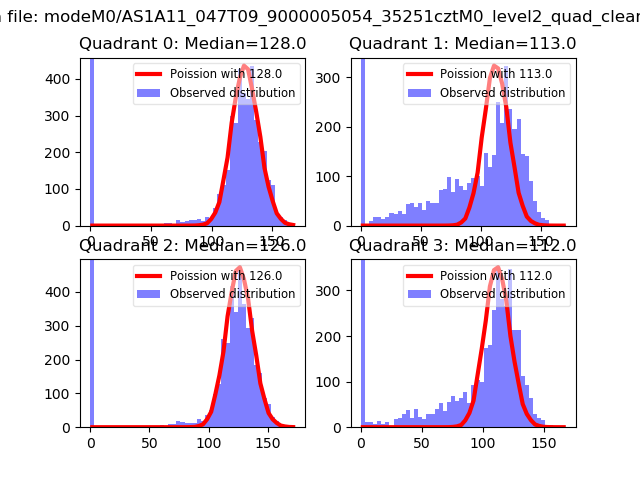 |
 |
| Quadrant-wise count rates Data is divided into 100 sec bins |
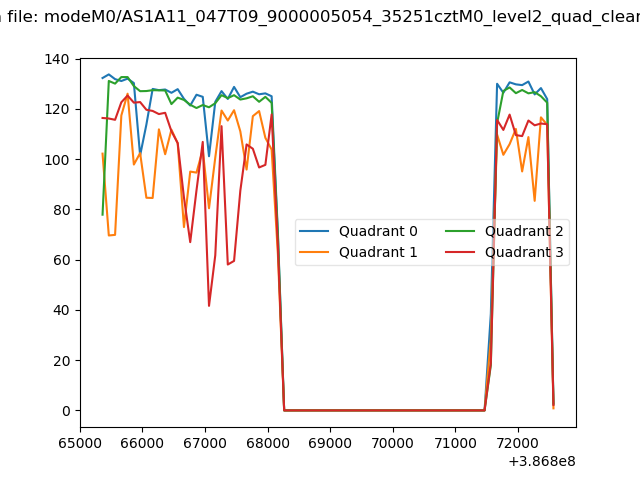 |
|
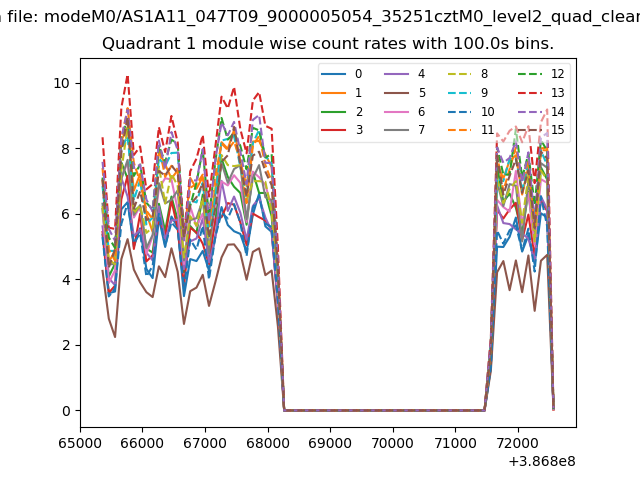
| Module-wise count rates for Quadrant A Data is divided into 100 sec bins |
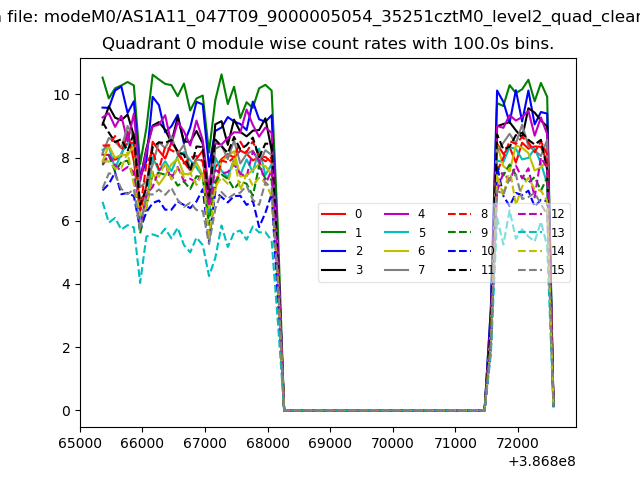 |
 |
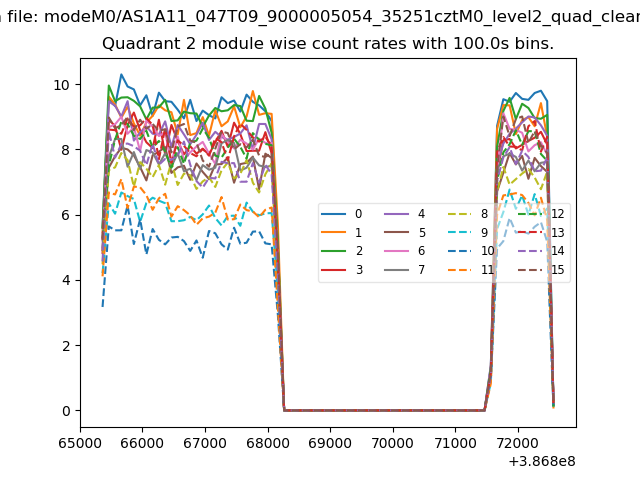
| Module-wise count rates for Quadrant B Data is divided into 100 sec bins |
 |
 |
| Module-wise count rates for Quadrant C Data is divided into 100 sec bins |
 |
 |
| Module-wise count rates for Quadrant D Data is divided into 100 sec bins |
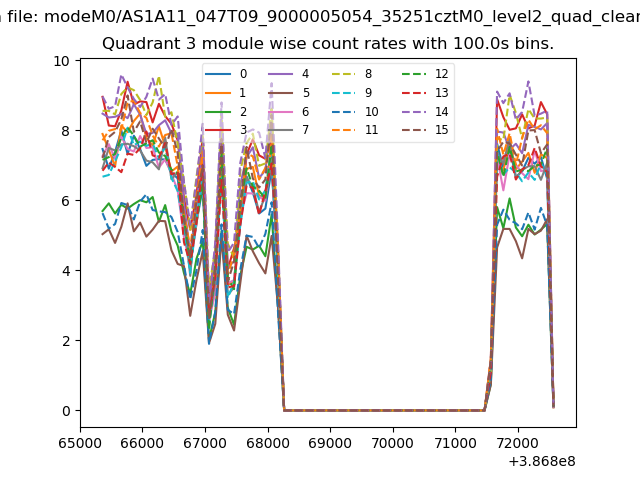 |
 |
| Parameter | Plot |
|---|---|
| CZT HV Monitor |  |
| D_VDD | 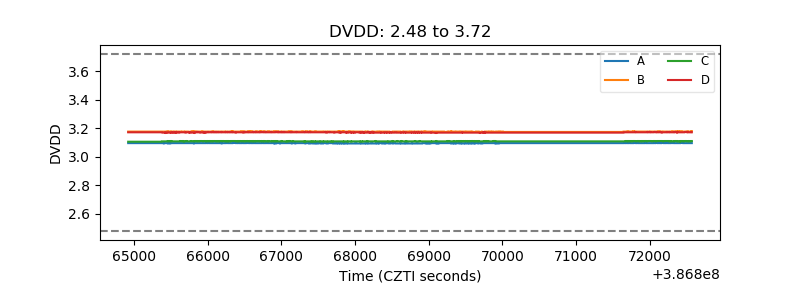 |
| Temperature 1 | 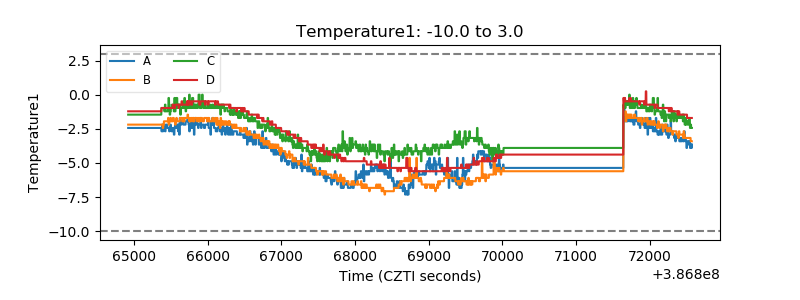 |
| Veto HV Monitor | 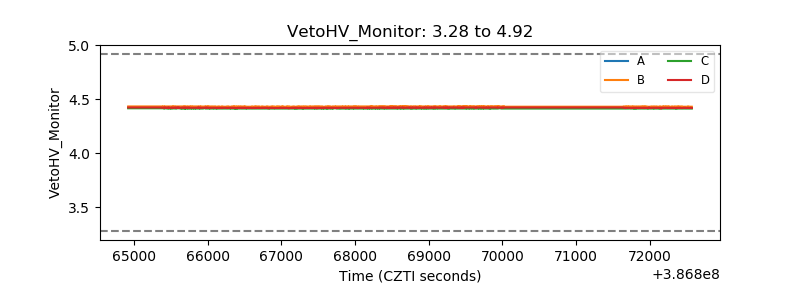 |
| Veto LLD | 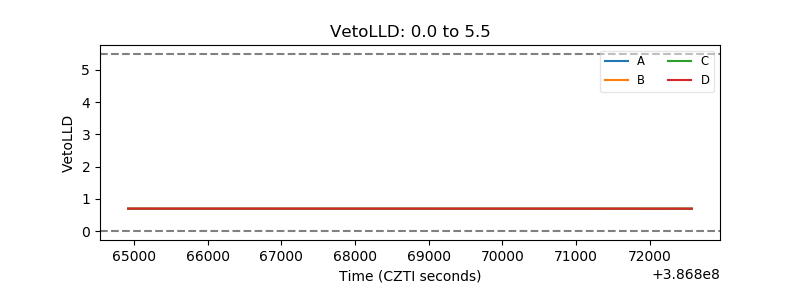 |
| Alpha Counter | 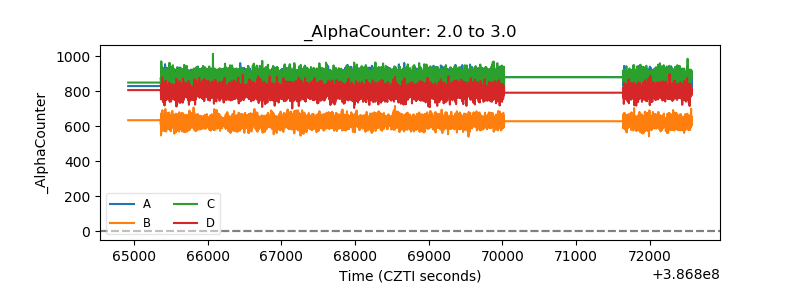 |
| _CPM_Rate | 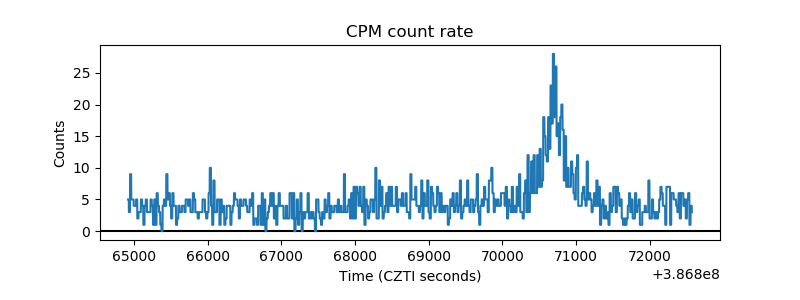 |
| CZT Counter | 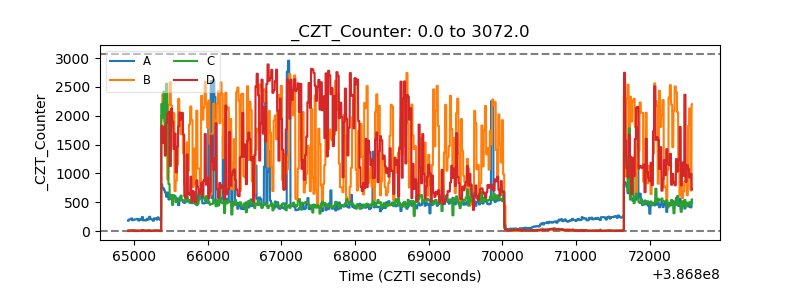 |
| +2.5 Volts monitor | 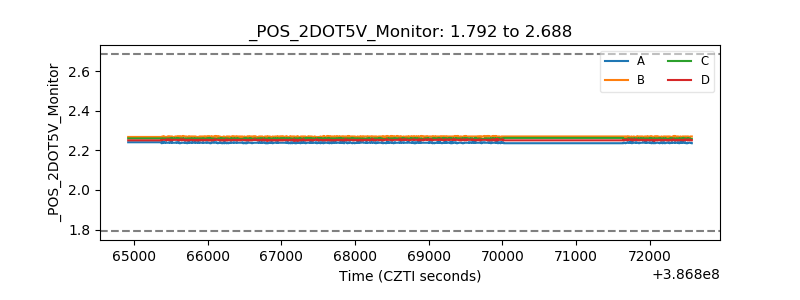 |
| +5 Volts monitor | 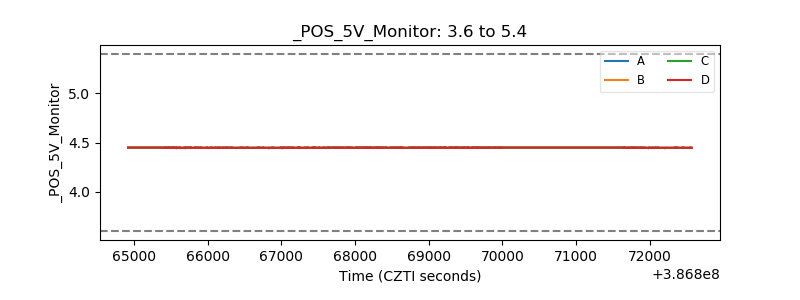 |
| _ROLL_ROT | 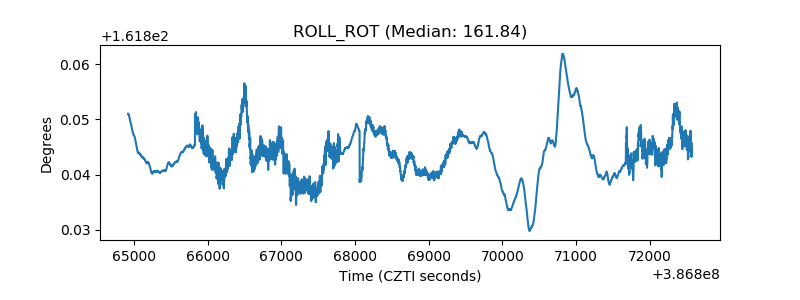 |
| _Roll_DEC | 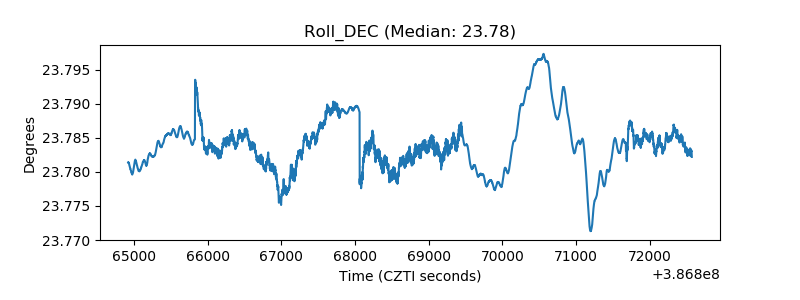 |
| _Roll_RA | 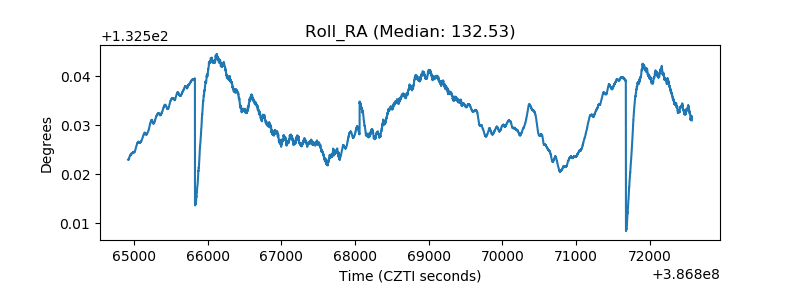 |
| Veto Counter | 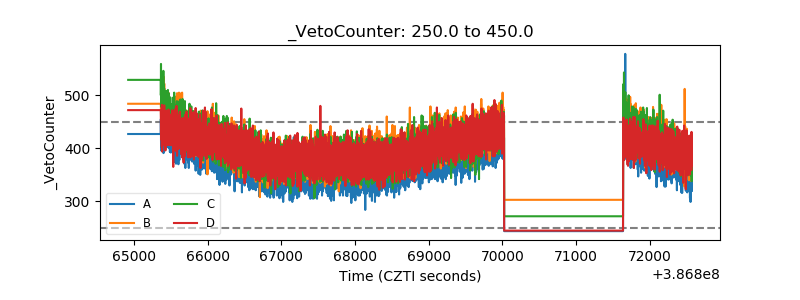 |