| Param | Original file | Final file |
|---|---|---|
| Filename | modeM0/AS1A11_047T09_9000005054_35250cztM0_level2.evt | modeM0/AS1A11_047T09_9000005054_35250cztM0_level2_quad_clean.evt |
| Size (bytes) | 775,405,440 | 78,840,000 |
| Size | 739.5 MB | 75.2 MB |
| Events in quadrant A | 3,628,225 | 548,453 |
| Events in quadrant B | 8,072,660 | 449,602 |
| Events in quadrant C | 3,312,677 | 546,772 |
| Events in quadrant D | 8,112,770 | 469,629 |
| Mode M9 | |||
|---|---|---|---|
| Quadrant | BADHDUFLAG | Total packets | Discarded packets |
| A | 0 | 34 | 0 |
| B | 0 | 34 | 0 |
| C | 0 | 34 | 0 |
| D | 0 | 35 | 0 |
| Mode M0 | |||
|---|---|---|---|
| Quadrant | BADHDUFLAG | Total packets | Discarded packets |
| A | 0 | 14112 | 3 |
| B | 0 | 27634 | 2 |
| C | 0 | 13021 | 2 |
| D | 0 | 27863 | 2 |
| Mode SS | |||
|---|---|---|---|
| Quadrant | BADHDUFLAG | Total packets | Discarded packets |
| A | 0 | 108 | 0 |
| B | 0 | 108 | 0 |
| C | 0 | 108 | 0 |
| D | 0 | 108 | 0 |
| Quadrant | Total seconds | Saturated seconds | Saturation percentage |
|---|---|---|---|
| A | 5295 | 330 | 6.232295% |
| B | 5295 | 2042 | 38.564684% |
| C | 5295 | 151 | 2.851747% |
| D | 5295 | 1256 | 23.720491% |
Noise dominated data is calculated using 1-second bins in cleaned event files. If a bin has >2000 counts, and if more than 50% of those come from <1% of pixels, then it is considered to be noise-dominated and hence unusable.
| Quadrant | # 1 sec bins | Bins with >0 counts | Bins with >2000 counts | High rate bins dominated by noise | Noise dominated (total time) | Noise dominated (detector-on time) | Marked lightcurve |
|---|---|---|---|---|---|---|---|
| A | 7238 | 5296 | 290 | 290 | 4.01% | 5.48% | 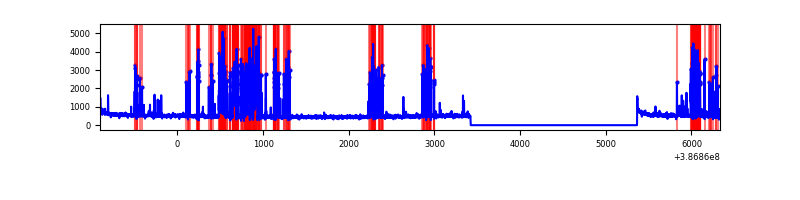 |
| B | 7238 | 5296 | 1542 | 1542 | 21.30% | 29.12% | 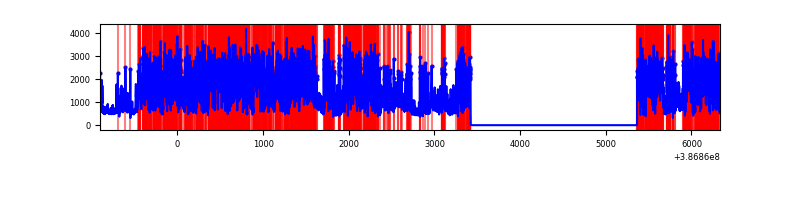 |
| C | 7238 | 5296 | 126 | 126 | 1.74% | 2.38% | 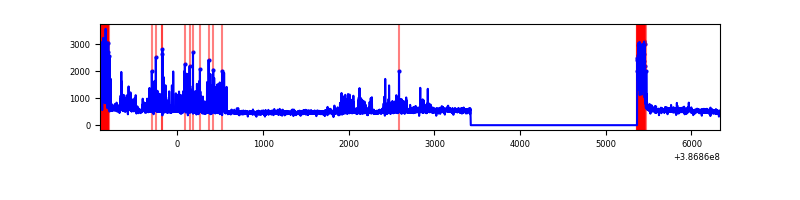 |
| D | 7238 | 5296 | 1265 | 1265 | 17.48% | 23.89% | 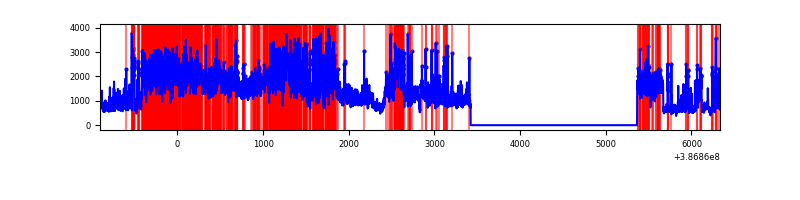 |
Top three noisy pixels from each quadrant. If the there are fewer than three noisy pixels in the level2.evt file, extra rows are filled as -1
| Pixel properties | Quadrant properties | ||||||
|---|---|---|---|---|---|---|---|
| Quadrant | DetID | PixID | Counts | Sigma | Mean | Median | Sigma |
| A | 7 | 3 | 1073137 | 8571.26 | 620 | 607 | 125.1 |
| A | 10 | 83 | 97257 | 772.39 | 620 | 607 | 125.1 |
| A | 9 | 143 | 39069 | 307.37 | 620 | 607 | 125.1 |
| B | 5 | 236 | 5164740 | 49962.48 | 534 | 519 | 103.4 |
| B | 5 | 172 | 481104 | 4649.53 | 534 | 519 | 103.4 |
| B | 5 | 200 | 155212 | 1496.61 | 534 | 519 | 103.4 |
| C | 0 | 10 | 711093 | 5055.32 | 606 | 612 | 140.5 |
| C | 15 | 214 | 222103 | 1575.99 | 606 | 612 | 140.5 |
| C | 14 | 67 | 12469 | 84.37 | 606 | 612 | 140.5 |
| D | 8 | 195 | 3966572 | 28227.29 | 575 | 561 | 140.5 |
| D | 10 | 118 | 691500 | 4917.62 | 575 | 561 | 140.5 |
| D | 7 | 80 | 386020 | 2743.43 | 575 | 561 | 140.5 |
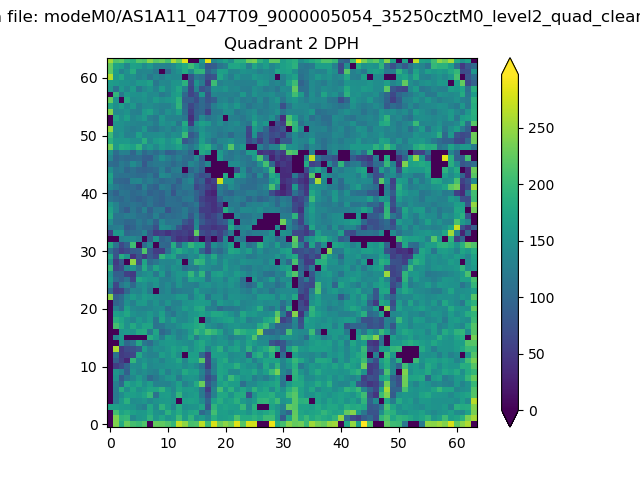
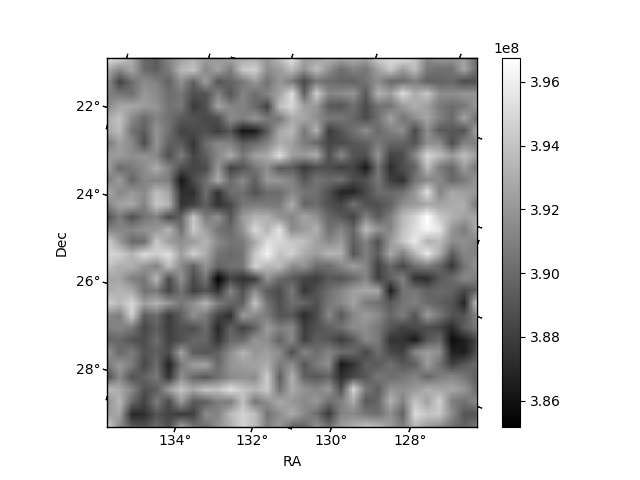
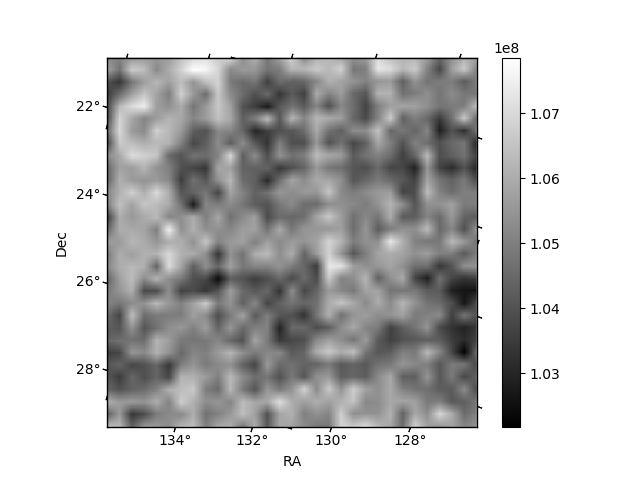
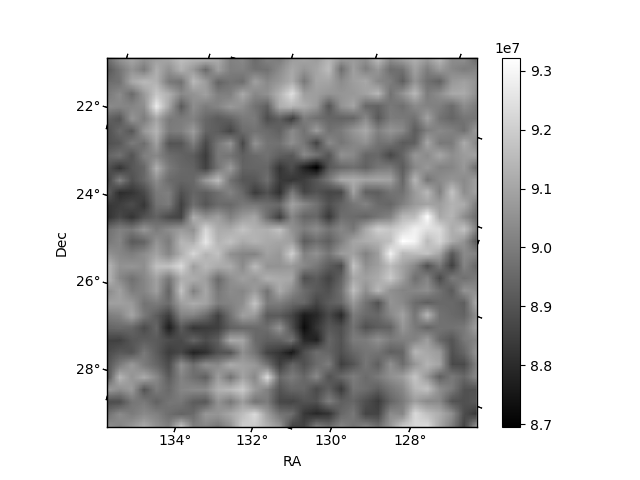
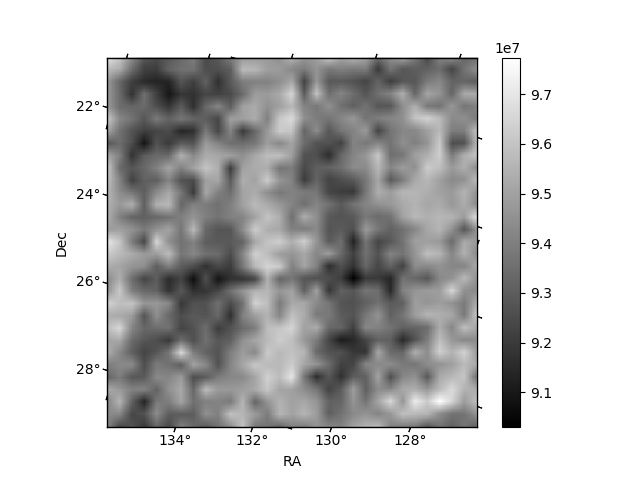
Histogram calculated using DETX and DETY for each event in the final _common_clean file
| Quadrant A | 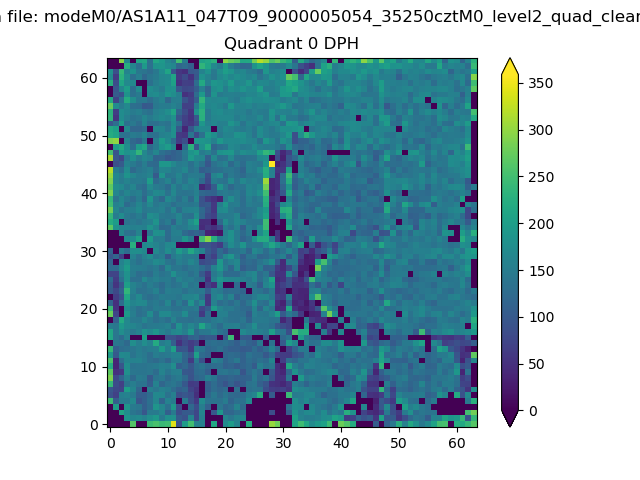 |
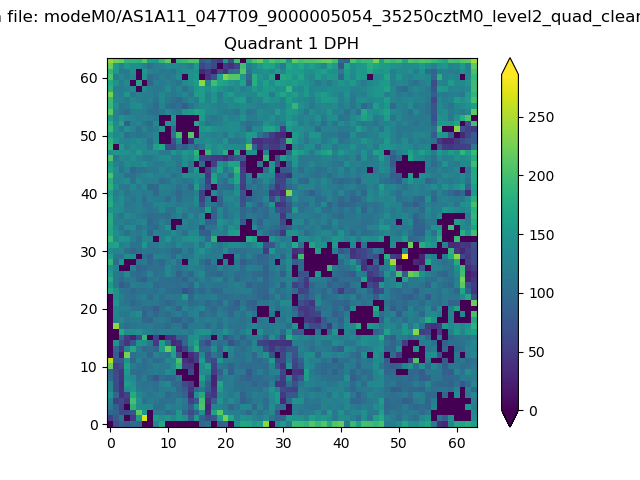 |
Quadrant B |
|---|---|---|---|
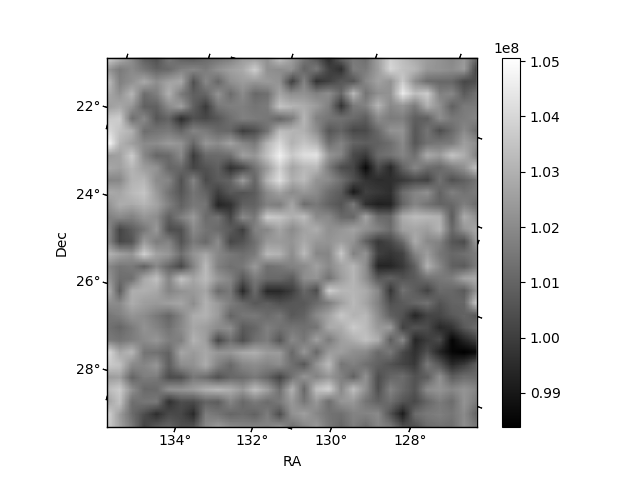
| Quadrant D | 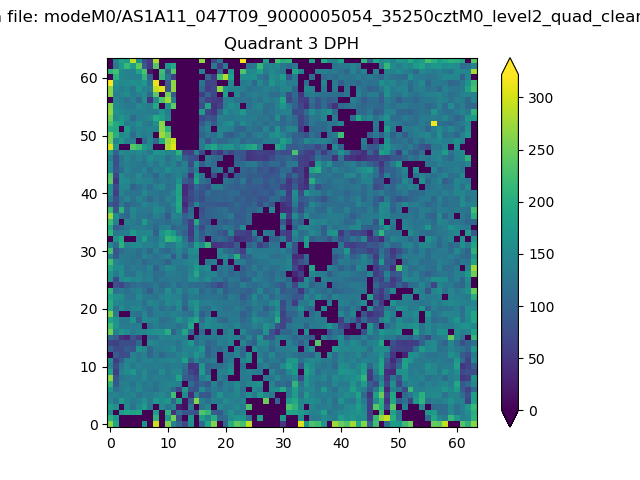 |
 |
Quadrant C |
| Plot type | Count rate plots | Images |
|---|---|---|
| Comparison with Poisson distribution Blue bars denote a histogram of data divided into 1 sec bins. Red curve is a Poisson curve with rate = median count rate of data. |
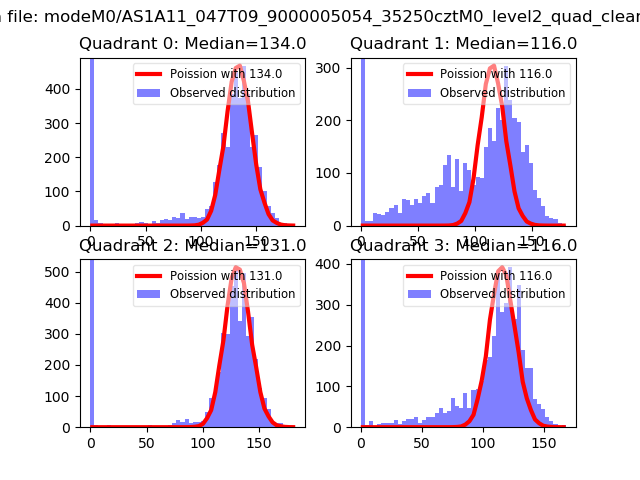 |
 |
| Quadrant-wise count rates Data is divided into 100 sec bins |
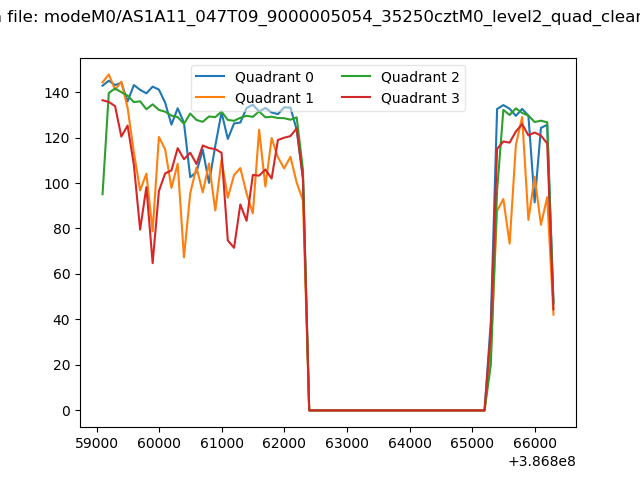 |
|
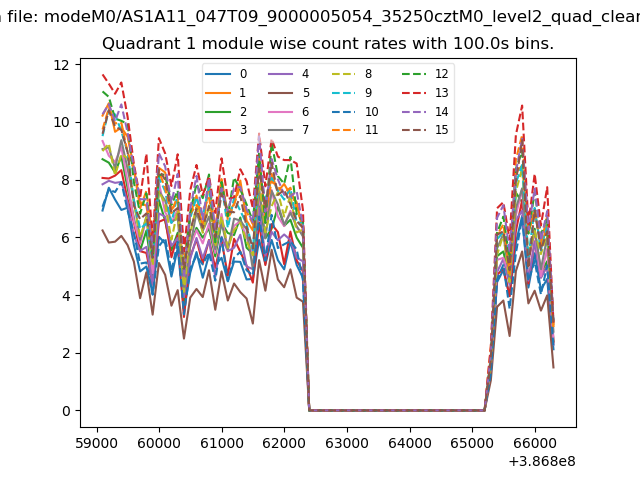
| Module-wise count rates for Quadrant A Data is divided into 100 sec bins |
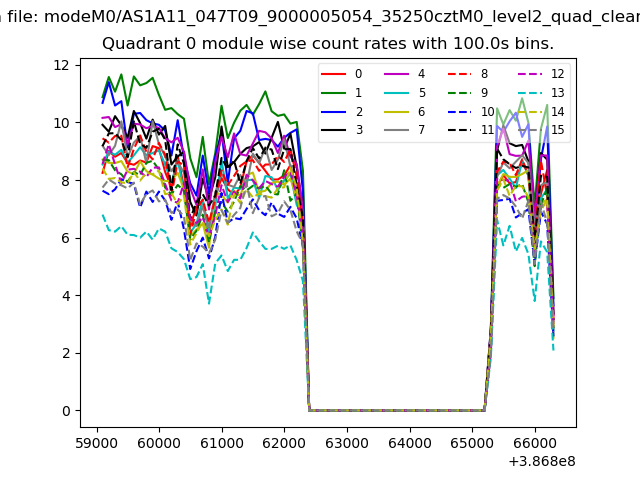 |
 |
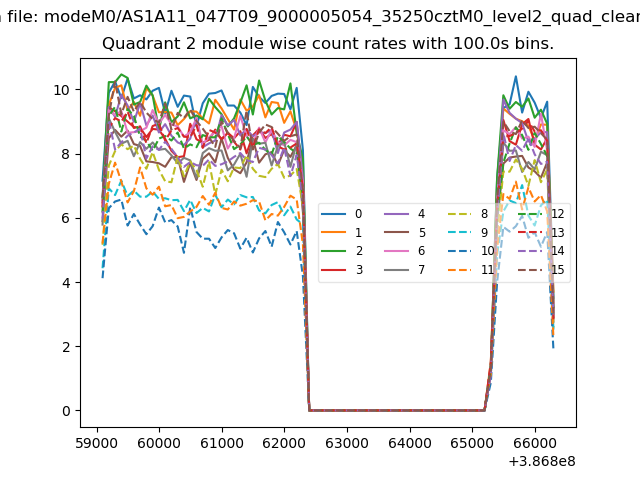
| Module-wise count rates for Quadrant B Data is divided into 100 sec bins |
 |
 |
| Module-wise count rates for Quadrant C Data is divided into 100 sec bins |
 |
 |
| Module-wise count rates for Quadrant D Data is divided into 100 sec bins |
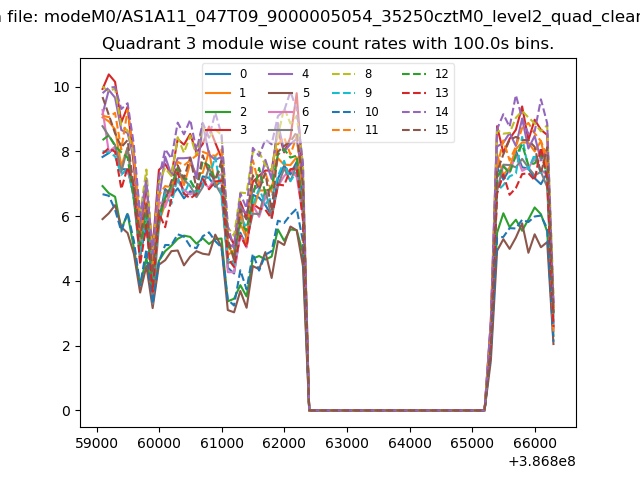 |
 |
| Parameter | Plot |
|---|---|
| CZT HV Monitor | 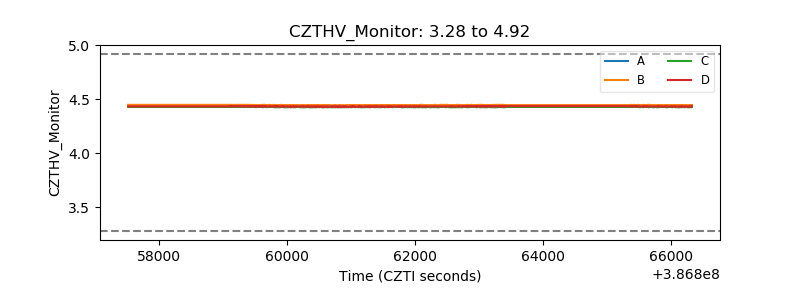 |
| D_VDD | 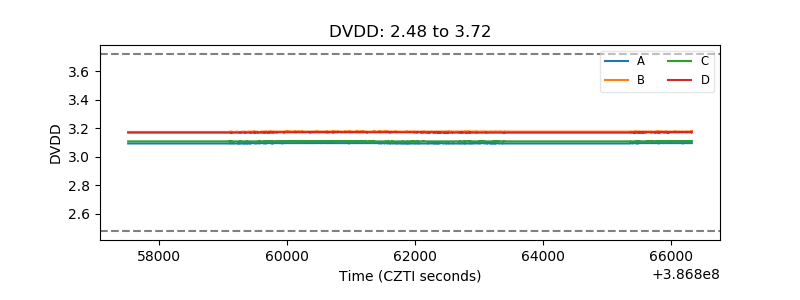 |
| Temperature 1 | 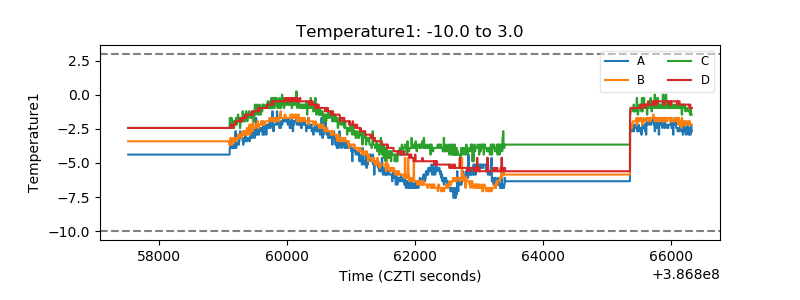 |
| Veto HV Monitor | 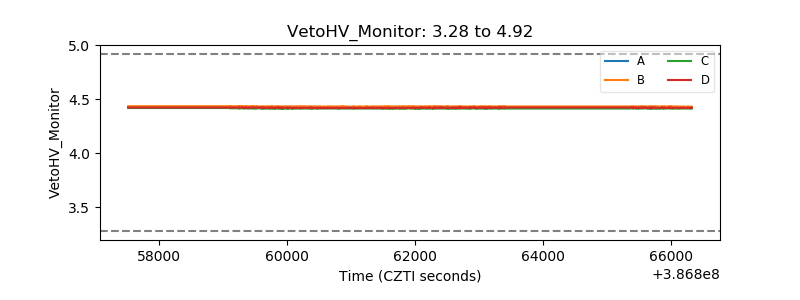 |
| Veto LLD | 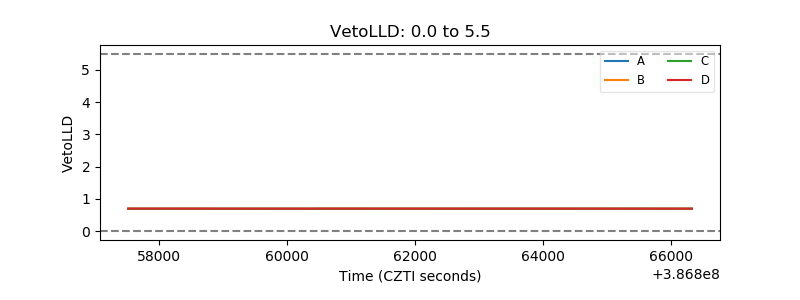 |
| Alpha Counter | 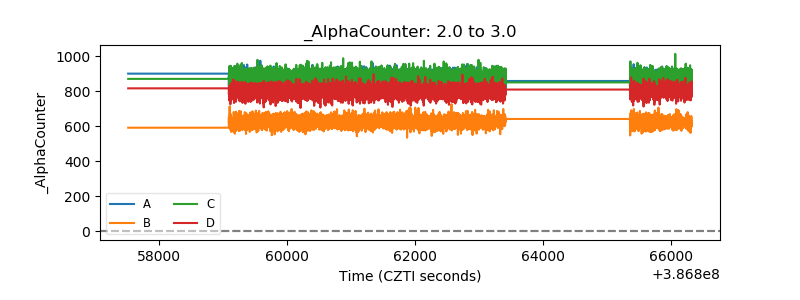 |
| _CPM_Rate | 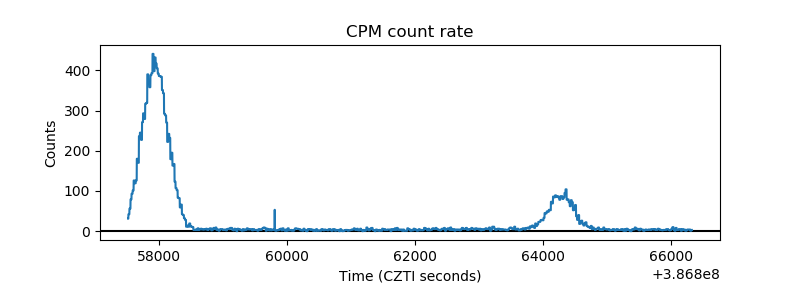 |
| CZT Counter |  |
| +2.5 Volts monitor | 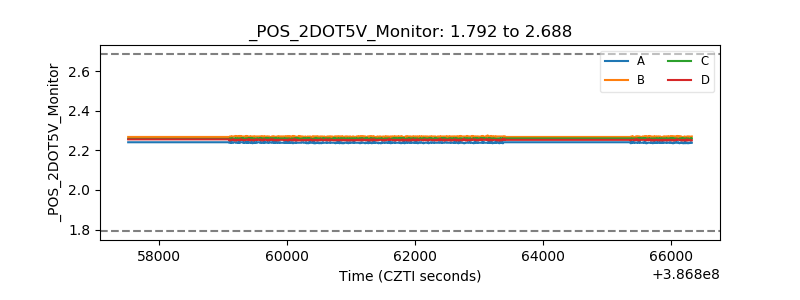 |
| +5 Volts monitor | 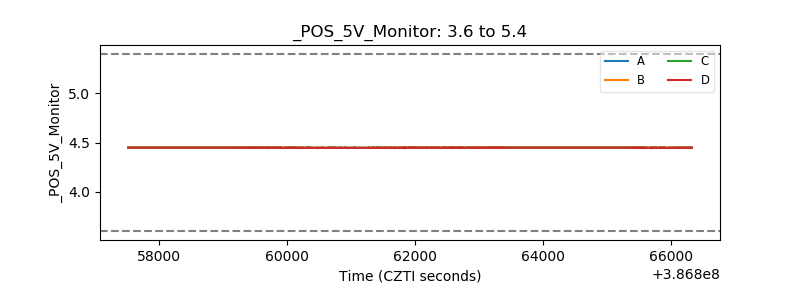 |
| _ROLL_ROT | 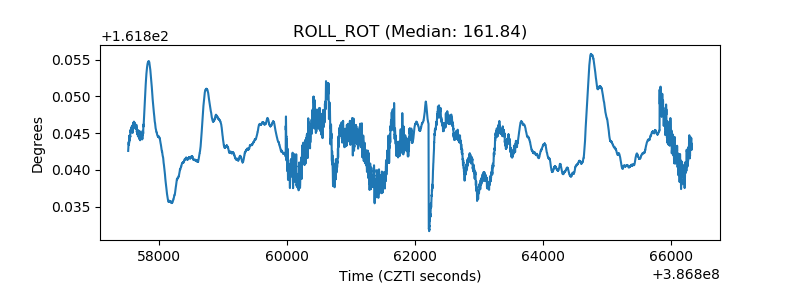 |
| _Roll_DEC | 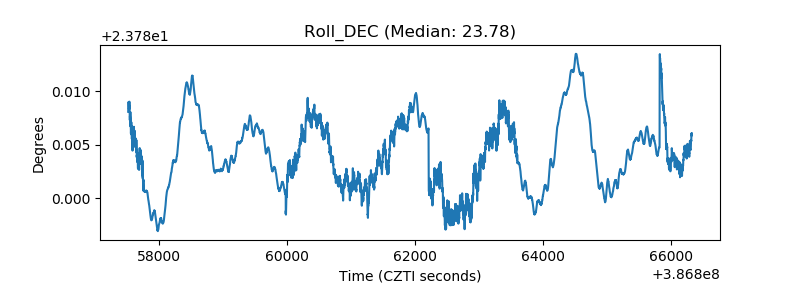 |
| _Roll_RA |  |
| Veto Counter | 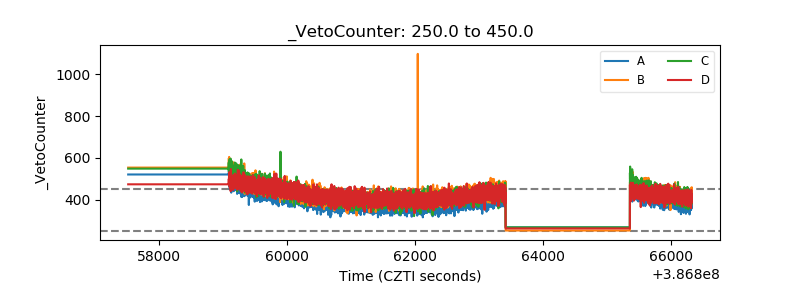 |