| Param | Original file | Final file |
|---|---|---|
| Filename | modeM0/AS1A11_047T09_9000005054_35248cztM0_level2.evt | modeM0/AS1A11_047T09_9000005054_35248cztM0_level2_quad_clean.evt |
| Size (bytes) | 235,920,960 | 31,789,440 |
| Size | 225.0 MB | 30.3 MB |
| Events in quadrant A | 1,336,362 | 216,260 |
| Events in quadrant B | 2,521,363 | 192,619 |
| Events in quadrant C | 1,074,677 | 225,818 |
| Events in quadrant D | 2,093,231 | 200,042 |
| Mode M9 | |||
|---|---|---|---|
| Quadrant | BADHDUFLAG | Total packets | Discarded packets |
| A | 0 | 22 | 0 |
| B | 0 | 22 | 0 |
| C | 0 | 22 | 0 |
| D | 0 | 22 | 0 |
| Mode M0 | |||
|---|---|---|---|
| Quadrant | BADHDUFLAG | Total packets | Discarded packets |
| A | 0 | 5039 | 2 |
| B | 0 | 8697 | 1 |
| C | 0 | 4194 | 1 |
| D | 0 | 7455 | 1 |
| Mode SS | |||
|---|---|---|---|
| Quadrant | BADHDUFLAG | Total packets | Discarded packets |
| A | 0 | 36 | 0 |
| B | 0 | 36 | 0 |
| C | 0 | 36 | 0 |
| D | 0 | 36 | 0 |
| Quadrant | Total seconds | Saturated seconds | Saturation percentage |
|---|---|---|---|
| A | 1736 | 161 | 9.274194% |
| B | 1736 | 620 | 35.714286% |
| C | 1736 | 53 | 3.052995% |
| D | 1736 | 191 | 11.002304% |
Noise dominated data is calculated using 1-second bins in cleaned event files. If a bin has >2000 counts, and if more than 50% of those come from <1% of pixels, then it is considered to be noise-dominated and hence unusable.
| Quadrant | # 1 sec bins | Bins with >0 counts | Bins with >2000 counts | High rate bins dominated by noise | Noise dominated (total time) | Noise dominated (detector-on time) | Marked lightcurve |
|---|---|---|---|---|---|---|---|
| A | 3860 | 1737 | 151 | 151 | 3.91% | 8.69% | 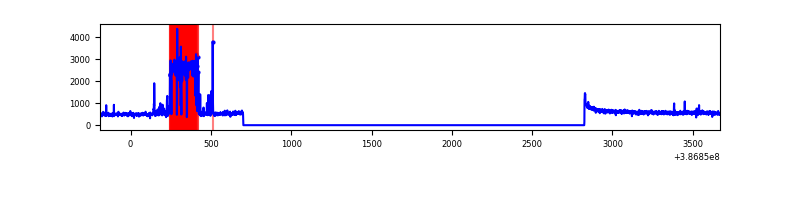 |
| B | 3860 | 1737 | 461 | 461 | 11.94% | 26.54% | 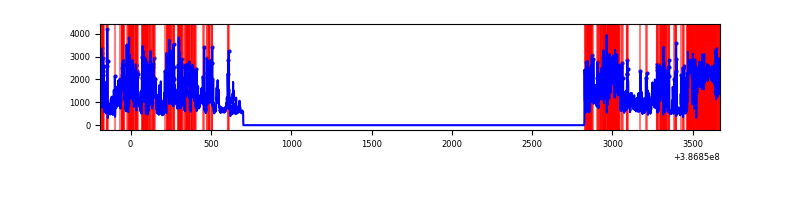 |
| C | 3860 | 1737 | 33 | 33 | 0.85% | 1.90% | 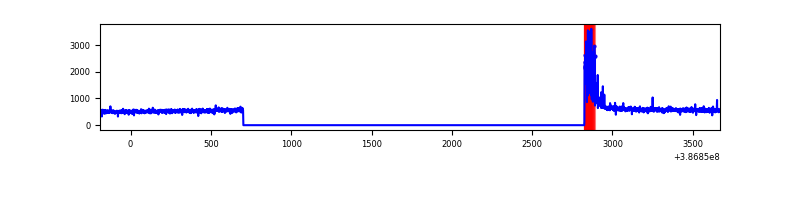 |
| D | 3860 | 1737 | 164 | 164 | 4.25% | 9.44% | 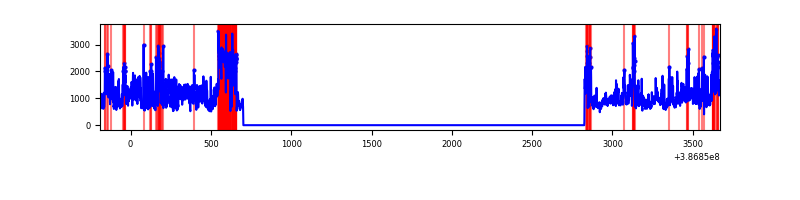 |
Top three noisy pixels from each quadrant. If the there are fewer than three noisy pixels in the level2.evt file, extra rows are filled as -1
| Pixel properties | Quadrant properties | ||||||
|---|---|---|---|---|---|---|---|
| Quadrant | DetID | PixID | Counts | Sigma | Mean | Median | Sigma |
| A | 7 | 3 | 426381 | 9394.62 | 222 | 219 | 45.4 |
| A | 10 | 83 | 40901 | 896.82 | 222 | 219 | 45.4 |
| A | 9 | 143 | 4842 | 101.91 | 222 | 219 | 45.4 |
| B | 5 | 236 | 1409462 | 35585.8 | 197 | 192 | 39.6 |
| B | 5 | 172 | 293454 | 7405.23 | 197 | 192 | 39.6 |
| B | 5 | 200 | 18335 | 458.13 | 197 | 192 | 39.6 |
| C | 0 | 10 | 132279 | 2512.44 | 221 | 223 | 52.6 |
| C | 15 | 214 | 75732 | 1436.6 | 221 | 223 | 52.6 |
| C | 14 | 67 | 3229 | 57.19 | 221 | 223 | 52.6 |
| D | 8 | 195 | 723736 | 13696.44 | 212 | 206 | 52.8 |
| D | 7 | 80 | 306711 | 5802.14 | 212 | 206 | 52.8 |
| D | 1 | 47 | 92966 | 1755.94 | 212 | 206 | 52.8 |
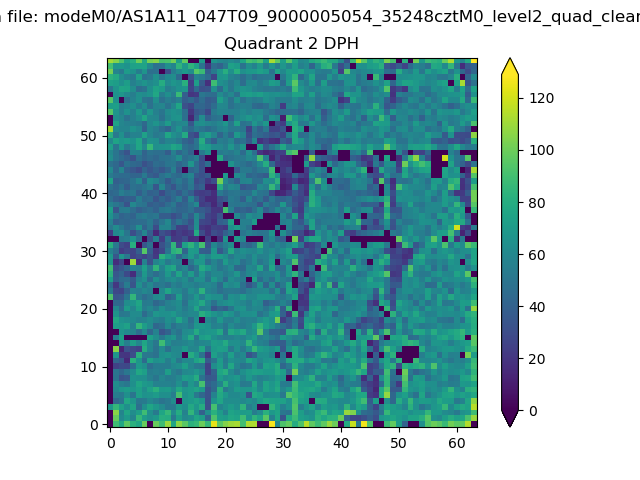
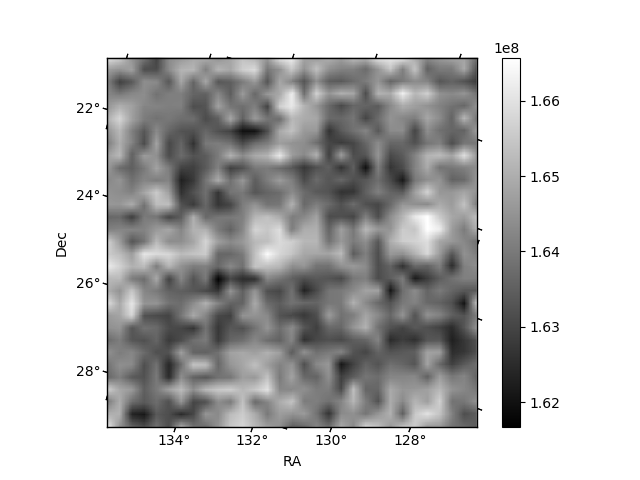
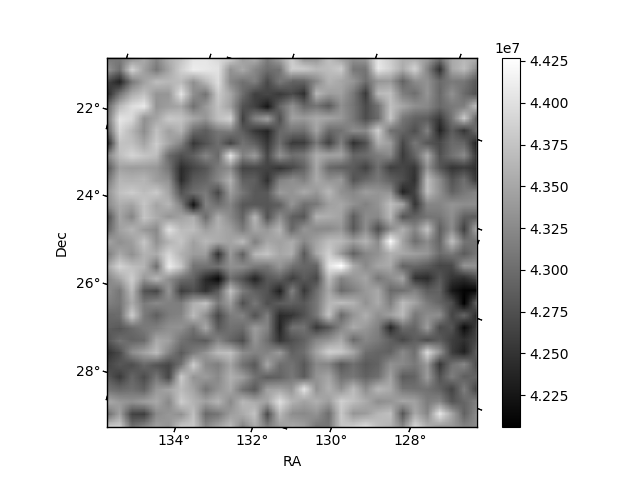
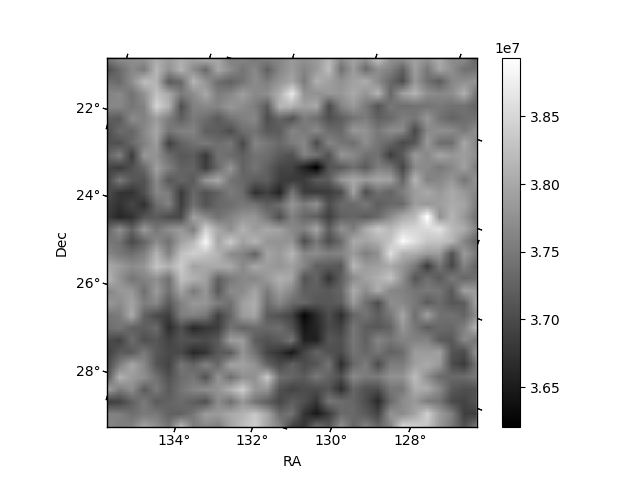
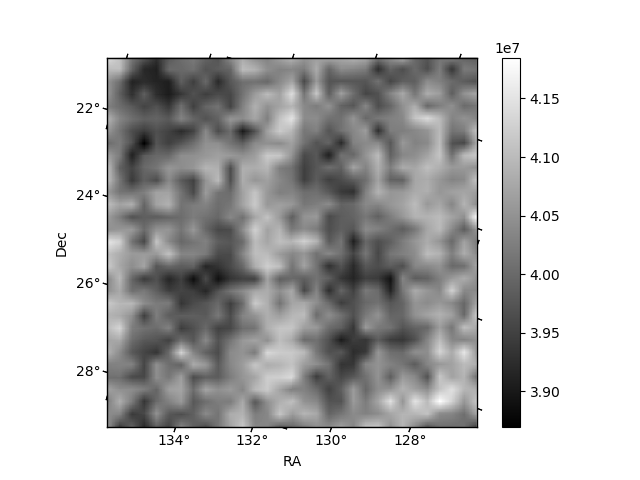
Histogram calculated using DETX and DETY for each event in the final _common_clean file
| Quadrant A | 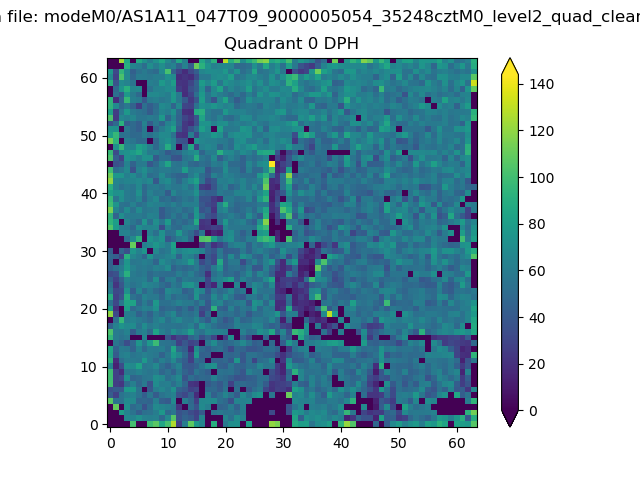 |
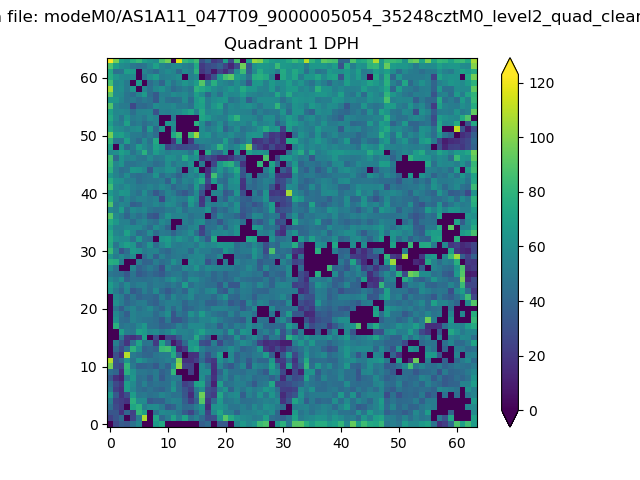 |
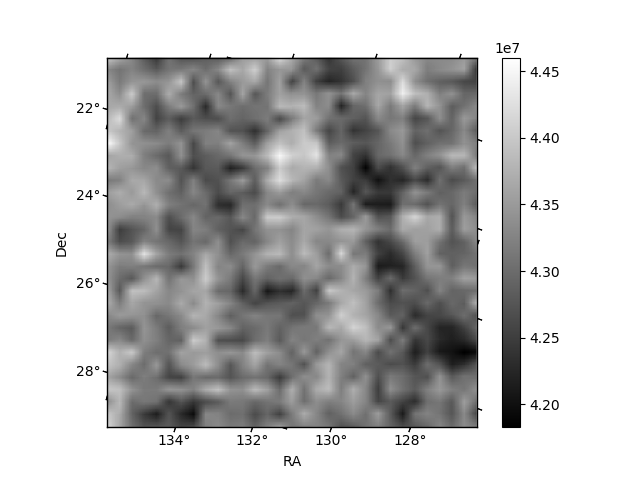
Quadrant B |
|---|---|---|---|
| Quadrant D | 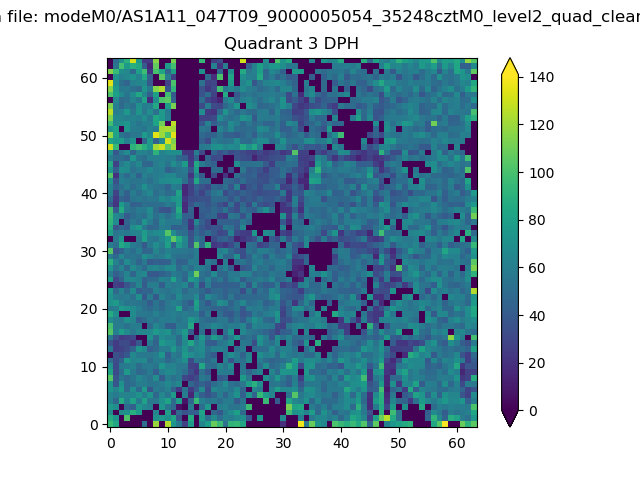 |
 |
Quadrant C |
| Plot type | Count rate plots | Images |
|---|---|---|
| Comparison with Poisson distribution Blue bars denote a histogram of data divided into 1 sec bins. Red curve is a Poisson curve with rate = median count rate of data. |
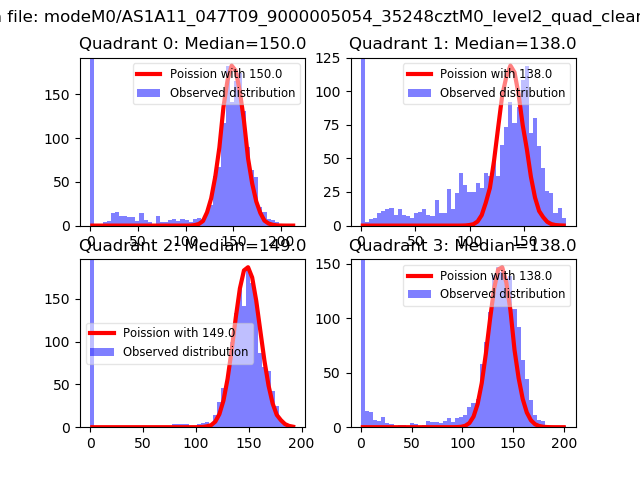 |
 |
| Quadrant-wise count rates Data is divided into 100 sec bins |
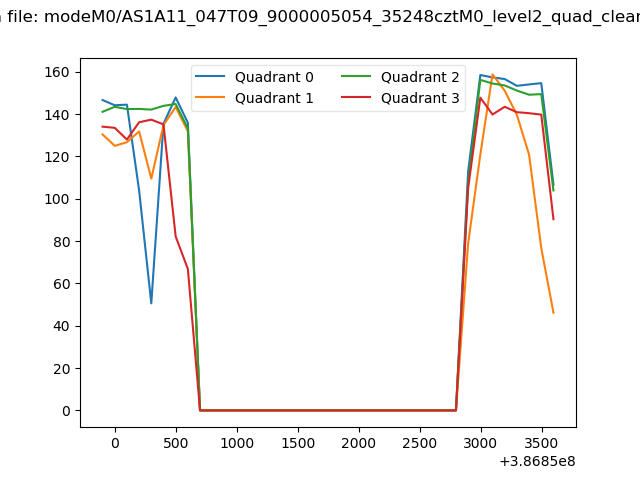 |
|
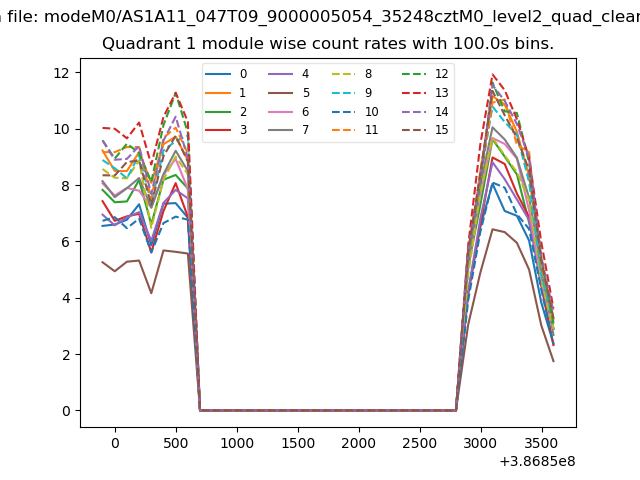
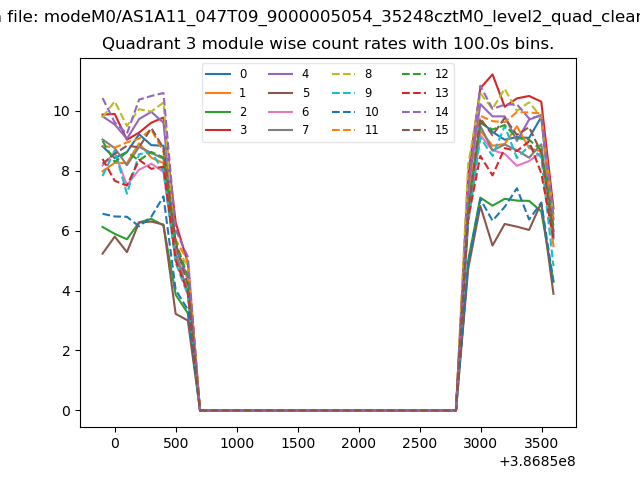
| Module-wise count rates for Quadrant A Data is divided into 100 sec bins |
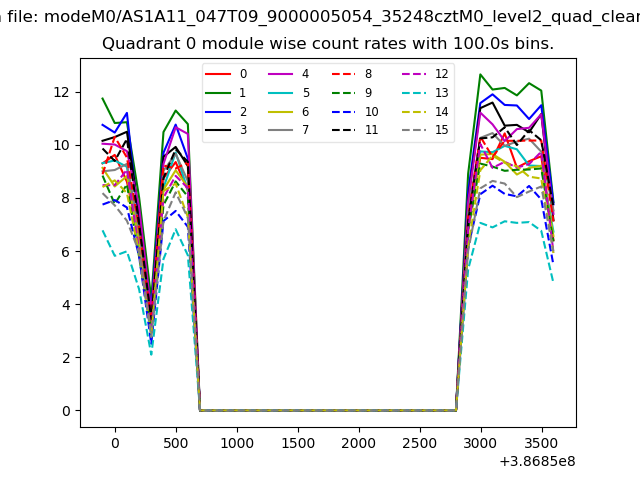 |
 |
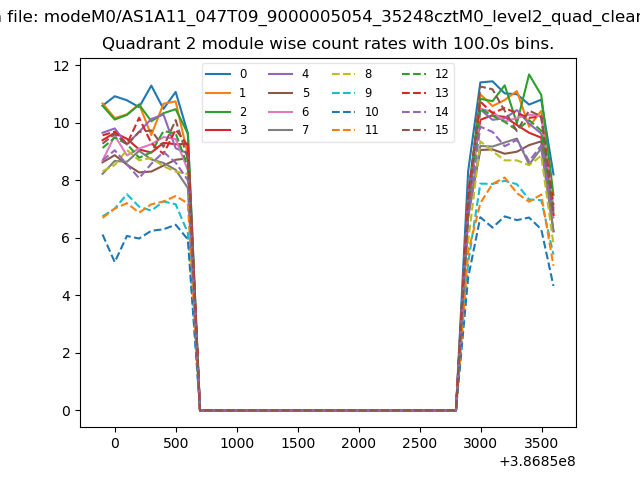
| Module-wise count rates for Quadrant B Data is divided into 100 sec bins |
 |
 |
| Module-wise count rates for Quadrant C Data is divided into 100 sec bins |
 |
 |
| Module-wise count rates for Quadrant D Data is divided into 100 sec bins |
 |
 |
| Parameter | Plot |
|---|---|
| CZT HV Monitor | 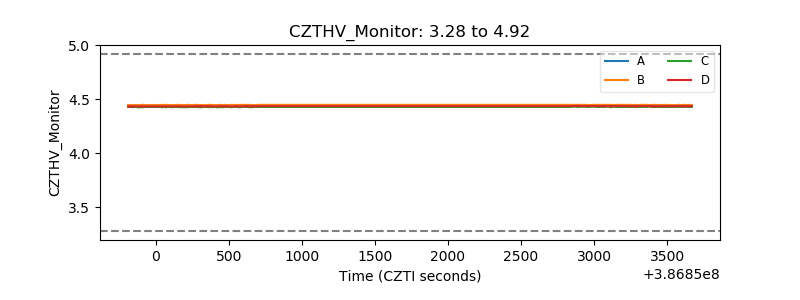 |
| D_VDD | 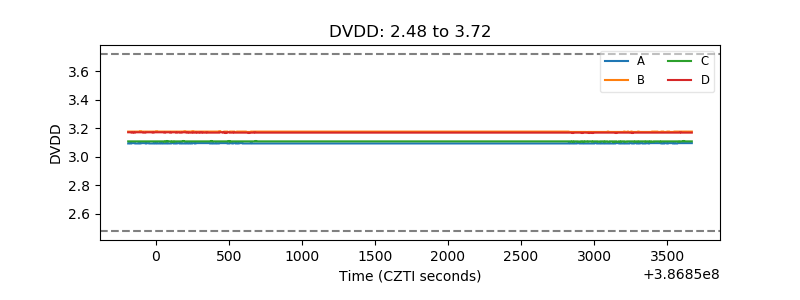 |
| Temperature 1 | 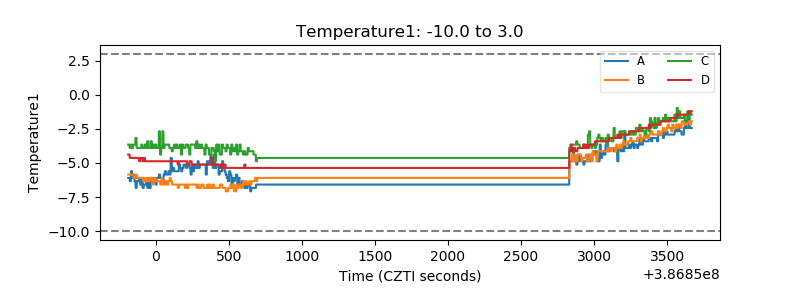 |
| Veto HV Monitor | 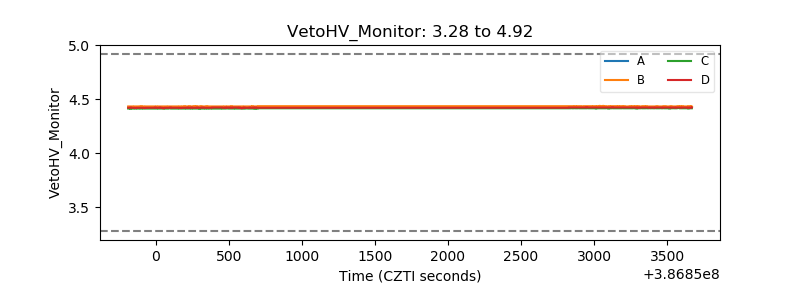 |
| Veto LLD | 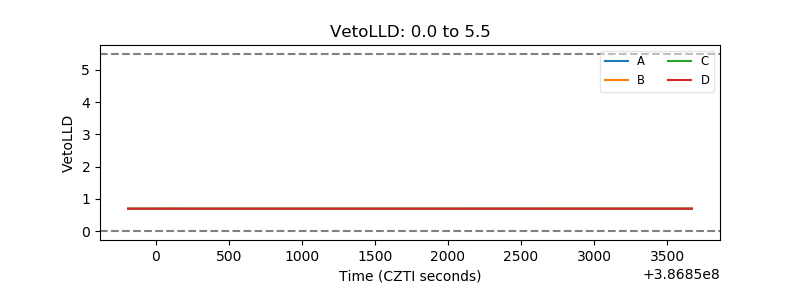 |
| Alpha Counter | 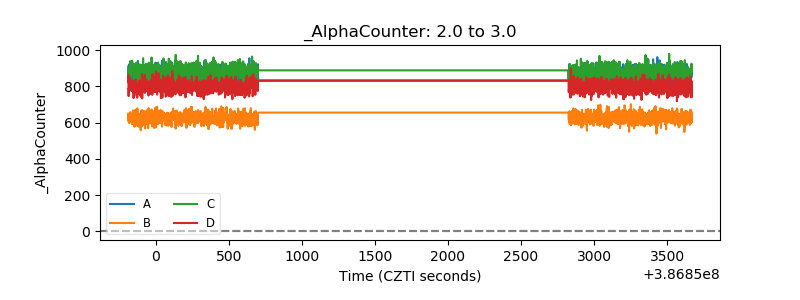 |
| _CPM_Rate | 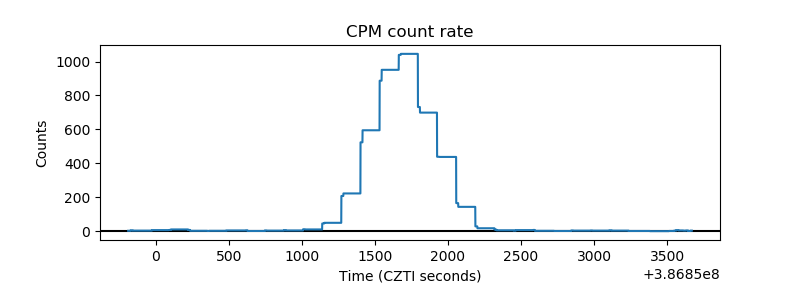 |
| CZT Counter | 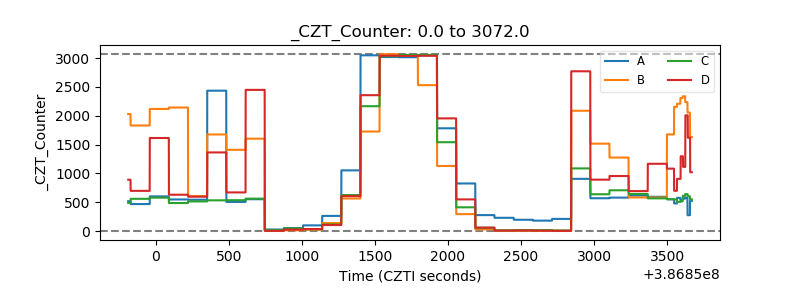 |
| +2.5 Volts monitor | 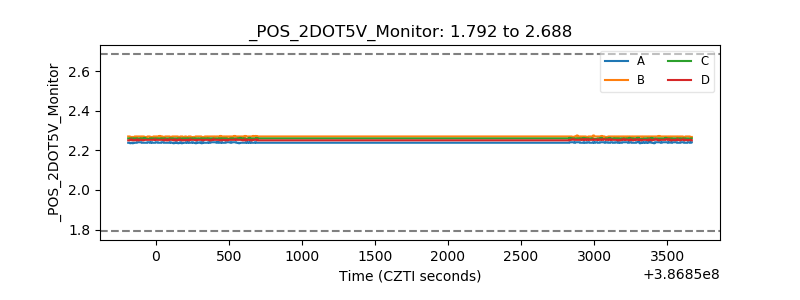 |
| +5 Volts monitor | 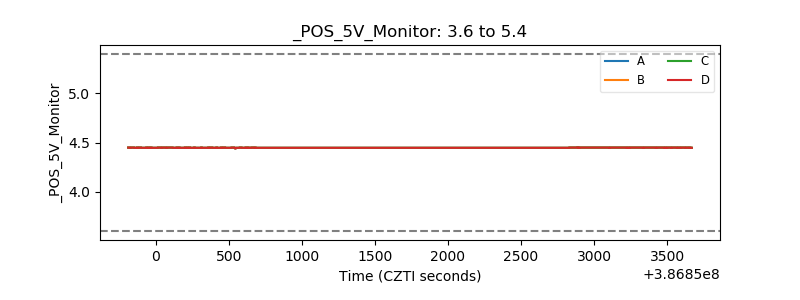 |
| _ROLL_ROT | 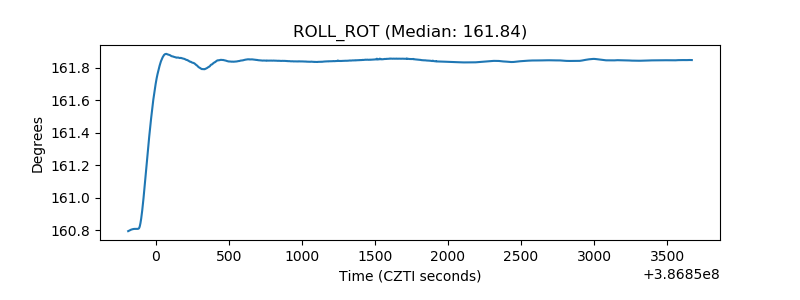 |
| _Roll_DEC | 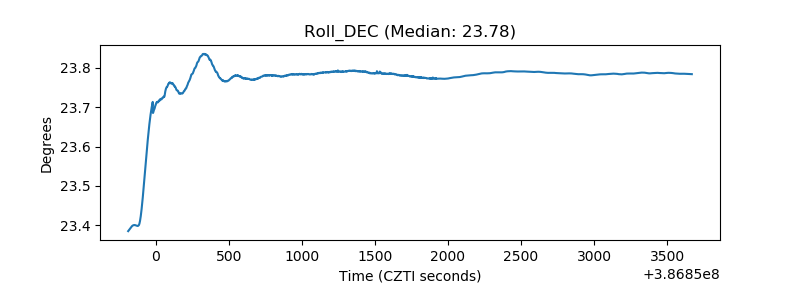 |
| _Roll_RA | 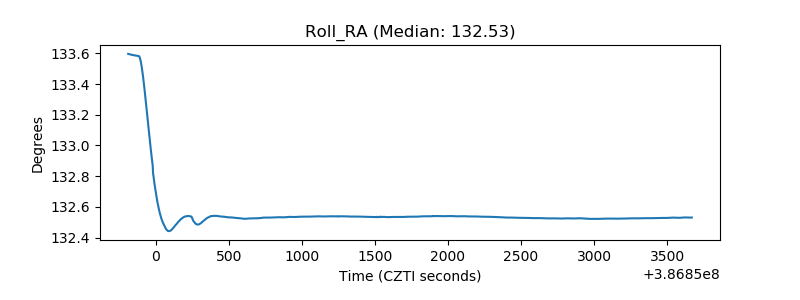 |
| Veto Counter | 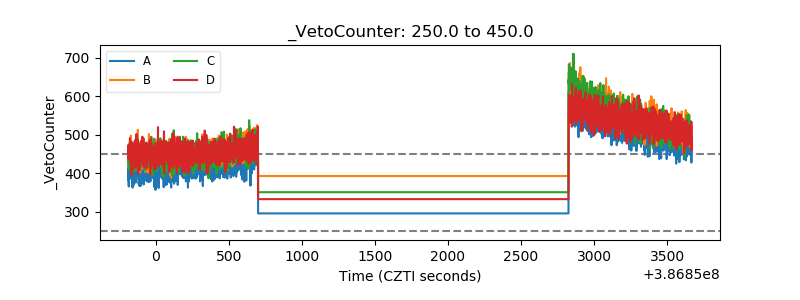 |