| Param | Original file | Final file |
|---|---|---|
| Filename | modeM0/AS1C07_004T01_9000005052_35242cztM0_level2.evt | modeM0/AS1C07_004T01_9000005052_35242cztM0_level2_quad_clean.evt |
| Size (bytes) | 762,779,520 | 85,176,000 |
| Size | 727.4 MB | 81.2 MB |
| Events in quadrant A | 3,687,022 | 535,847 |
| Events in quadrant B | 6,937,469 | 506,634 |
| Events in quadrant C | 4,030,627 | 545,178 |
| Events in quadrant D | 7,944,257 | 474,023 |
| Mode M0 | |||
|---|---|---|---|
| Quadrant | BADHDUFLAG | Total packets | Discarded packets |
| A | 0 | 15576 | 3 |
| B | 0 | 25596 | 2 |
| C | 0 | 16282 | 2 |
| D | 0 | 28884 | 2 |
| Mode SS | |||
|---|---|---|---|
| Quadrant | BADHDUFLAG | Total packets | Discarded packets |
| A | 0 | 152 | 0 |
| B | 0 | 152 | 0 |
| C | 0 | 152 | 0 |
| D | 0 | 152 | 0 |
| Mode M9 | |||
|---|---|---|---|
| Quadrant | BADHDUFLAG | Total packets | Discarded packets |
| A | 0 | 31 | 0 |
| B | 0 | 31 | 0 |
| C | 0 | 31 | 0 |
| D | 0 | 31 | 0 |
| Quadrant | Total seconds | Saturated seconds | Saturation percentage |
|---|---|---|---|
| A | 7431 | 55 | 0.740143% |
| B | 7431 | 1014 | 13.645539% |
| C | 7431 | 66 | 0.888171% |
| D | 7431 | 912 | 12.272911% |
Noise dominated data is calculated using 1-second bins in cleaned event files. If a bin has >2000 counts, and if more than 50% of those come from <1% of pixels, then it is considered to be noise-dominated and hence unusable.
| Quadrant | # 1 sec bins | Bins with >0 counts | Bins with >2000 counts | High rate bins dominated by noise | Noise dominated (total time) | Noise dominated (detector-on time) | Marked lightcurve |
|---|---|---|---|---|---|---|---|
| A | 10537 | 7433 | 30 | 30 | 0.28% | 0.40% | 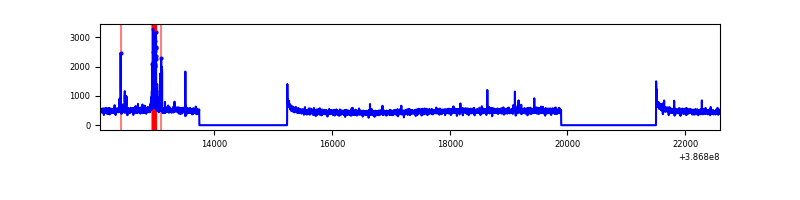 |
| B | 10537 | 7433 | 624 | 624 | 5.92% | 8.39% | 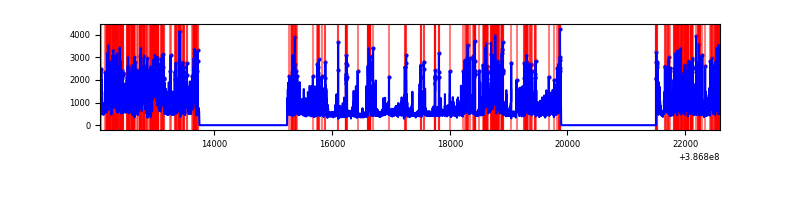 |
| C | 10537 | 7433 | 44 | 44 | 0.42% | 0.59% | 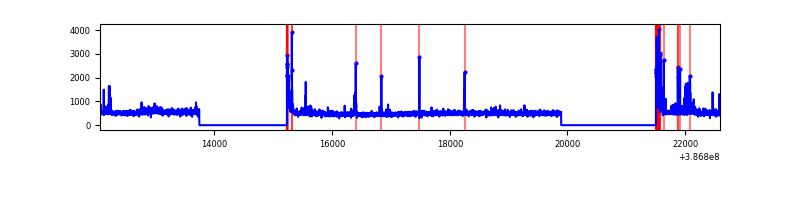 |
| D | 10537 | 7433 | 760 | 760 | 7.21% | 10.22% | 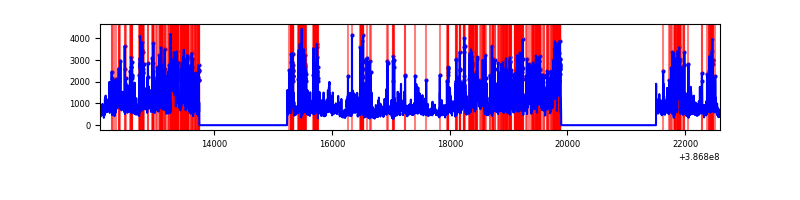 |
Top three noisy pixels from each quadrant. If the there are fewer than three noisy pixels in the level2.evt file, extra rows are filled as -1
| Pixel properties | Quadrant properties | ||||||
|---|---|---|---|---|---|---|---|
| Quadrant | DetID | PixID | Counts | Sigma | Mean | Median | Sigma |
| A | 7 | 3 | 144035 | 812.01 | 876 | 859 | 176.3 |
| A | 10 | 83 | 113595 | 639.37 | 876 | 859 | 176.3 |
| A | 13 | 6 | 25631 | 140.49 | 876 | 859 | 176.3 |
| B | 5 | 236 | 2449724 | 15436.67 | 831 | 809 | 158.6 |
| B | 5 | 172 | 1051622 | 6623.77 | 831 | 809 | 158.6 |
| B | 4 | 232 | 87429 | 546.01 | 831 | 809 | 158.6 |
| C | 0 | 10 | 373266 | 1886.81 | 847 | 851 | 197.4 |
| C | 15 | 214 | 308816 | 1560.28 | 847 | 851 | 197.4 |
| C | 9 | 187 | 14999 | 71.68 | 847 | 851 | 197.4 |
| D | 7 | 80 | 2019444 | 10213.87 | 812 | 790 | 197.6 |
| D | 8 | 195 | 1456455 | 7365.29 | 812 | 790 | 197.6 |
| D | 13 | 249 | 378250 | 1909.85 | 812 | 790 | 197.6 |
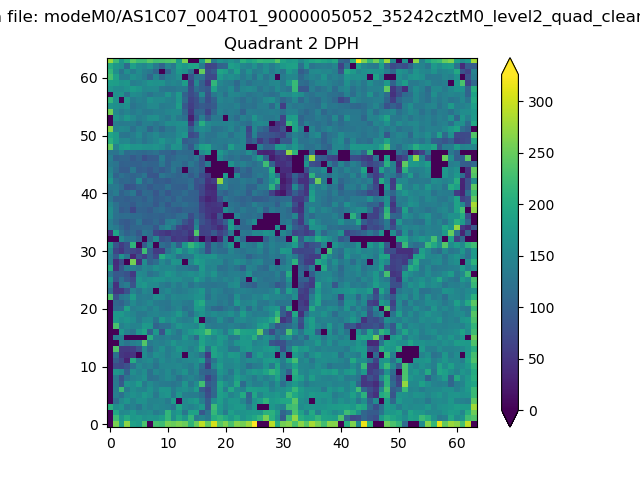
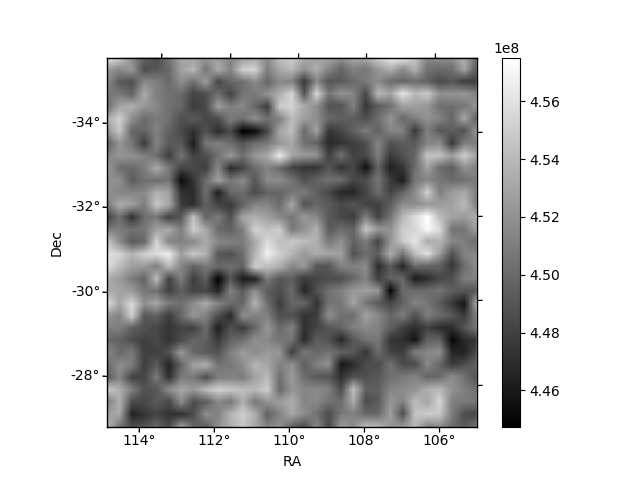
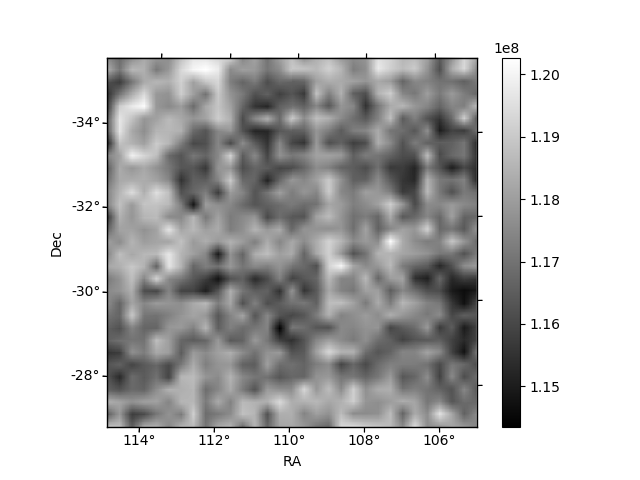
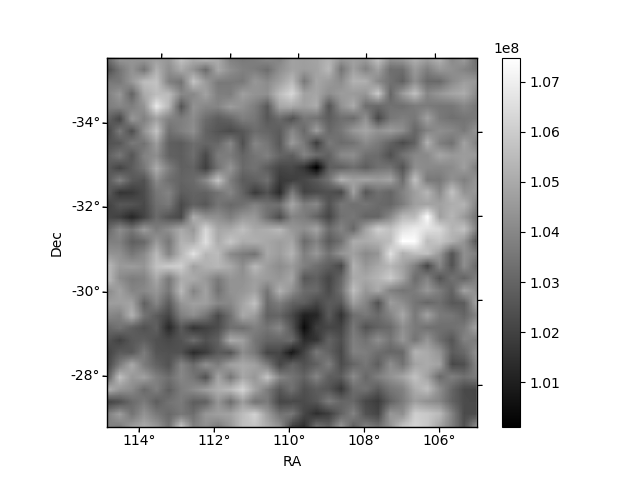
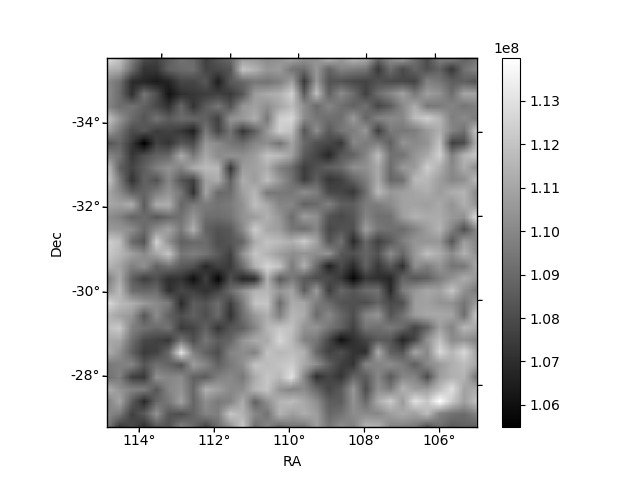
Histogram calculated using DETX and DETY for each event in the final _common_clean file
| Quadrant A | 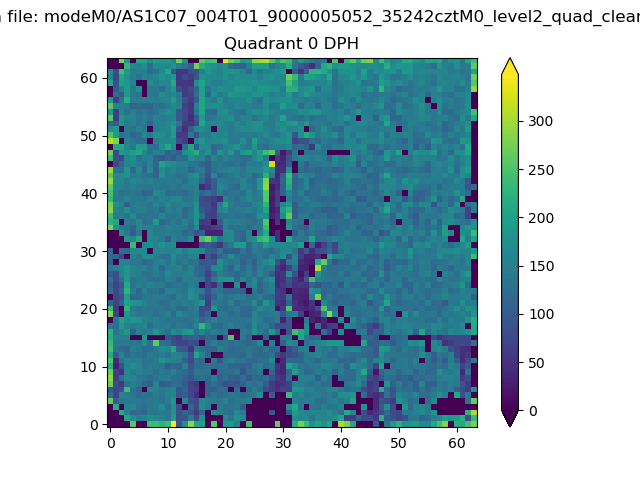 |
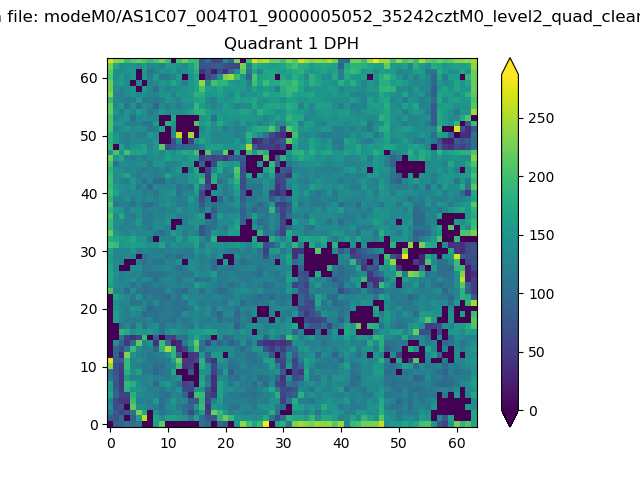 |
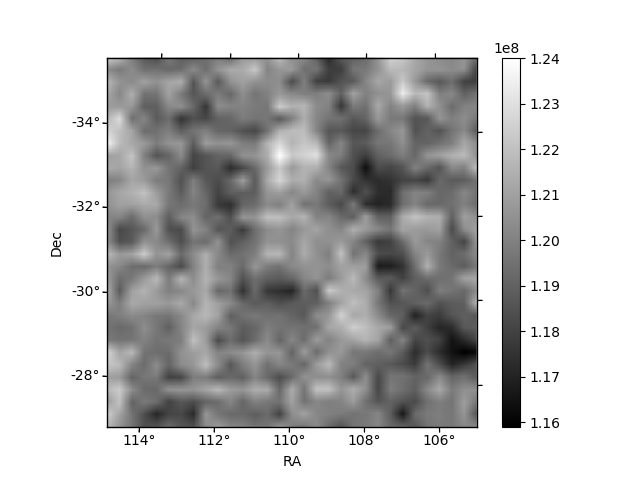
Quadrant B |
|---|---|---|---|
| Quadrant D | 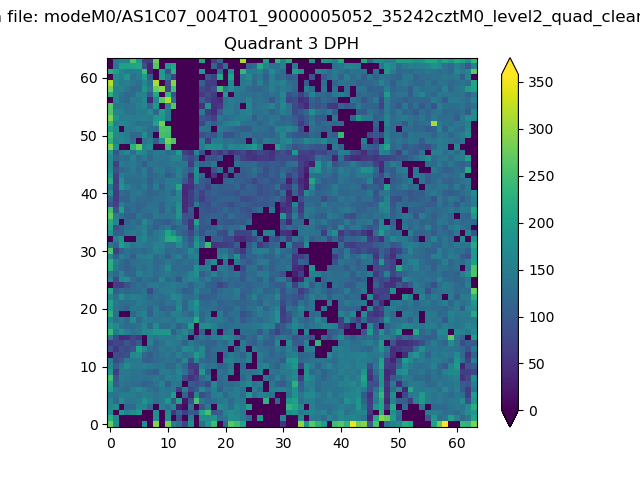 |
 |
Quadrant C |
| Plot type | Count rate plots | Images |
|---|---|---|
| Comparison with Poisson distribution Blue bars denote a histogram of data divided into 1 sec bins. Red curve is a Poisson curve with rate = median count rate of data. |
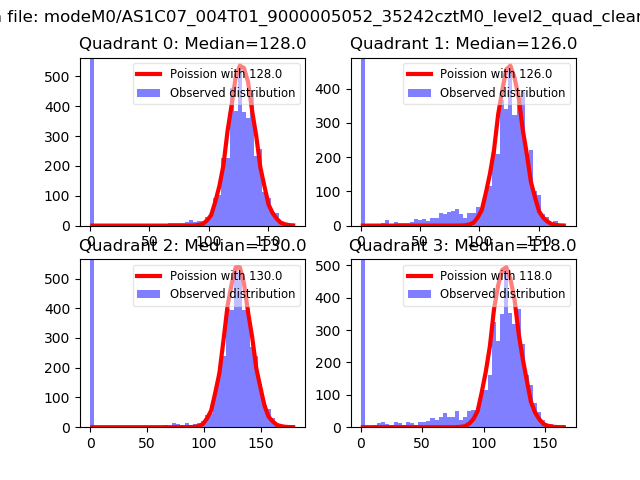 |
 |
| Quadrant-wise count rates Data is divided into 100 sec bins |
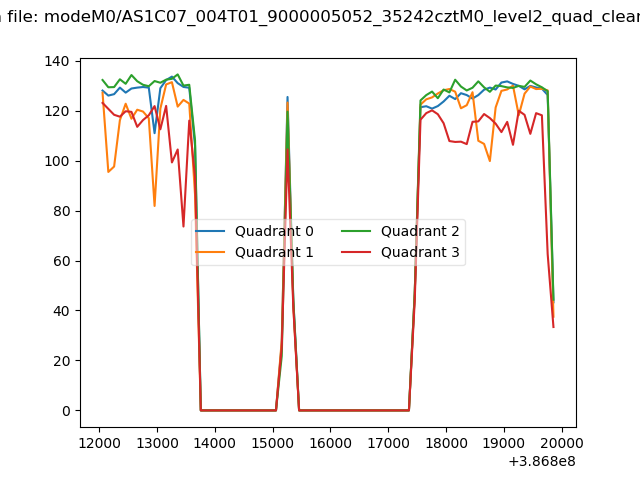 |
|
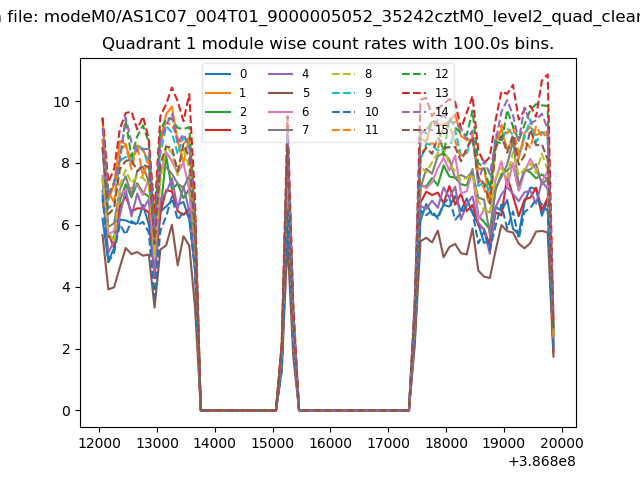
| Module-wise count rates for Quadrant A Data is divided into 100 sec bins |
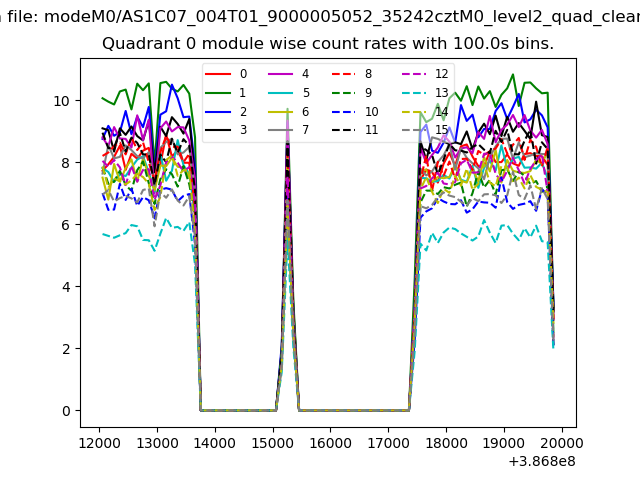 |
 |
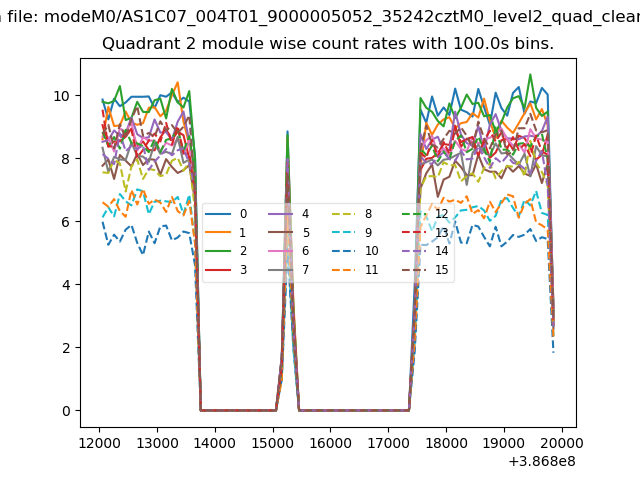
| Module-wise count rates for Quadrant B Data is divided into 100 sec bins |
 |
 |
| Module-wise count rates for Quadrant C Data is divided into 100 sec bins |
 |
 |
| Module-wise count rates for Quadrant D Data is divided into 100 sec bins |
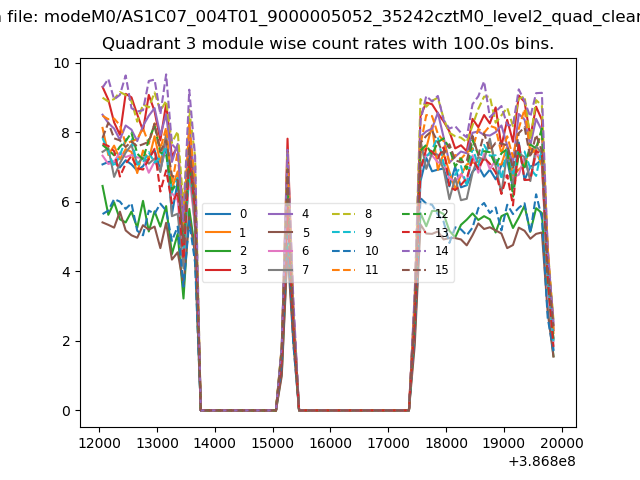 |
 |
| Parameter | Plot |
|---|---|
| CZT HV Monitor | 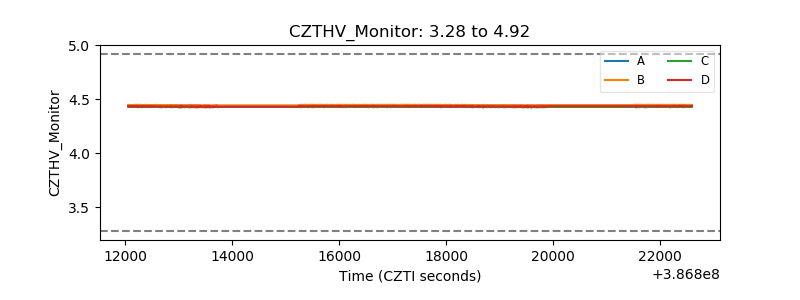 |
| D_VDD | 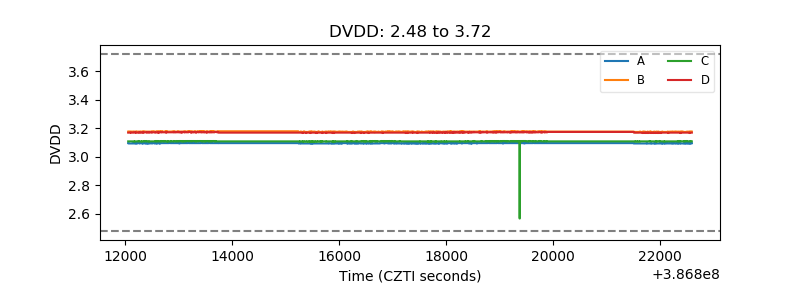 |
| Temperature 1 | 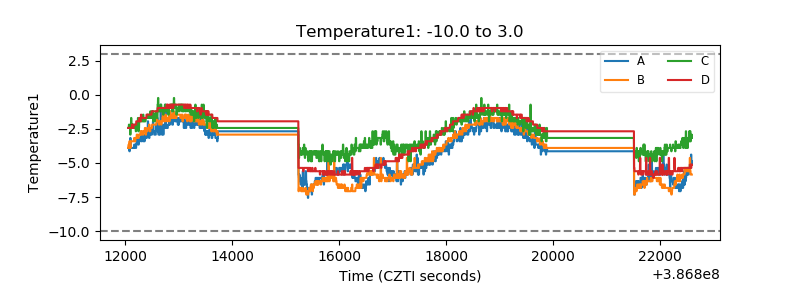 |
| Veto HV Monitor | 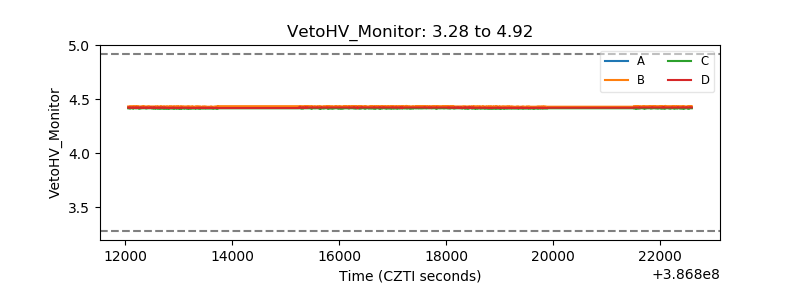 |
| Veto LLD | 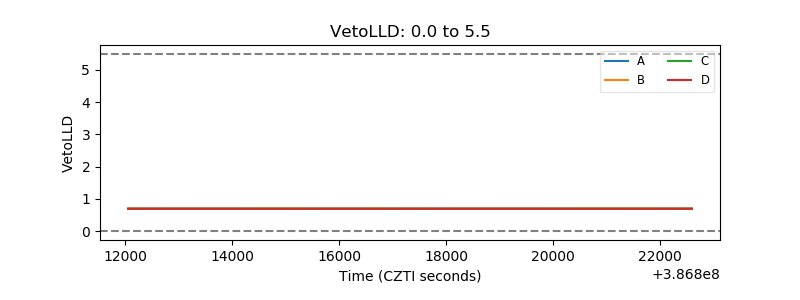 |
| Alpha Counter | 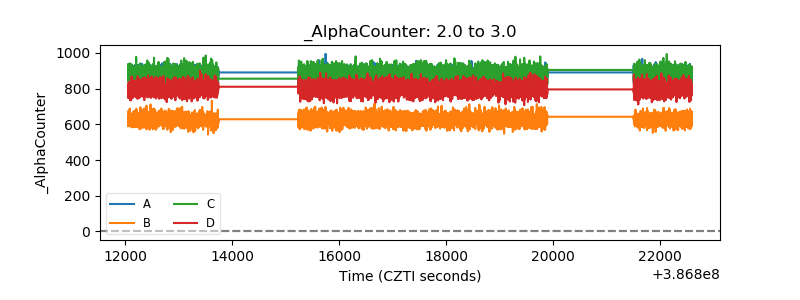 |
| _CPM_Rate | 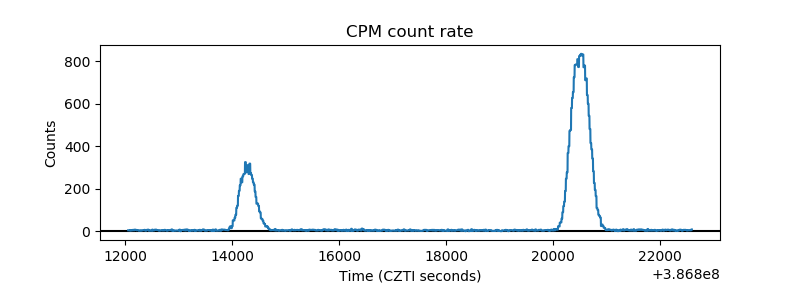 |
| CZT Counter | 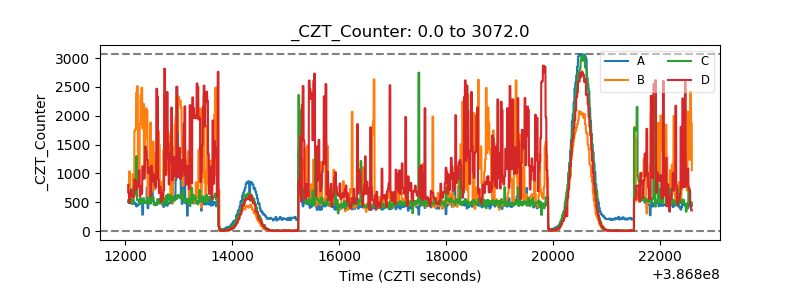 |
| +2.5 Volts monitor | 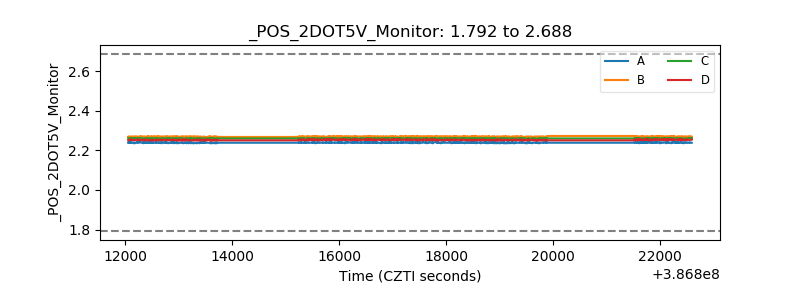 |
| +5 Volts monitor | 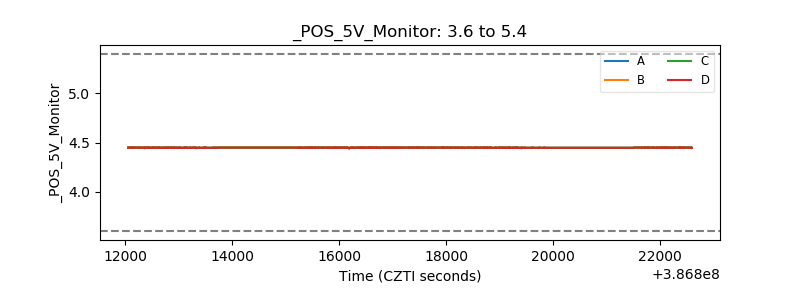 |
| _ROLL_ROT | 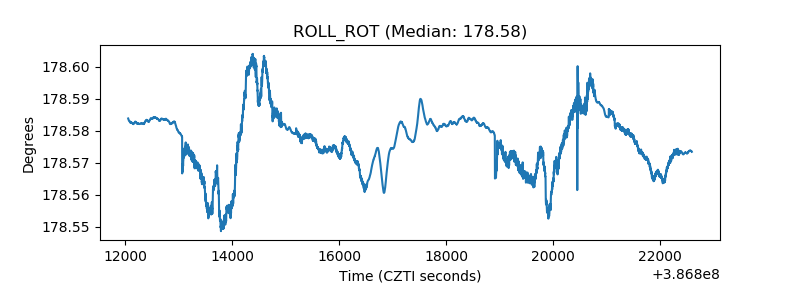 |
| _Roll_DEC | 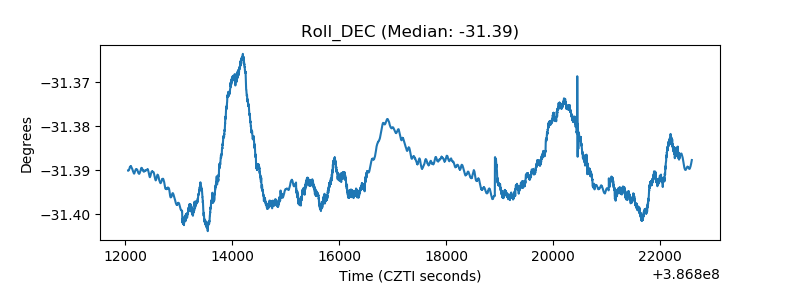 |
| _Roll_RA | 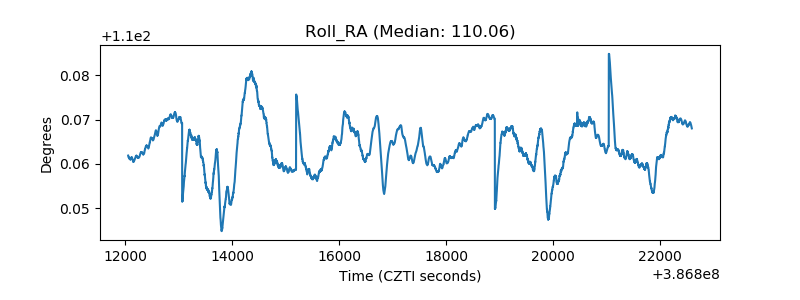 |
| Veto Counter | 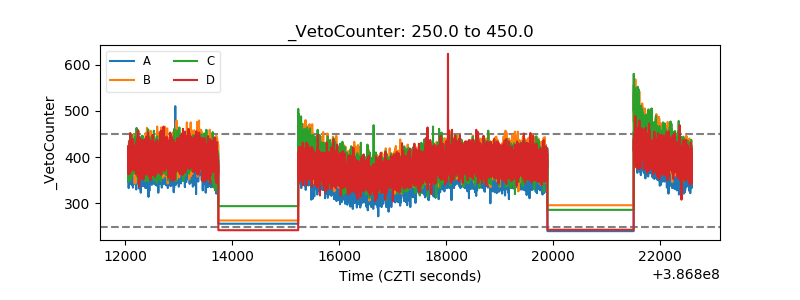 |