| Param | Original file | Final file |
|---|---|---|
| Filename | modeM0/AS1C07_004T01_9000005052_35241cztM0_level2.evt | modeM0/AS1C07_004T01_9000005052_35241cztM0_level2_quad_clean.evt |
| Size (bytes) | 1,639,967,040 | 135,362,880 |
| Size | 1.5 GB | 129.1 MB |
| Events in quadrant A | 6,272,496 | 874,550 |
| Events in quadrant B | 16,098,814 | 768,560 |
| Events in quadrant C | 6,813,127 | 879,462 |
| Events in quadrant D | 19,588,407 | 655,501 |
| Mode M0 | |||
|---|---|---|---|
| Quadrant | BADHDUFLAG | Total packets | Discarded packets |
| A | 0 | 27453 | 4 |
| B | 0 | 56951 | 3 |
| C | 0 | 28270 | 3 |
| D | 0 | 67488 | 3 |
| Mode SS | |||
|---|---|---|---|
| Quadrant | BADHDUFLAG | Total packets | Discarded packets |
| A | 0 | 268 | 0 |
| B | 0 | 268 | 0 |
| C | 0 | 268 | 0 |
| D | 0 | 268 | 0 |
| Mode M9 | |||
|---|---|---|---|
| Quadrant | BADHDUFLAG | Total packets | Discarded packets |
| A | 0 | 35 | 0 |
| B | 0 | 35 | 0 |
| C | 0 | 35 | 0 |
| D | 0 | 36 | 0 |
| Quadrant | Total seconds | Saturated seconds | Saturation percentage |
|---|---|---|---|
| A | 13309 | 58 | 0.435795% |
| B | 13309 | 3469 | 26.065069% |
| C | 13309 | 105 | 0.788940% |
| D | 13309 | 4122 | 30.971523% |
Noise dominated data is calculated using 1-second bins in cleaned event files. If a bin has >2000 counts, and if more than 50% of those come from <1% of pixels, then it is considered to be noise-dominated and hence unusable.
| Quadrant | # 1 sec bins | Bins with >0 counts | Bins with >2000 counts | High rate bins dominated by noise | Noise dominated (total time) | Noise dominated (detector-on time) | Marked lightcurve |
|---|---|---|---|---|---|---|---|
| A | 15996 | 13311 | 21 | 21 | 0.13% | 0.16% | 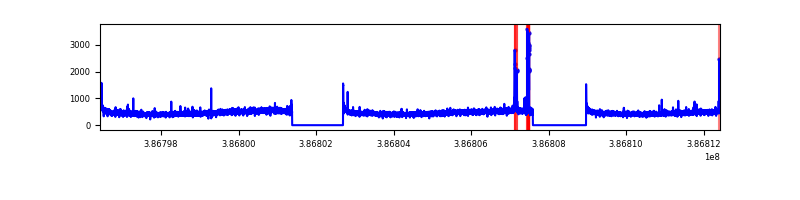 |
| B | 15996 | 13311 | 2420 | 2420 | 15.13% | 18.18% |  |
| C | 15996 | 13311 | 82 | 82 | 0.51% | 0.62% | 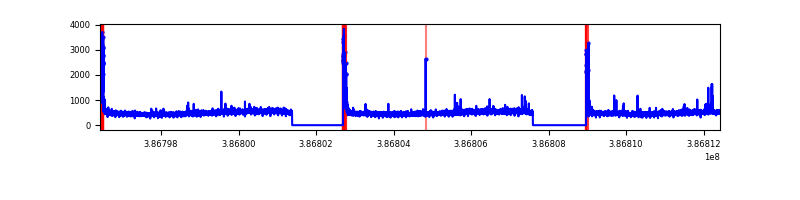 |
| D | 15996 | 13310 | 3670 | 3670 | 22.94% | 27.57% | 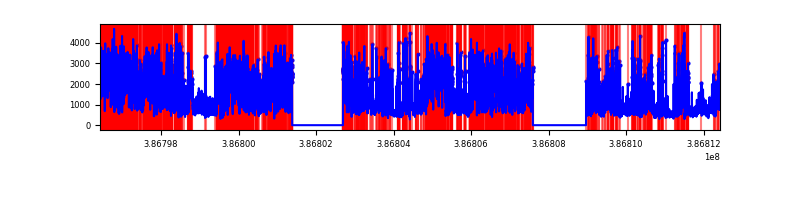 |
Top three noisy pixels from each quadrant. If the there are fewer than three noisy pixels in the level2.evt file, extra rows are filled as -1
| Pixel properties | Quadrant properties | ||||||
|---|---|---|---|---|---|---|---|
| Quadrant | DetID | PixID | Counts | Sigma | Mean | Median | Sigma |
| A | 10 | 83 | 181198 | 583.18 | 1530 | 1500 | 308.1 |
| A | 7 | 3 | 113553 | 363.65 | 1530 | 1500 | 308.1 |
| A | 13 | 6 | 36089 | 112.25 | 1530 | 1500 | 308.1 |
| B | 5 | 236 | 7110846 | 27127.18 | 1371 | 1337 | 262.1 |
| B | 5 | 172 | 3485004 | 13292.35 | 1371 | 1337 | 262.1 |
| B | 4 | 232 | 59132 | 220.52 | 1371 | 1337 | 262.1 |
| C | 15 | 214 | 548986 | 1583.25 | 1488 | 1497 | 345.8 |
| C | 0 | 10 | 419390 | 1208.48 | 1488 | 1497 | 345.8 |
| C | 14 | 67 | 20154 | 53.95 | 1488 | 1497 | 345.8 |
| D | 7 | 80 | 9102960 | 29544.13 | 1272 | 1236 | 308.1 |
| D | 8 | 195 | 2959622 | 9602.9 | 1272 | 1236 | 308.1 |
| D | 13 | 249 | 842847 | 2731.86 | 1272 | 1236 | 308.1 |
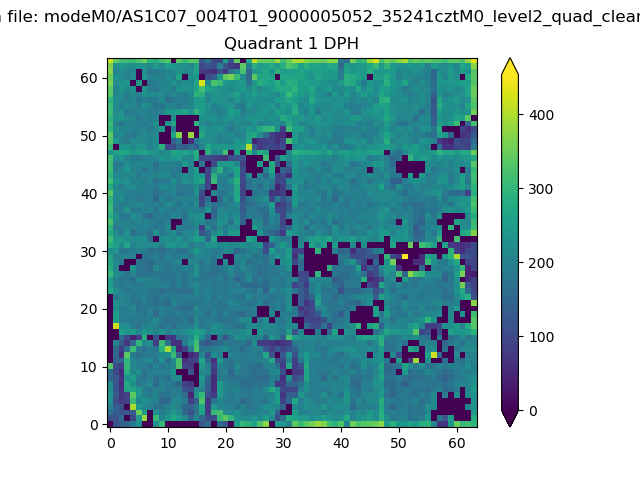
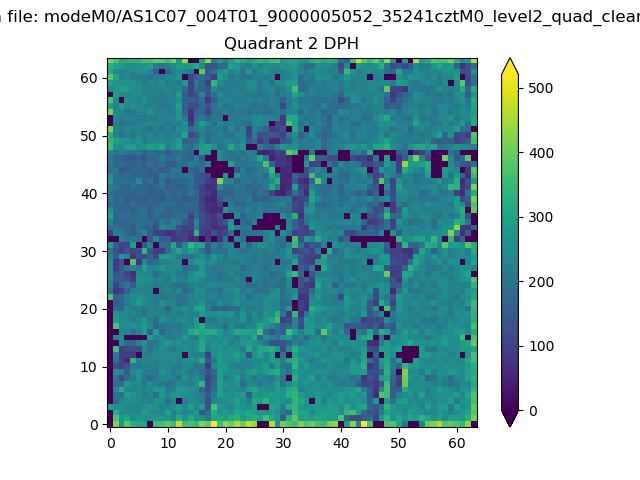
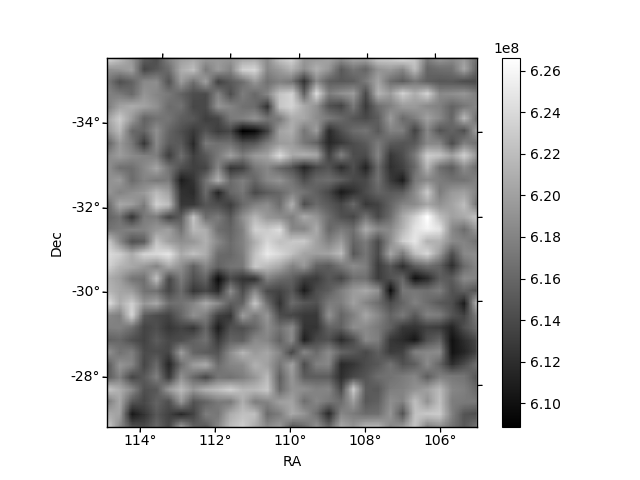
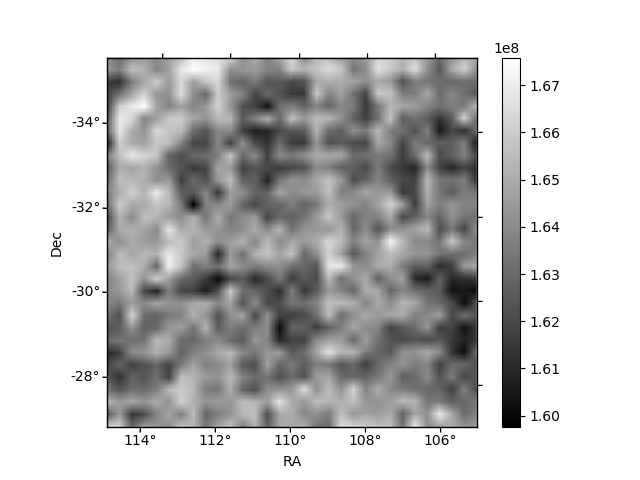
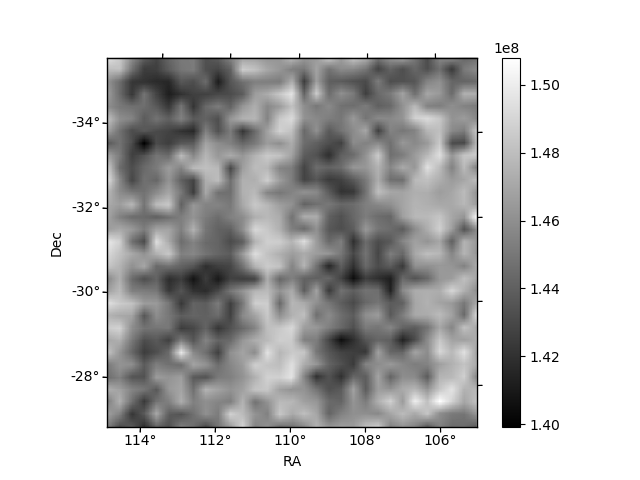
Histogram calculated using DETX and DETY for each event in the final _common_clean file
| Quadrant A | 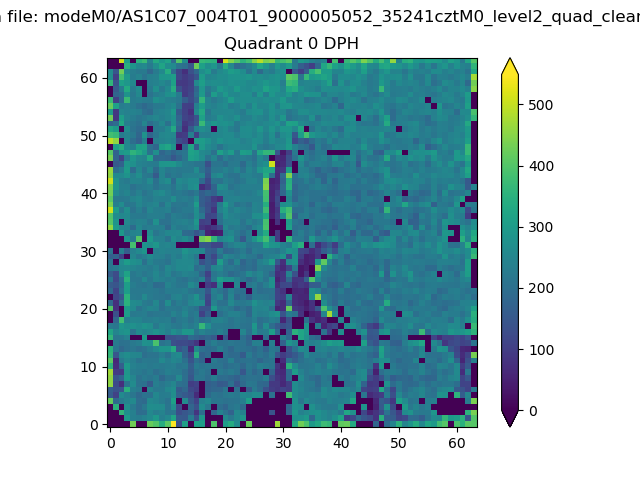 |
 |
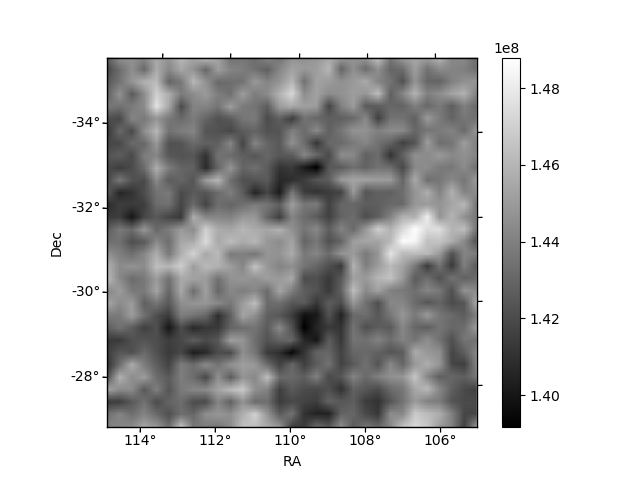
Quadrant B |
|---|---|---|---|
| Quadrant D | 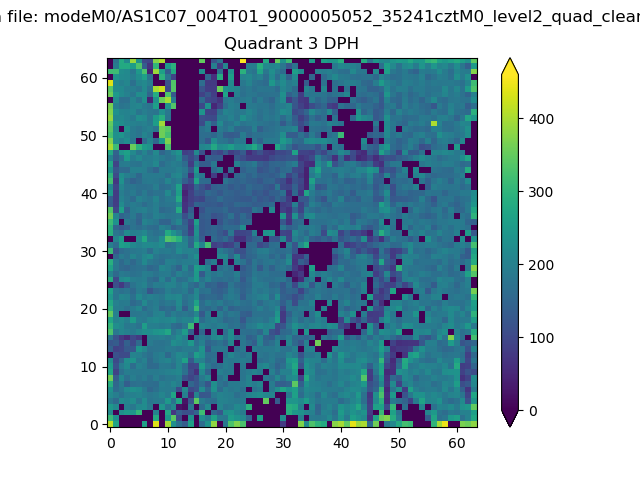 |
 |
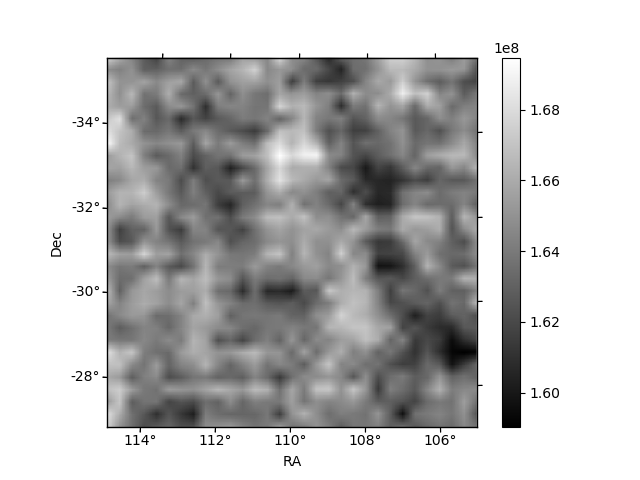
Quadrant C |
| Plot type | Count rate plots | Images |
|---|---|---|
| Comparison with Poisson distribution Blue bars denote a histogram of data divided into 1 sec bins. Red curve is a Poisson curve with rate = median count rate of data. |
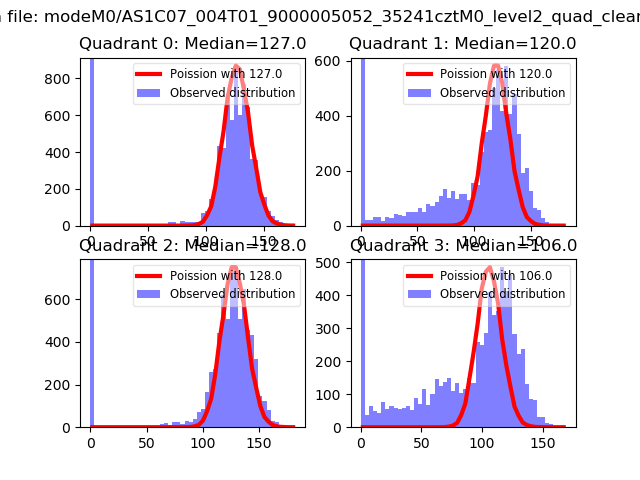 |
 |
| Quadrant-wise count rates Data is divided into 100 sec bins |
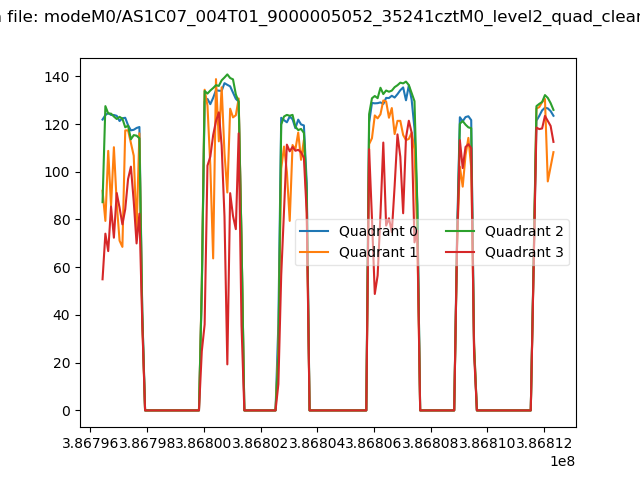 |
|
| Module-wise count rates for Quadrant A Data is divided into 100 sec bins |
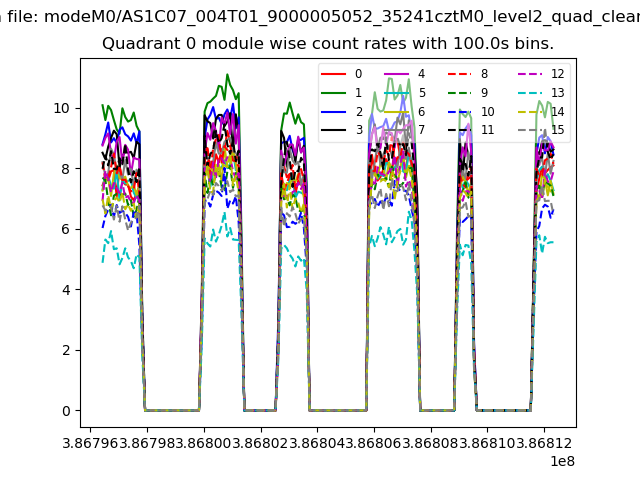 |
 |
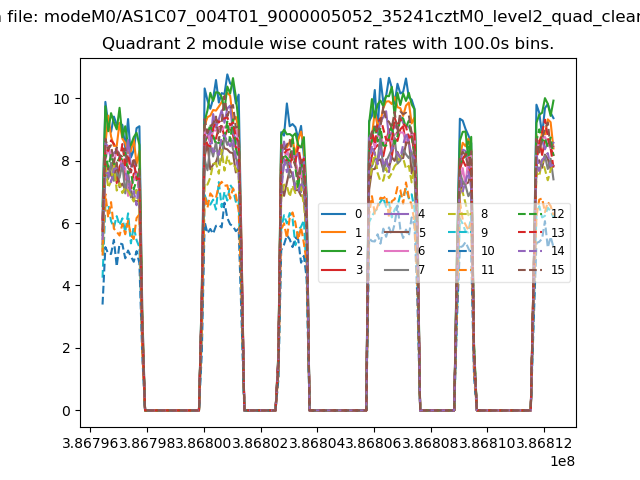
| Module-wise count rates for Quadrant B Data is divided into 100 sec bins |
 |
 |
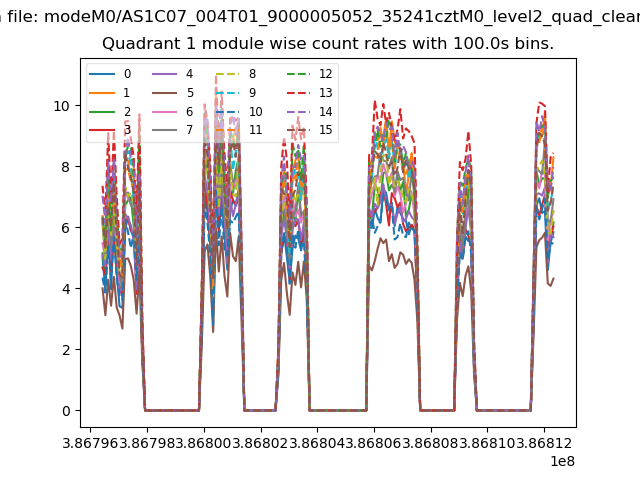
| Module-wise count rates for Quadrant C Data is divided into 100 sec bins |
 |
 |
| Module-wise count rates for Quadrant D Data is divided into 100 sec bins |
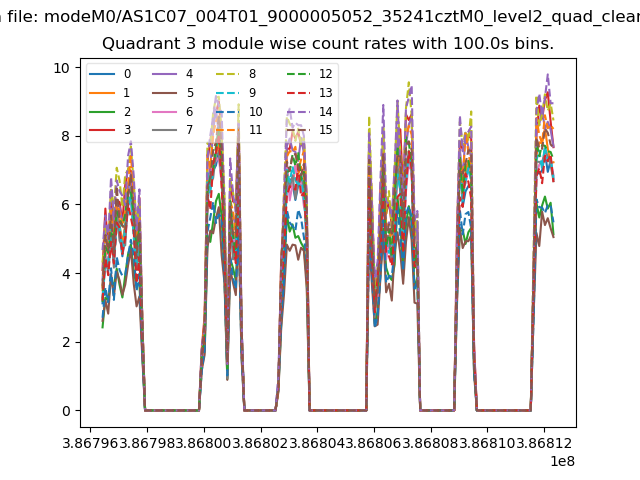 |
 |
| Parameter | Plot |
|---|---|
| CZT HV Monitor | 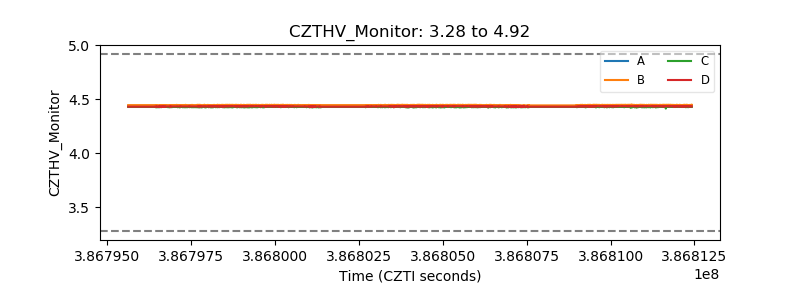 |
| D_VDD | 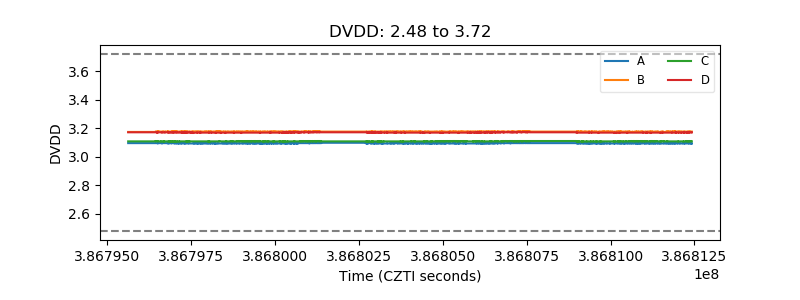 |
| Temperature 1 | 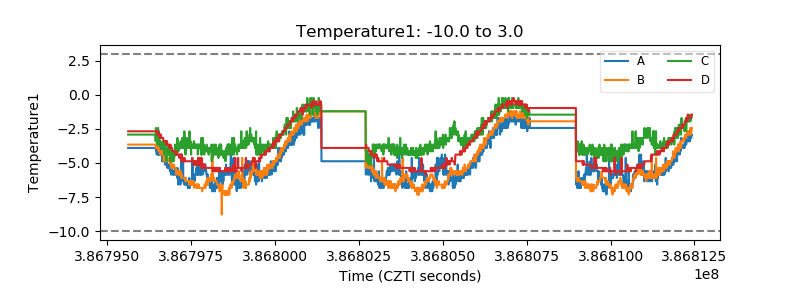 |
| Veto HV Monitor | 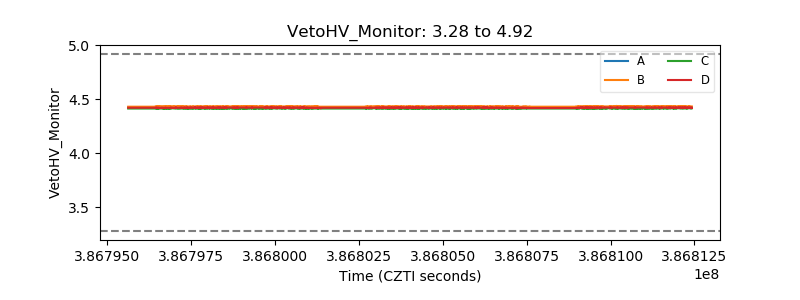 |
| Veto LLD | 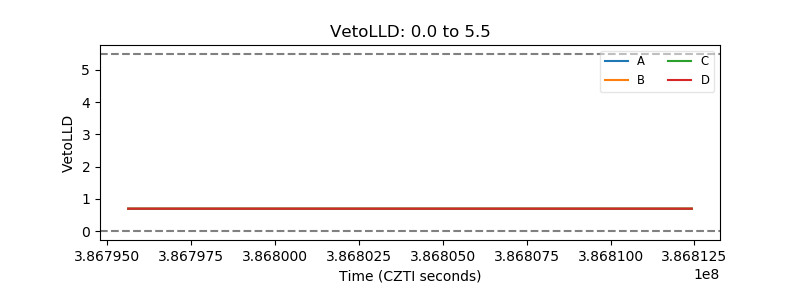 |
| Alpha Counter | 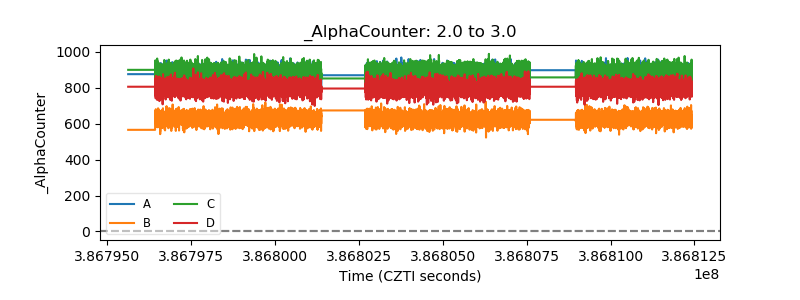 |
| _CPM_Rate | 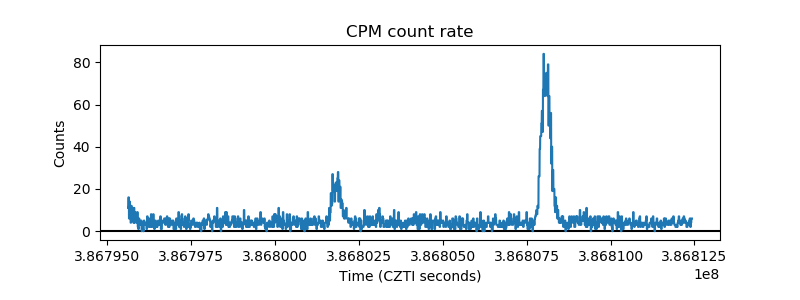 |
| CZT Counter | 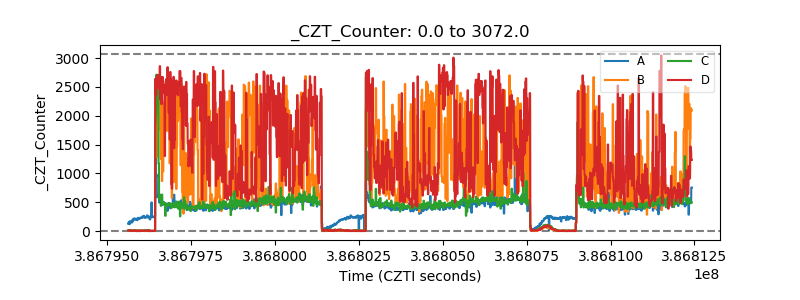 |
| +2.5 Volts monitor | 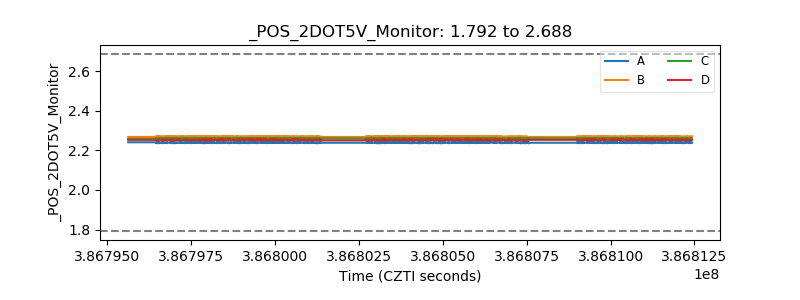 |
| +5 Volts monitor | 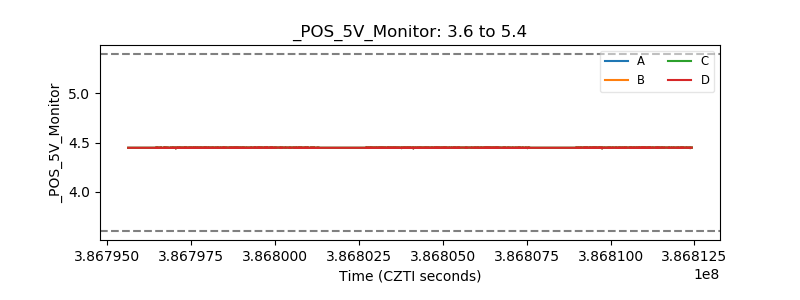 |
| _ROLL_ROT | 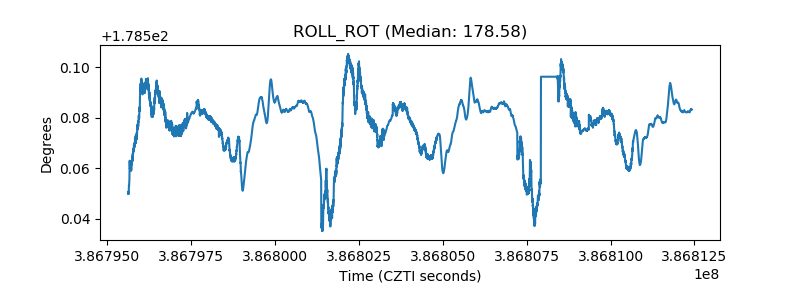 |
| _Roll_DEC | 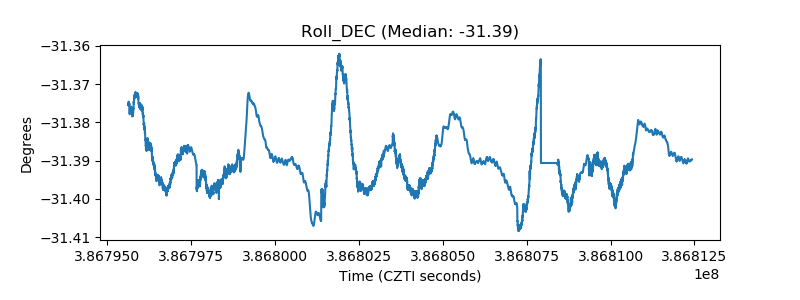 |
| _Roll_RA | 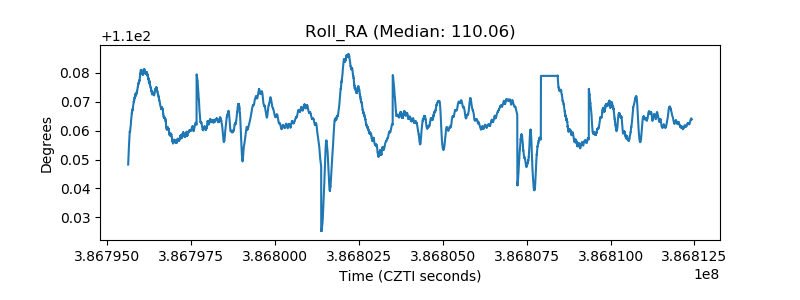 |
| Veto Counter | 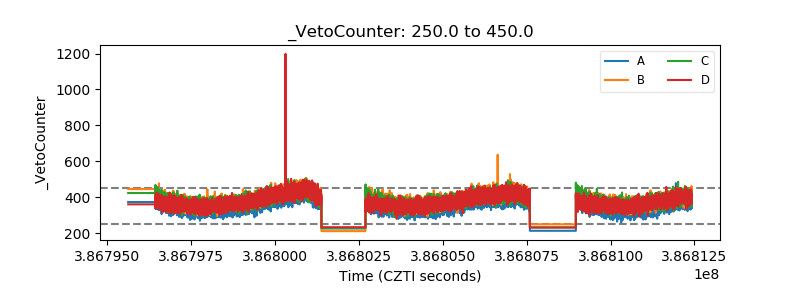 |