| Param | Original file | Final file |
|---|---|---|
| Filename | modeM0/AS1C07_004T01_9000005052_35237cztM0_level2.evt | modeM0/AS1C07_004T01_9000005052_35237cztM0_level2_quad_clean.evt |
| Size (bytes) | 693,331,200 | 65,327,040 |
| Size | 661.2 MB | 62.3 MB |
| Events in quadrant A | 2,666,953 | 439,604 |
| Events in quadrant B | 8,511,291 | 331,162 |
| Events in quadrant C | 3,019,807 | 437,571 |
| Events in quadrant D | 6,420,744 | 376,094 |
| Mode M0 | |||
|---|---|---|---|
| Quadrant | BADHDUFLAG | Total packets | Discarded packets |
| A | 0 | 11612 | 3 |
| B | 0 | 29172 | 2 |
| C | 0 | 12399 | 2 |
| D | 0 | 22984 | 2 |
| Mode SS | |||
|---|---|---|---|
| Quadrant | BADHDUFLAG | Total packets | Discarded packets |
| A | 0 | 114 | 0 |
| B | 0 | 114 | 0 |
| C | 0 | 114 | 0 |
| D | 0 | 114 | 0 |
| Mode M9 | |||
|---|---|---|---|
| Quadrant | BADHDUFLAG | Total packets | Discarded packets |
| A | 0 | 22 | 0 |
| B | 0 | 22 | 0 |
| C | 0 | 22 | 0 |
| D | 0 | 23 | 0 |
| Quadrant | Total seconds | Saturated seconds | Saturation percentage |
|---|---|---|---|
| A | 5611 | 8 | 0.142577% |
| B | 5611 | 2267 | 40.402780% |
| C | 5611 | 41 | 0.730708% |
| D | 5611 | 644 | 11.477455% |
Noise dominated data is calculated using 1-second bins in cleaned event files. If a bin has >2000 counts, and if more than 50% of those come from <1% of pixels, then it is considered to be noise-dominated and hence unusable.
| Quadrant | # 1 sec bins | Bins with >0 counts | Bins with >2000 counts | High rate bins dominated by noise | Noise dominated (total time) | Noise dominated (detector-on time) | Marked lightcurve |
|---|---|---|---|---|---|---|---|
| A | 7104 | 5612 | 1 | 1 | 0.01% | 0.02% | 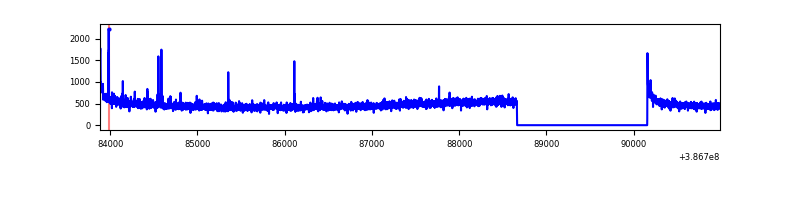 |
| B | 7103 | 5611 | 1694 | 1694 | 23.85% | 30.19% | 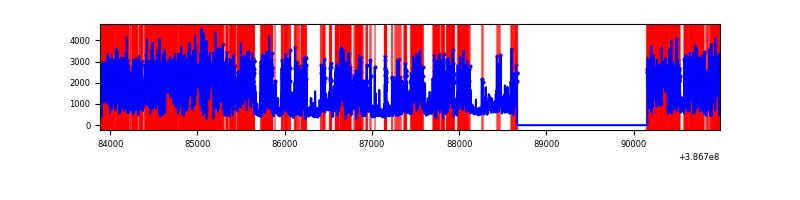 |
| C | 7104 | 5612 | 28 | 28 | 0.39% | 0.50% | 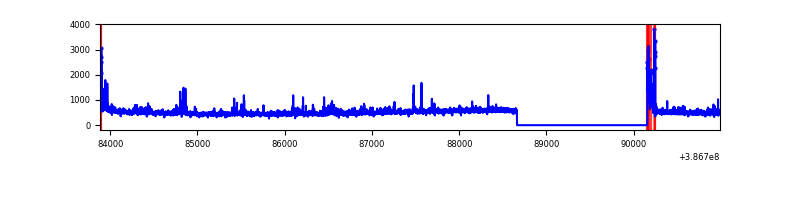 |
| D | 7103 | 5611 | 639 | 639 | 9.00% | 11.39% | 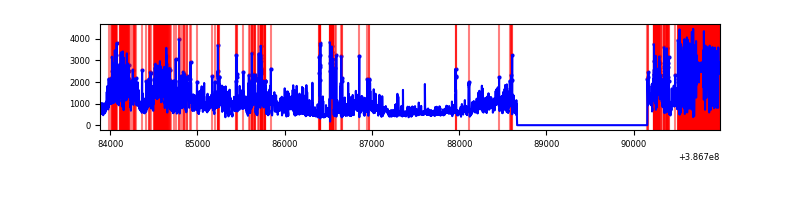 |
Top three noisy pixels from each quadrant. If the there are fewer than three noisy pixels in the level2.evt file, extra rows are filled as -1
| Pixel properties | Quadrant properties | ||||||
|---|---|---|---|---|---|---|---|
| Quadrant | DetID | PixID | Counts | Sigma | Mean | Median | Sigma |
| A | 10 | 83 | 104778 | 792.71 | 648 | 637 | 131.4 |
| A | 9 | 143 | 29534 | 219.96 | 648 | 637 | 131.4 |
| A | 13 | 6 | 11829 | 85.19 | 648 | 637 | 131.4 |
| B | 5 | 236 | 4866775 | 46581.74 | 537 | 524 | 104.5 |
| B | 5 | 172 | 1395213 | 13350.53 | 537 | 524 | 104.5 |
| B | 4 | 232 | 81577 | 775.87 | 537 | 524 | 104.5 |
| C | 0 | 10 | 291624 | 2001.99 | 625 | 631 | 145.4 |
| C | 15 | 214 | 236391 | 1621.99 | 625 | 631 | 145.4 |
| C | 14 | 67 | 21494 | 143.53 | 625 | 631 | 145.4 |
| D | 8 | 195 | 2107748 | 14390.33 | 599 | 583 | 146.4 |
| D | 7 | 80 | 683016 | 4660.5 | 599 | 583 | 146.4 |
| D | 2 | 250 | 371694 | 2534.4 | 599 | 583 | 146.4 |
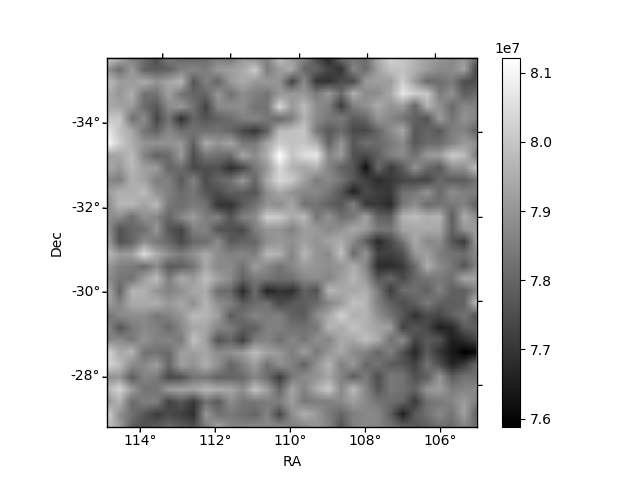
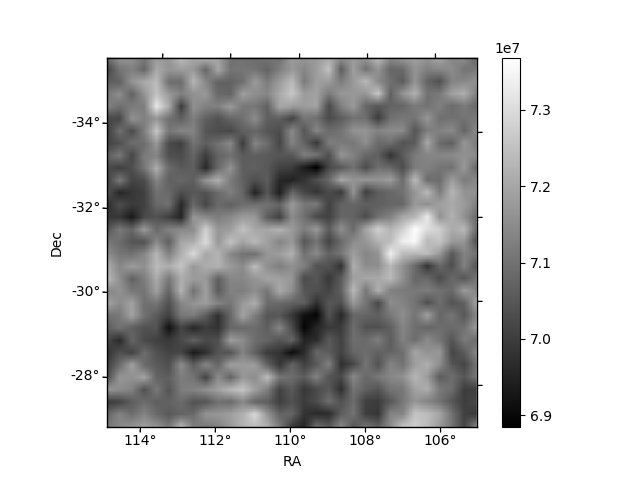
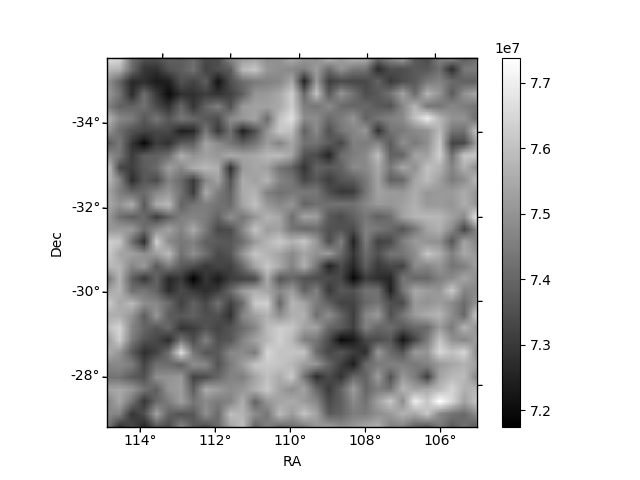
Histogram calculated using DETX and DETY for each event in the final _common_clean file
| Quadrant A | 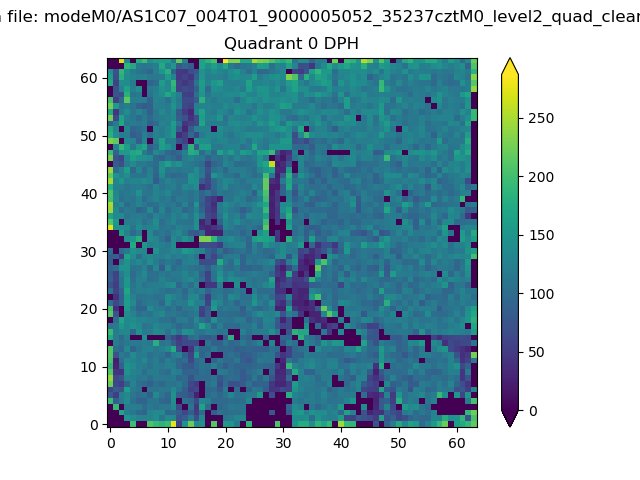 |
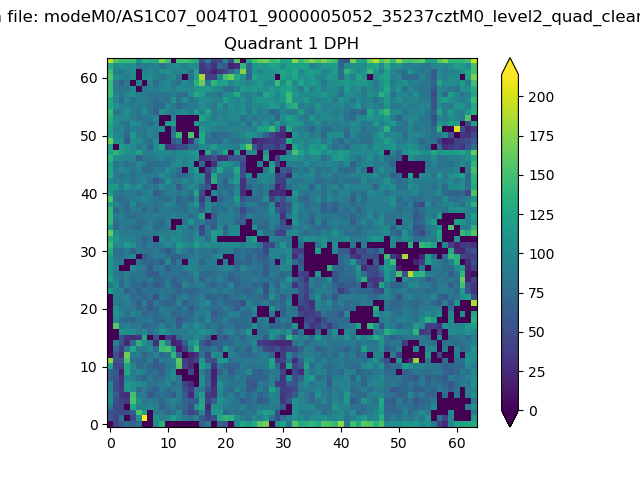 |
Quadrant B |
|---|---|---|---|
| Quadrant D | 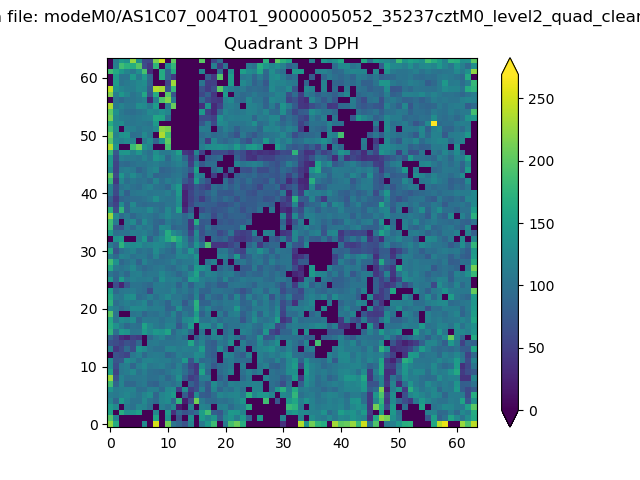 |
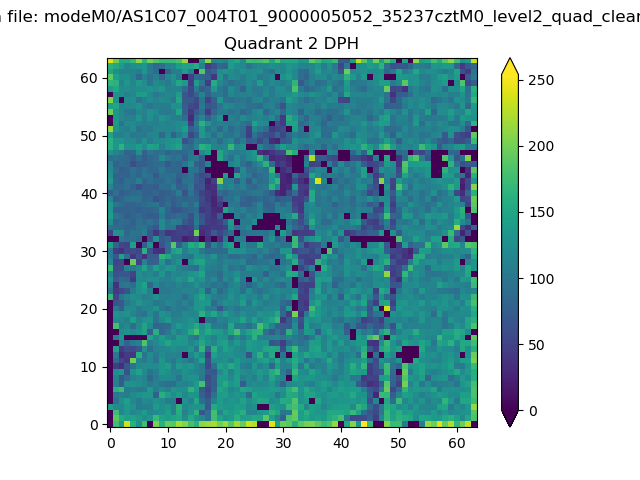 |
Quadrant C |
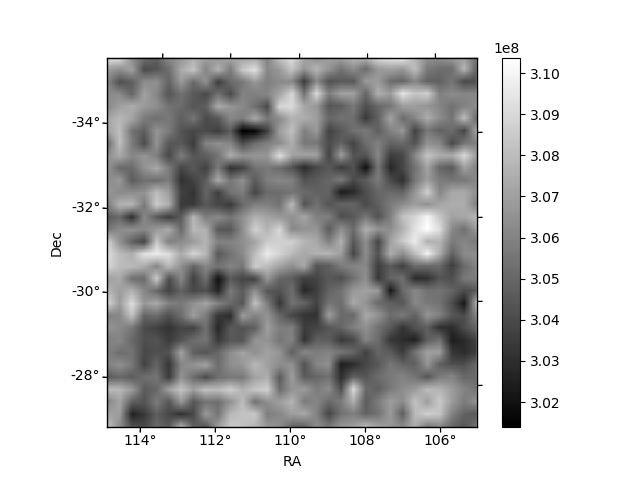
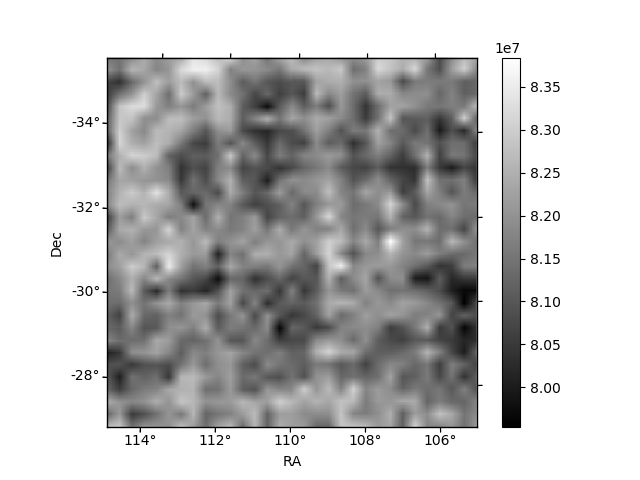
| Plot type | Count rate plots | Images |
|---|---|---|
| Comparison with Poisson distribution Blue bars denote a histogram of data divided into 1 sec bins. Red curve is a Poisson curve with rate = median count rate of data. |
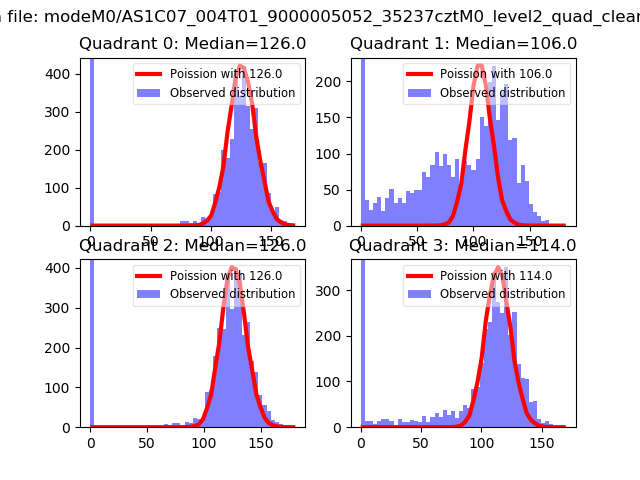 |
 |
| Quadrant-wise count rates Data is divided into 100 sec bins |
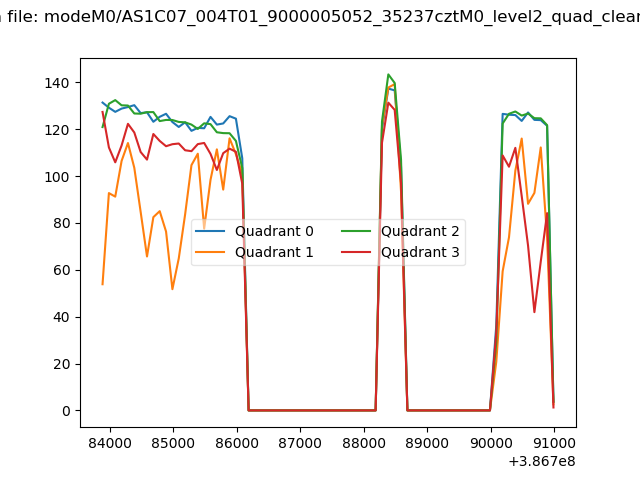 |
|
| Module-wise count rates for Quadrant A Data is divided into 100 sec bins |
 |
 |
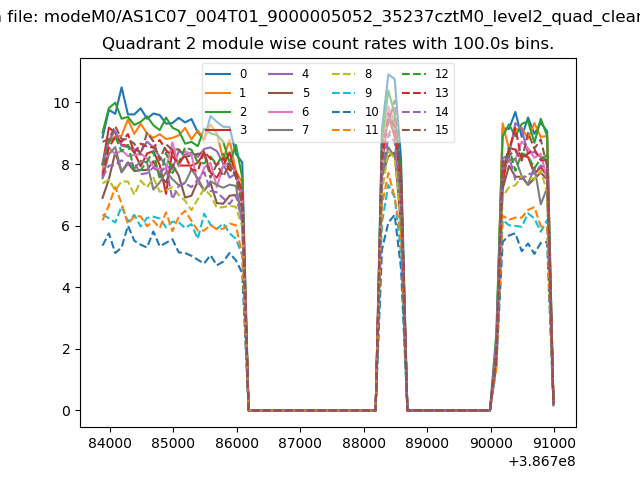
| Module-wise count rates for Quadrant B Data is divided into 100 sec bins |
 |
 |
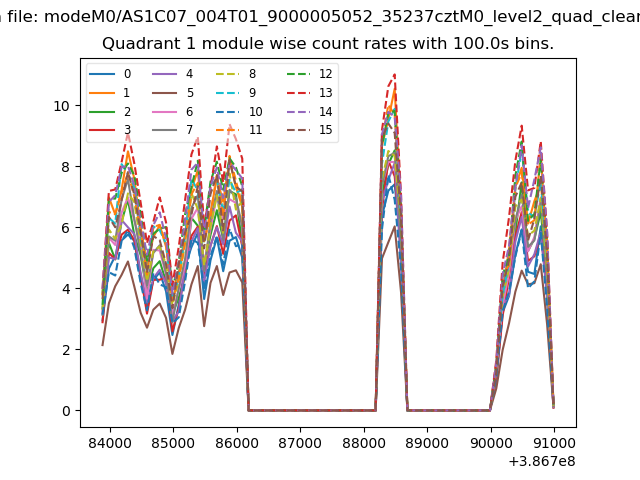
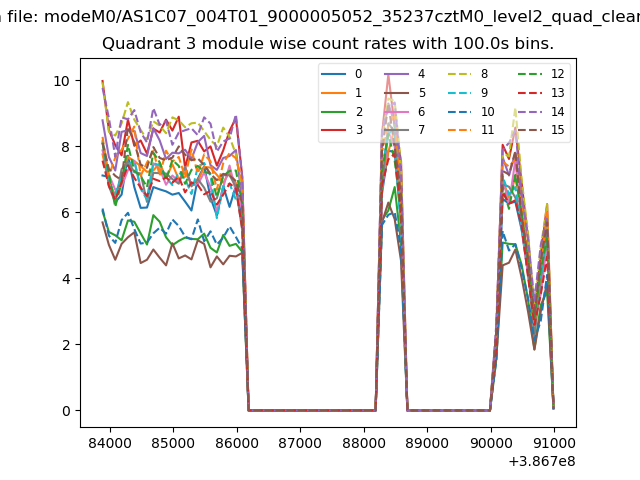
| Module-wise count rates for Quadrant C Data is divided into 100 sec bins |
 |
 |
| Module-wise count rates for Quadrant D Data is divided into 100 sec bins |
 |
 |
| Parameter | Plot |
|---|---|
| CZT HV Monitor | 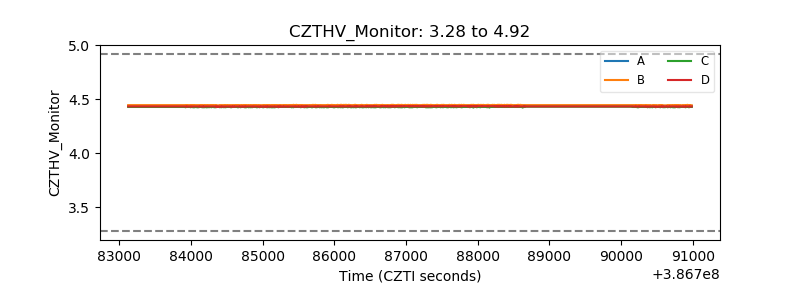 |
| D_VDD | 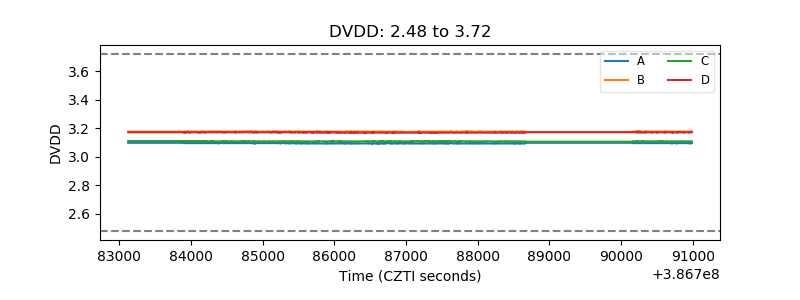 |
| Temperature 1 | 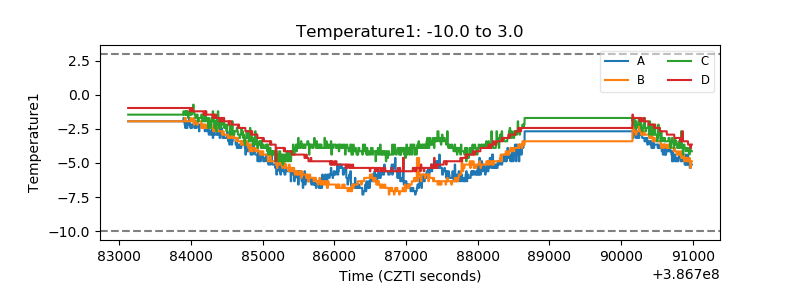 |
| Veto HV Monitor | 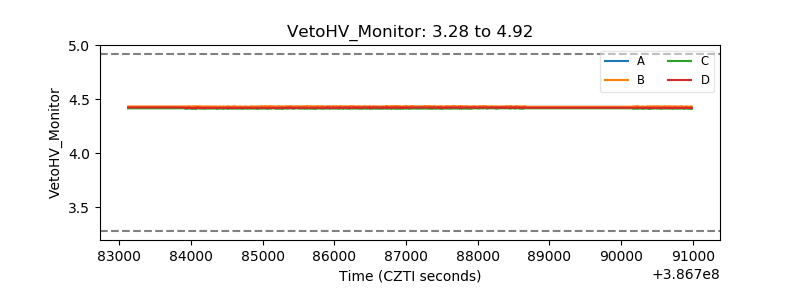 |
| Veto LLD | 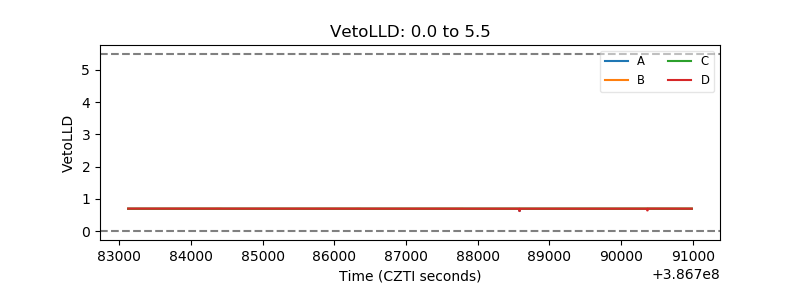 |
| Alpha Counter | 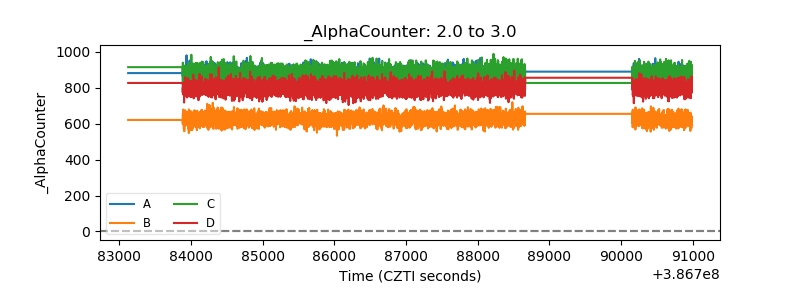 |
| _CPM_Rate | 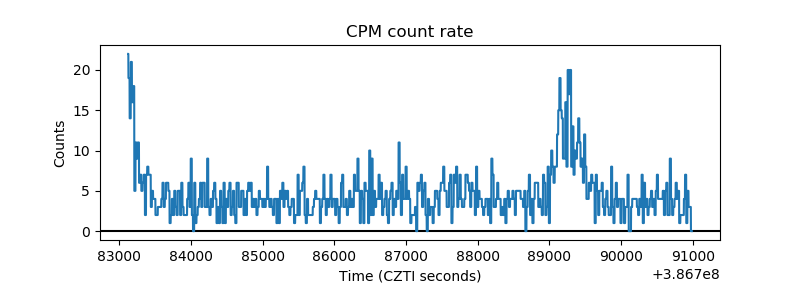 |
| CZT Counter | 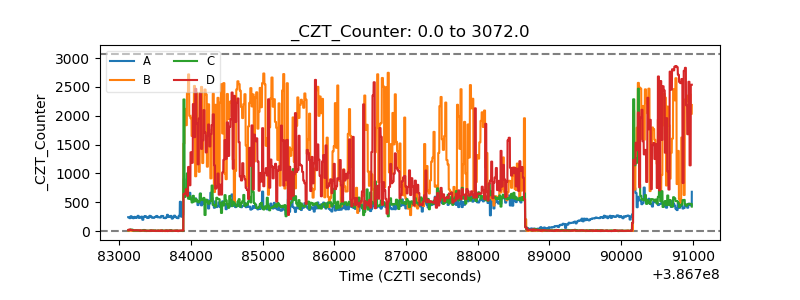 |
| +2.5 Volts monitor | 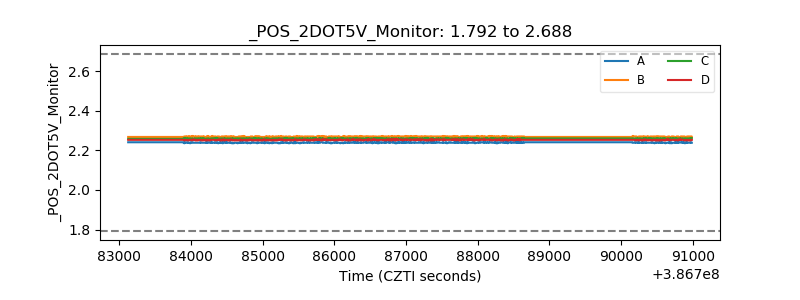 |
| +5 Volts monitor | 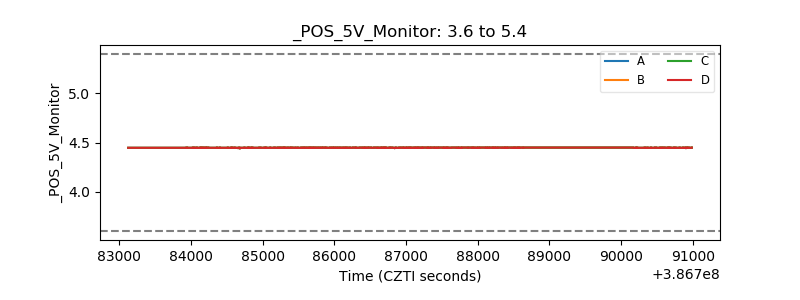 |
| _ROLL_ROT | 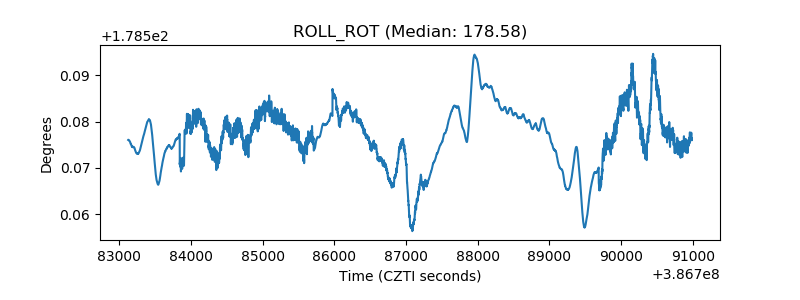 |
| _Roll_DEC | 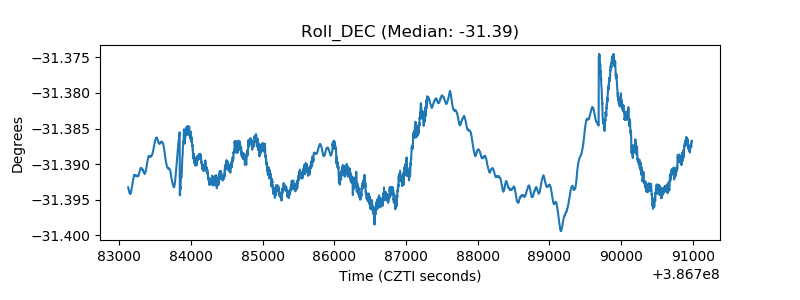 |
| _Roll_RA | 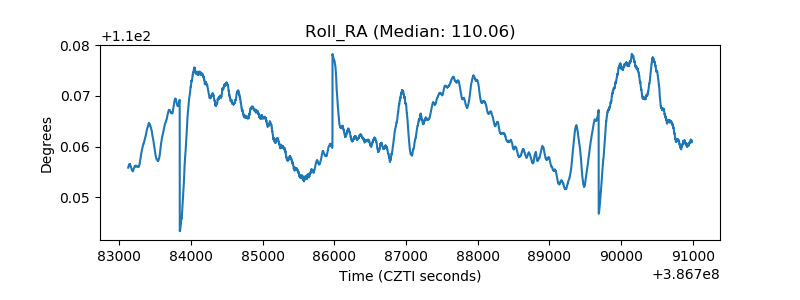 |
| Veto Counter | 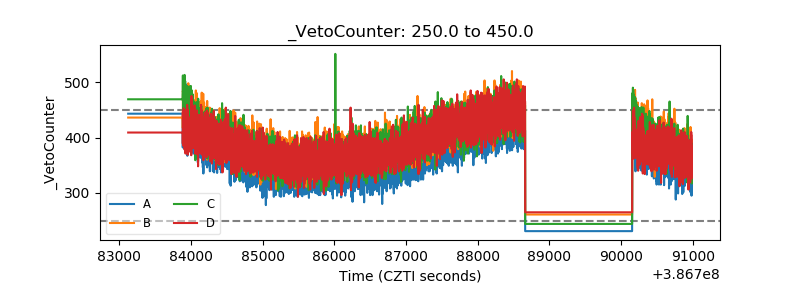 |