| Param | Original file | Final file |
|---|---|---|
| Filename | modeM0/AS1C07_004T01_9000005052_35235cztM0_level2.evt | modeM0/AS1C07_004T01_9000005052_35235cztM0_level2_quad_clean.evt |
| Size (bytes) | 740,404,800 | 79,859,520 |
| Size | 706.1 MB | 76.2 MB |
| Events in quadrant A | 2,586,708 | 577,511 |
| Events in quadrant B | 8,783,297 | 411,084 |
| Events in quadrant C | 3,767,916 | 555,007 |
| Events in quadrant D | 6,931,002 | 504,948 |
| Mode M0 | |||
|---|---|---|---|
| Quadrant | BADHDUFLAG | Total packets | Discarded packets |
| A | 0 | 10957 | 3 |
| B | 0 | 29764 | 2 |
| C | 0 | 14550 | 2 |
| D | 0 | 24308 | 2 |
| Mode SS | |||
|---|---|---|---|
| Quadrant | BADHDUFLAG | Total packets | Discarded packets |
| A | 0 | 108 | 0 |
| B | 0 | 108 | 0 |
| C | 0 | 108 | 0 |
| D | 0 | 108 | 0 |
| Mode M9 | |||
|---|---|---|---|
| Quadrant | BADHDUFLAG | Total packets | Discarded packets |
| A | 0 | 20 | 0 |
| B | 0 | 20 | 0 |
| C | 0 | 20 | 0 |
| D | 0 | 20 | 0 |
| Quadrant | Total seconds | Saturated seconds | Saturation percentage |
|---|---|---|---|
| A | 5257 | 11 | 0.209245% |
| B | 5257 | 2608 | 49.610044% |
| C | 5257 | 246 | 4.679475% |
| D | 5257 | 616 | 11.717710% |
Noise dominated data is calculated using 1-second bins in cleaned event files. If a bin has >2000 counts, and if more than 50% of those come from <1% of pixels, then it is considered to be noise-dominated and hence unusable.
| Quadrant | # 1 sec bins | Bins with >0 counts | Bins with >2000 counts | High rate bins dominated by noise | Noise dominated (total time) | Noise dominated (detector-on time) | Marked lightcurve |
|---|---|---|---|---|---|---|---|
| A | 7320 | 5258 | 4 | 4 | 0.05% | 0.08% | 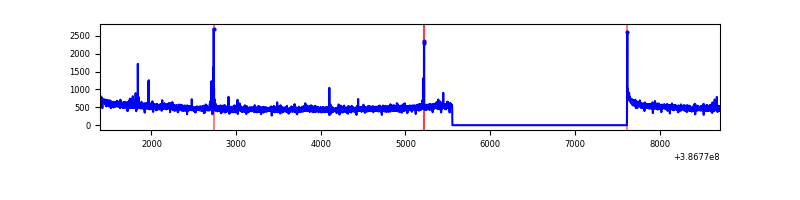 |
| B | 7320 | 5258 | 1986 | 1986 | 27.13% | 37.77% | 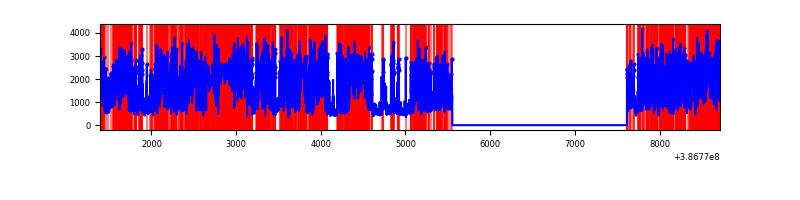 |
| C | 7320 | 5258 | 215 | 215 | 2.94% | 4.09% | 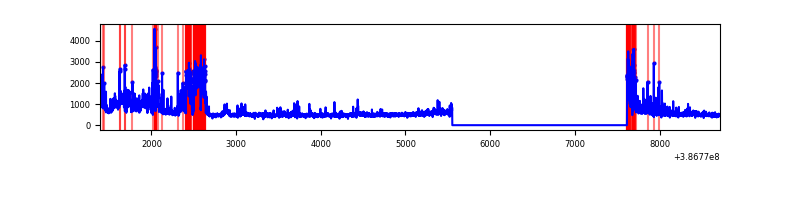 |
| D | 7320 | 5258 | 851 | 851 | 11.63% | 16.18% | 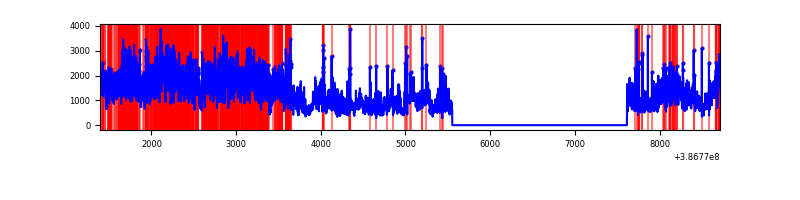 |
Top three noisy pixels from each quadrant. If the there are fewer than three noisy pixels in the level2.evt file, extra rows are filled as -1
| Pixel properties | Quadrant properties | ||||||
|---|---|---|---|---|---|---|---|
| Quadrant | DetID | PixID | Counts | Sigma | Mean | Median | Sigma |
| A | 10 | 83 | 87863 | 688.03 | 634 | 624 | 126.8 |
| A | 9 | 143 | 21077 | 161.31 | 634 | 624 | 126.8 |
| A | 13 | 6 | 14852 | 112.21 | 634 | 624 | 126.8 |
| B | 5 | 236 | 4860494 | 52084.9 | 490 | 480 | 93.3 |
| B | 5 | 172 | 1907657 | 20439.27 | 490 | 480 | 93.3 |
| B | 5 | 200 | 28784 | 303.33 | 490 | 480 | 93.3 |
| C | 10 | 49 | 808389 | 5914.22 | 594 | 599 | 136.6 |
| C | 0 | 10 | 412814 | 3018.02 | 594 | 599 | 136.6 |
| C | 15 | 214 | 219692 | 1604.08 | 594 | 599 | 136.6 |
| D | 8 | 195 | 3526206 | 24260.88 | 590 | 574 | 145.3 |
| D | 13 | 249 | 251748 | 1728.4 | 590 | 574 | 145.3 |
| D | 7 | 80 | 217542 | 1493.02 | 590 | 574 | 145.3 |
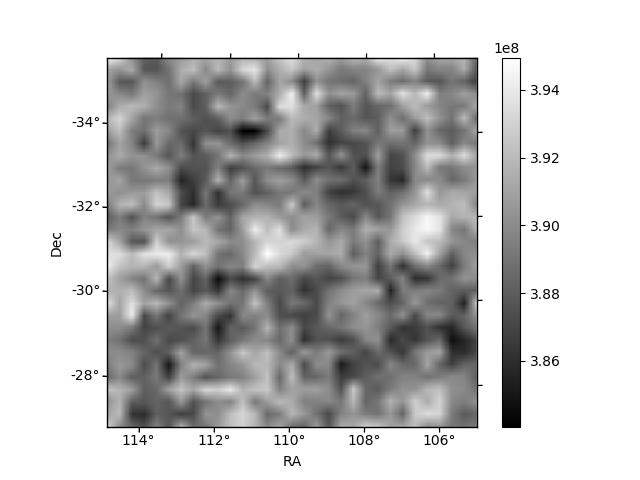
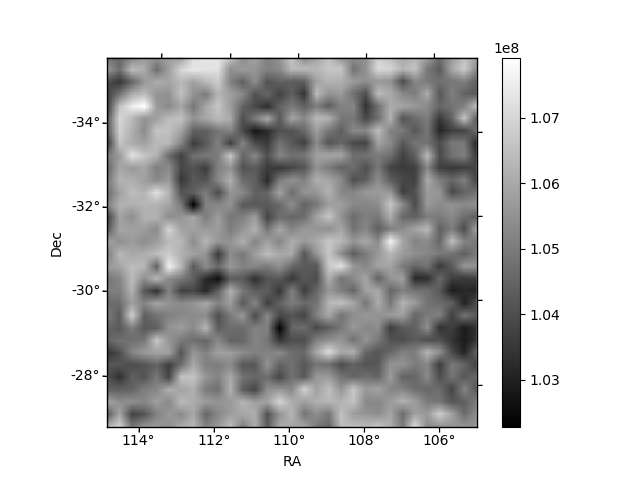
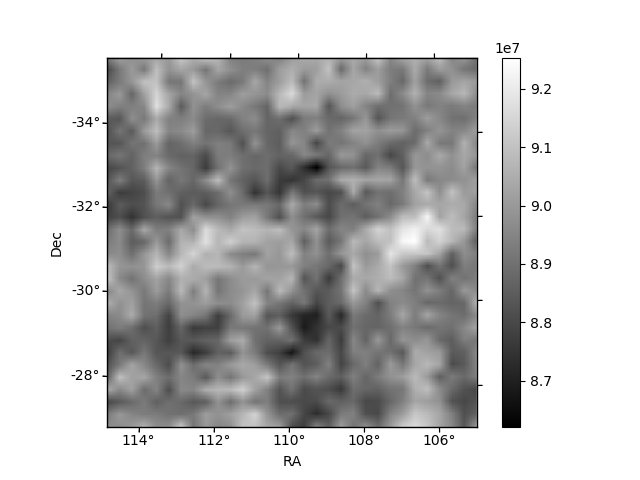
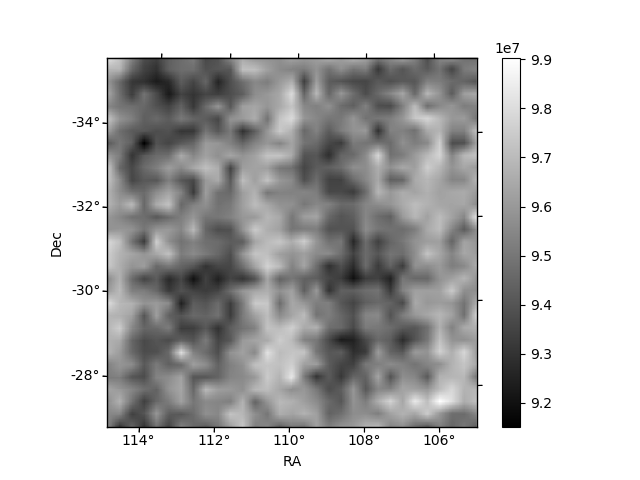
Histogram calculated using DETX and DETY for each event in the final _common_clean file
| Quadrant A | 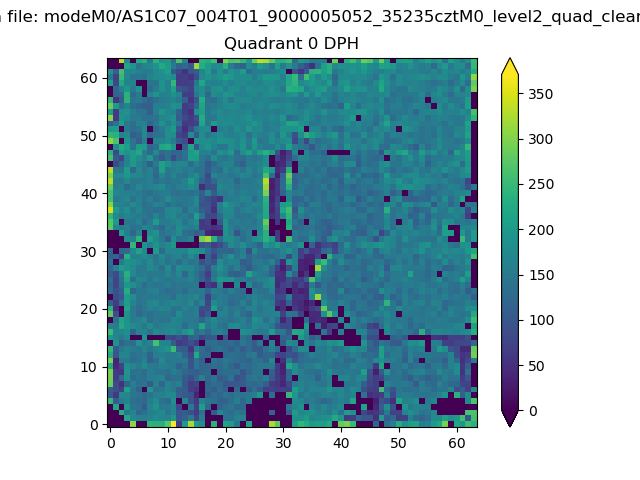 |
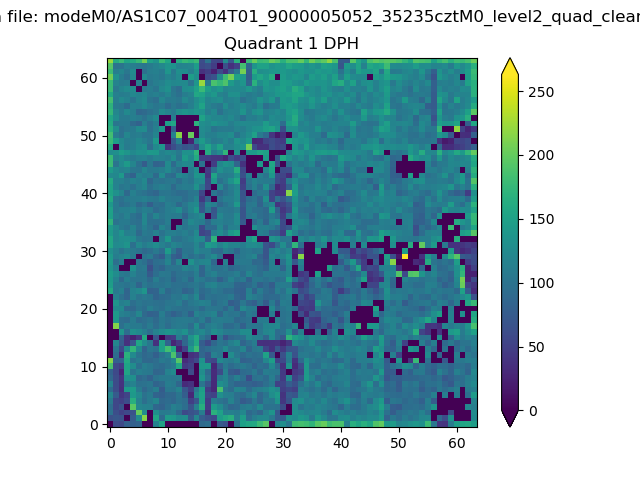 |
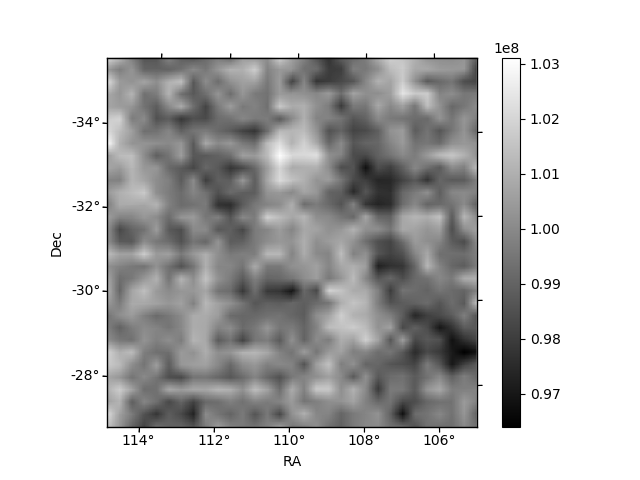
Quadrant B |
|---|---|---|---|
| Quadrant D | 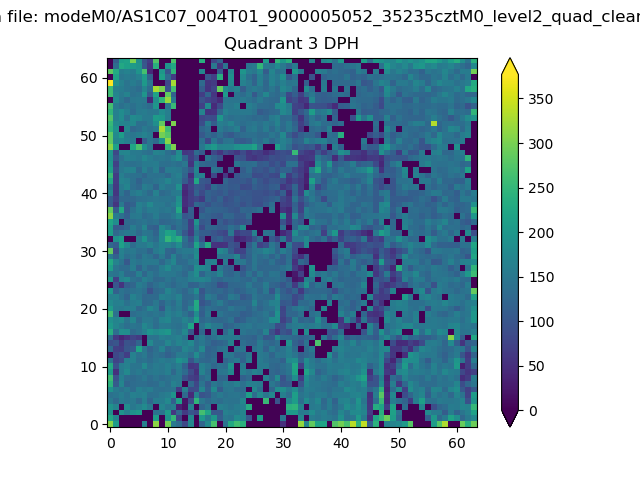 |
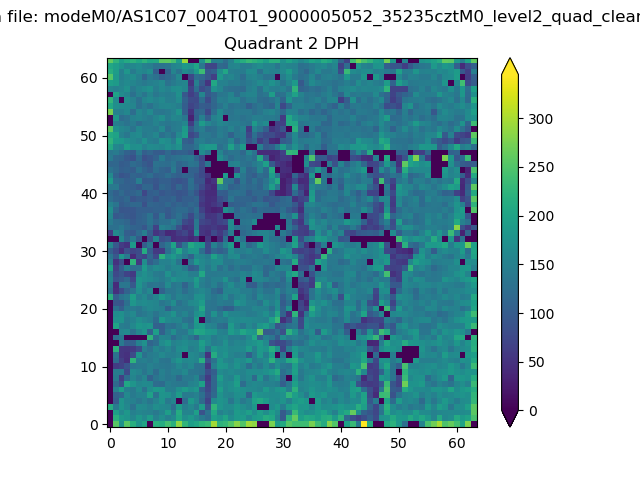 |
Quadrant C |
| Plot type | Count rate plots | Images |
|---|---|---|
| Comparison with Poisson distribution Blue bars denote a histogram of data divided into 1 sec bins. Red curve is a Poisson curve with rate = median count rate of data. |
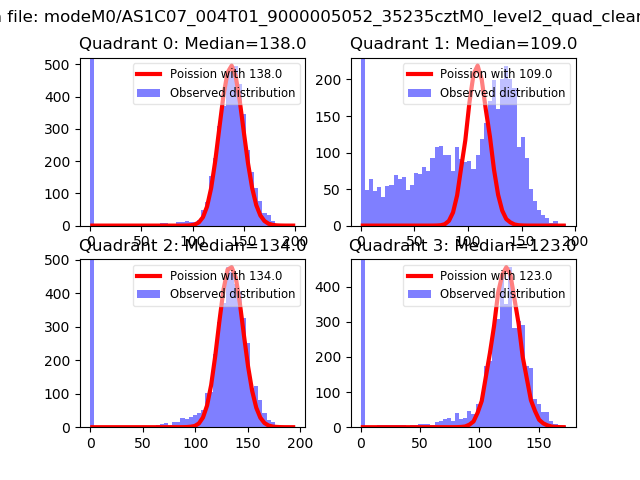 |
 |
| Quadrant-wise count rates Data is divided into 100 sec bins |
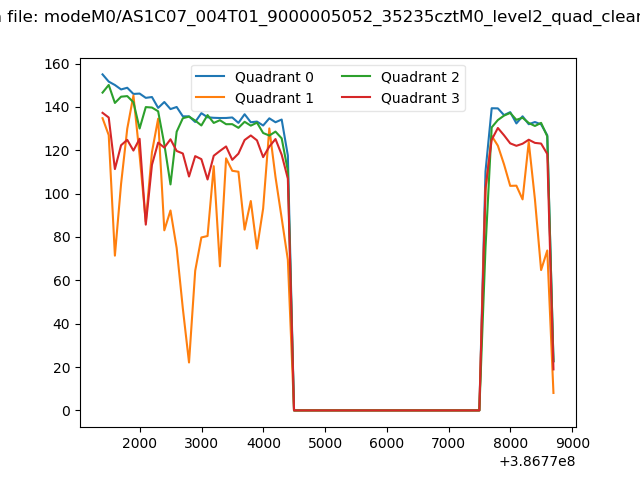 |
|
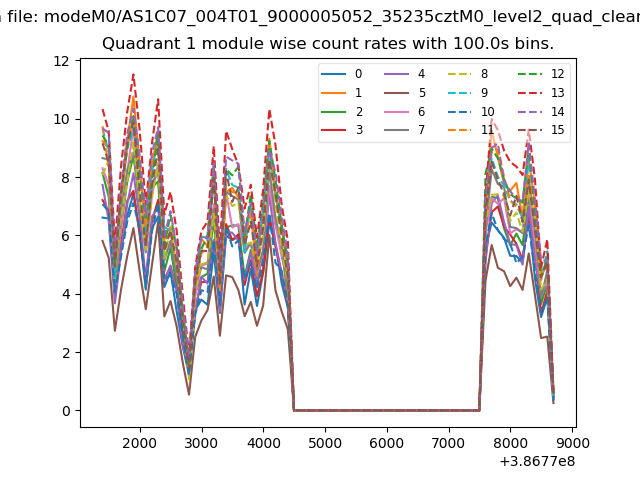
| Module-wise count rates for Quadrant A Data is divided into 100 sec bins |
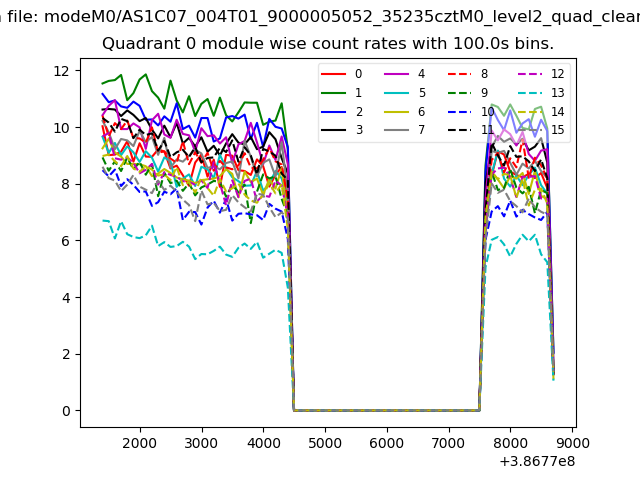 |
 |
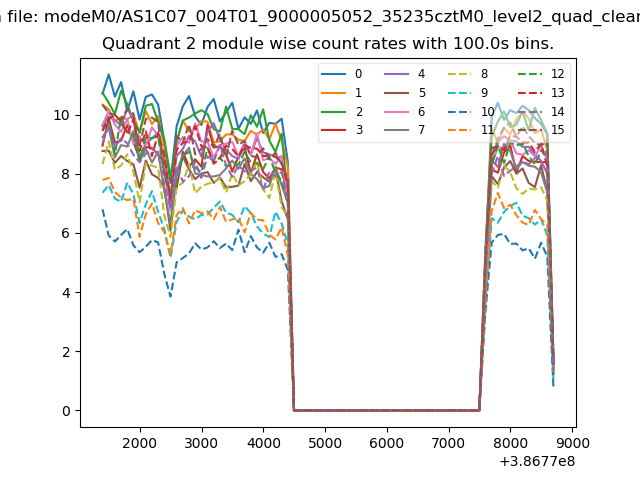
| Module-wise count rates for Quadrant B Data is divided into 100 sec bins |
 |
 |
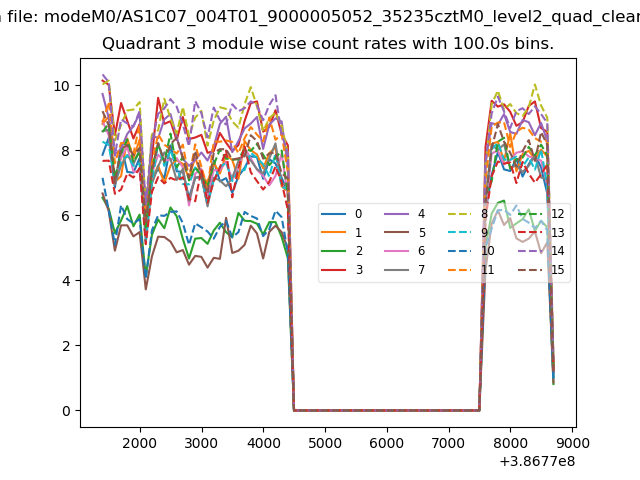
| Module-wise count rates for Quadrant C Data is divided into 100 sec bins |
 |
 |
| Module-wise count rates for Quadrant D Data is divided into 100 sec bins |
 |
 |
| Parameter | Plot |
|---|---|
| CZT HV Monitor | 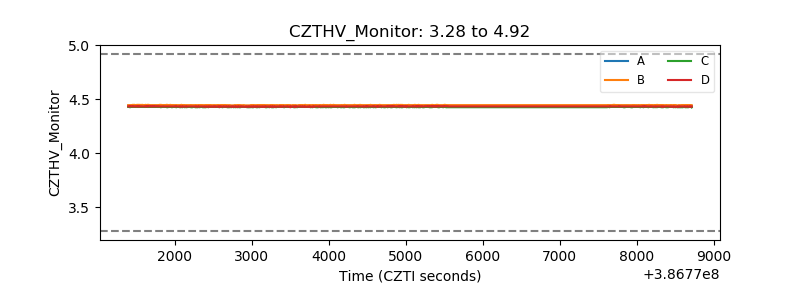 |
| D_VDD | 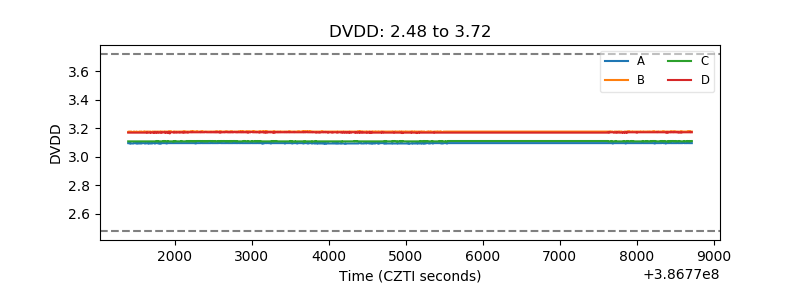 |
| Temperature 1 | 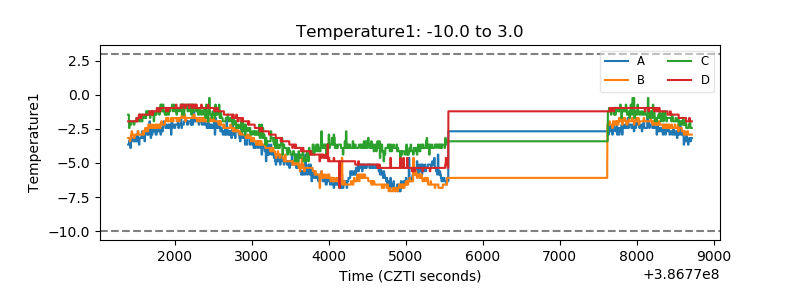 |
| Veto HV Monitor | 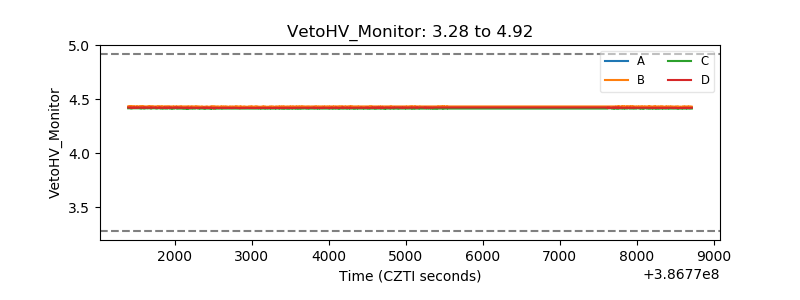 |
| Veto LLD | 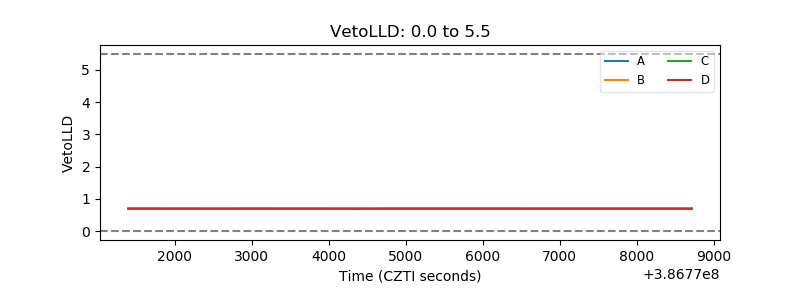 |
| Alpha Counter | 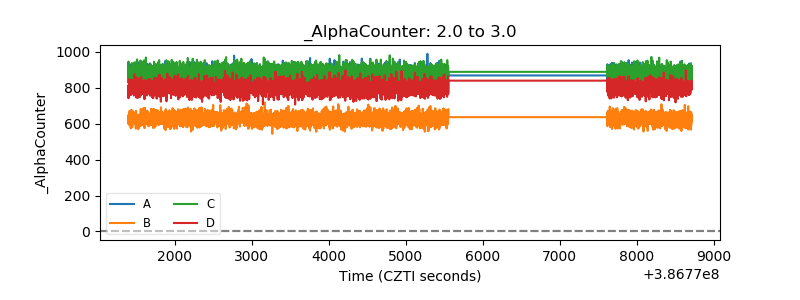 |
| _CPM_Rate | 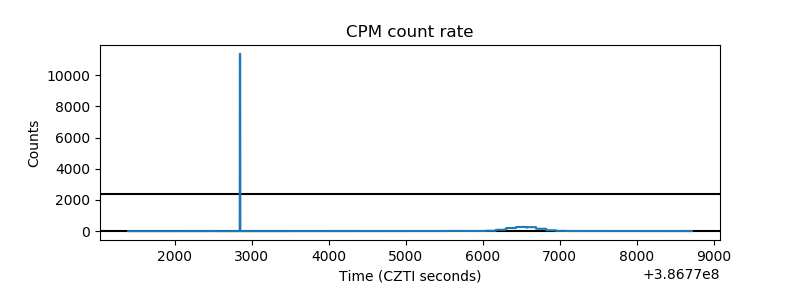 |
| CZT Counter | 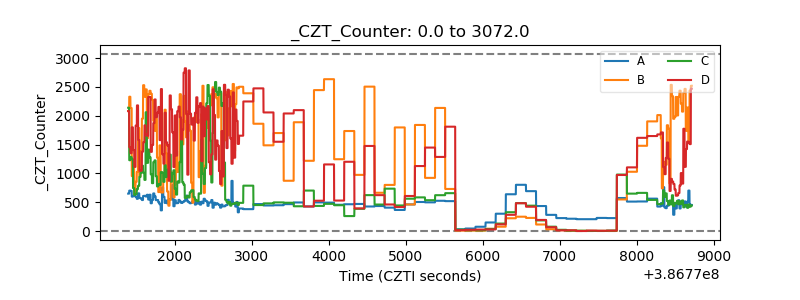 |
| +2.5 Volts monitor | 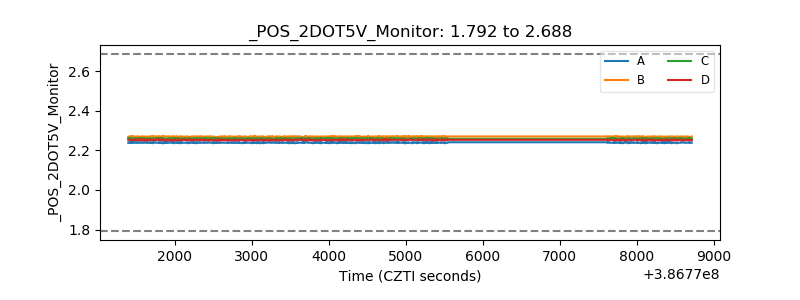 |
| +5 Volts monitor | 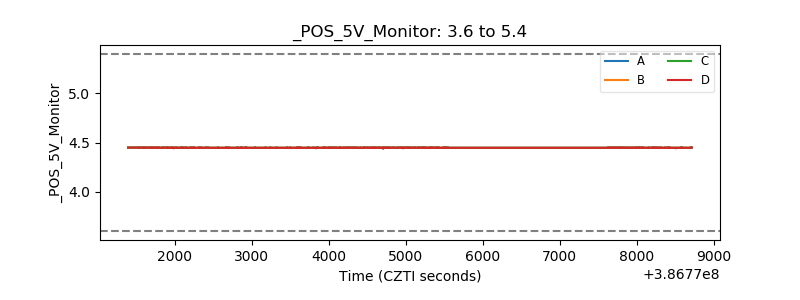 |
| _ROLL_ROT | 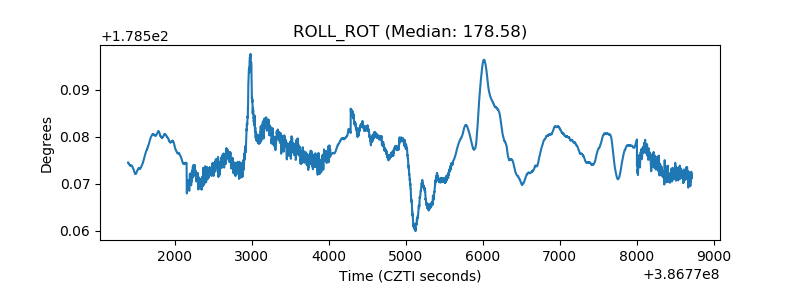 |
| _Roll_DEC | 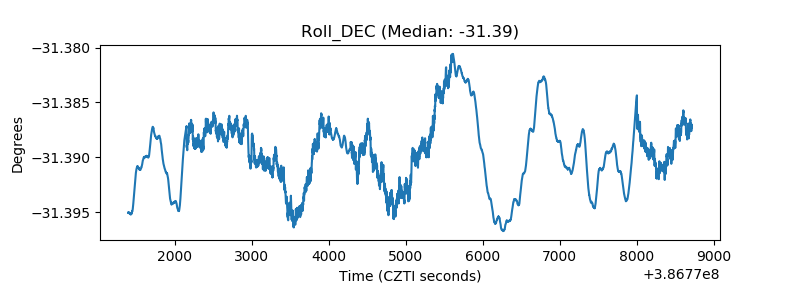 |
| _Roll_RA | 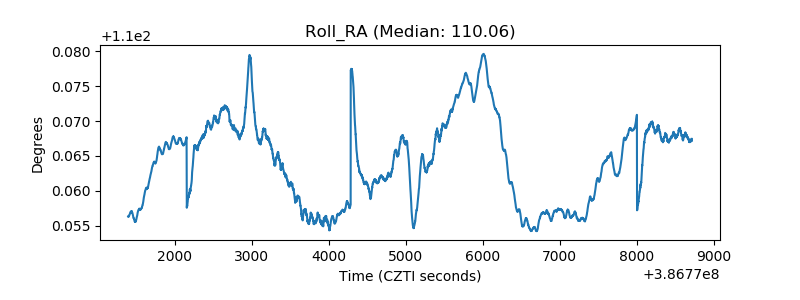 |
| Veto Counter | 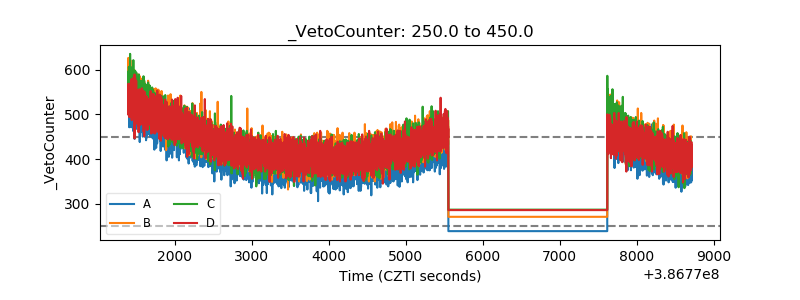 |