| Param | Original file | Final file |
|---|---|---|
| Filename | modeM0/AS1C07_004T01_9000005052_35228cztM0_level2.evt | modeM0/AS1C07_004T01_9000005052_35228cztM0_level2_quad_clean.evt |
| Size (bytes) | 851,993,280 | 51,428,160 |
| Size | 812.5 MB | 49.0 MB |
| Events in quadrant A | 2,712,010 | 332,054 |
| Events in quadrant B | 8,161,806 | 267,253 |
| Events in quadrant C | 3,351,295 | 337,781 |
| Events in quadrant D | 11,198,952 | 224,892 |
| Mode M0 | |||
|---|---|---|---|
| Quadrant | BADHDUFLAG | Total packets | Discarded packets |
| A | 0 | 11576 | 3 |
| B | 0 | 28127 | 2 |
| C | 0 | 13201 | 2 |
| D | 0 | 37140 | 2 |
| Mode SS | |||
|---|---|---|---|
| Quadrant | BADHDUFLAG | Total packets | Discarded packets |
| A | 0 | 114 | 0 |
| B | 0 | 114 | 0 |
| C | 0 | 114 | 0 |
| D | 0 | 114 | 0 |
| Mode M9 | |||
|---|---|---|---|
| Quadrant | BADHDUFLAG | Total packets | Discarded packets |
| A | 0 | 21 | 0 |
| B | 0 | 21 | 0 |
| C | 0 | 21 | 0 |
| D | 0 | 22 | 0 |
| Quadrant | Total seconds | Saturated seconds | Saturation percentage |
|---|---|---|---|
| A | 5626 | 8 | 0.142197% |
| B | 5626 | 2118 | 37.646641% |
| C | 5626 | 125 | 2.221827% |
| D | 5626 | 2932 | 52.115180% |
Noise dominated data is calculated using 1-second bins in cleaned event files. If a bin has >2000 counts, and if more than 50% of those come from <1% of pixels, then it is considered to be noise-dominated and hence unusable.
| Quadrant | # 1 sec bins | Bins with >0 counts | Bins with >2000 counts | High rate bins dominated by noise | Noise dominated (total time) | Noise dominated (detector-on time) | Marked lightcurve |
|---|---|---|---|---|---|---|---|
| A | 7268 | 5627 | 0 | 0 | 0.00% | 0.00% | 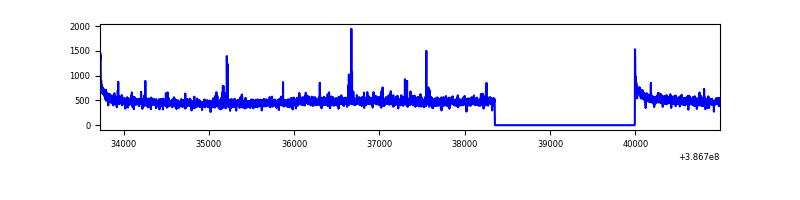 |
| B | 7268 | 5626 | 1419 | 1419 | 19.52% | 25.22% | 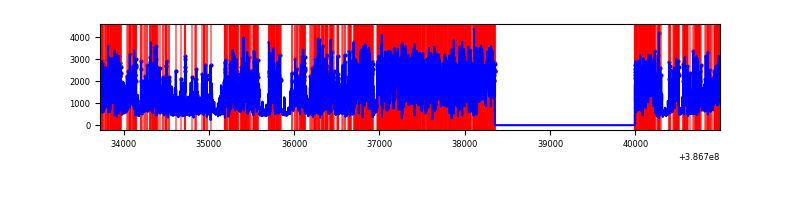 |
| C | 7268 | 5627 | 98 | 98 | 1.35% | 1.74% | 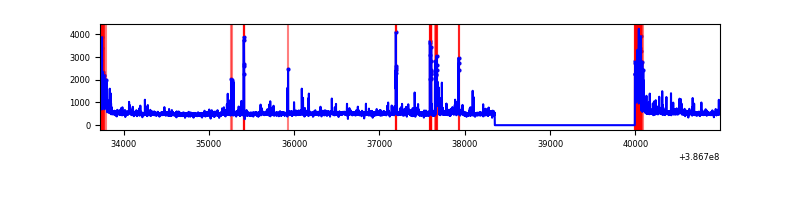 |
| D | 7268 | 5626 | 2779 | 2779 | 38.24% | 49.40% | 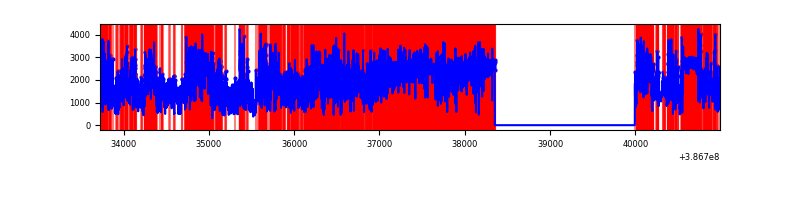 |
Top three noisy pixels from each quadrant. If the there are fewer than three noisy pixels in the level2.evt file, extra rows are filled as -1
| Pixel properties | Quadrant properties | ||||||
|---|---|---|---|---|---|---|---|
| Quadrant | DetID | PixID | Counts | Sigma | Mean | Median | Sigma |
| A | 10 | 83 | 102141 | 757.84 | 658 | 645 | 133.9 |
| A | 13 | 6 | 19108 | 137.86 | 658 | 645 | 133.9 |
| A | 9 | 143 | 10767 | 75.58 | 658 | 645 | 133.9 |
| B | 5 | 236 | 5316100 | 48667.58 | 569 | 552 | 109.2 |
| B | 5 | 172 | 546211 | 4995.89 | 569 | 552 | 109.2 |
| B | 5 | 200 | 26648 | 238.93 | 569 | 552 | 109.2 |
| C | 0 | 10 | 327786 | 2230.8 | 636 | 639 | 146.6 |
| C | 15 | 214 | 236750 | 1610.03 | 636 | 639 | 146.6 |
| C | 1 | 23 | 178133 | 1210.32 | 636 | 639 | 146.6 |
| D | 8 | 195 | 4887007 | 39505.01 | 507 | 494 | 123.7 |
| D | 7 | 80 | 1719694 | 13898.87 | 507 | 494 | 123.7 |
| D | 8 | 230 | 1253086 | 10126.58 | 507 | 494 | 123.7 |
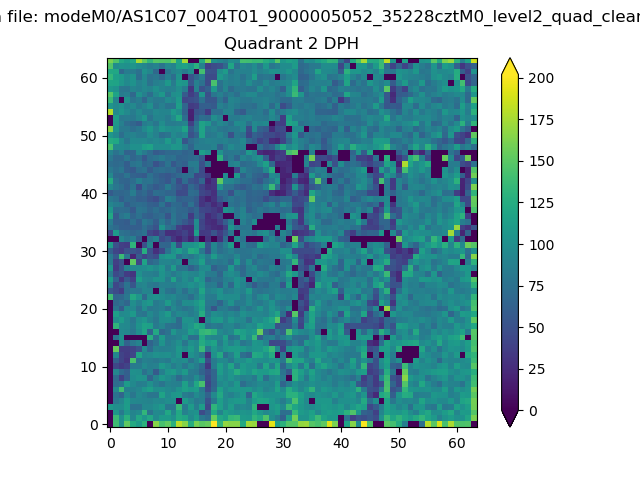
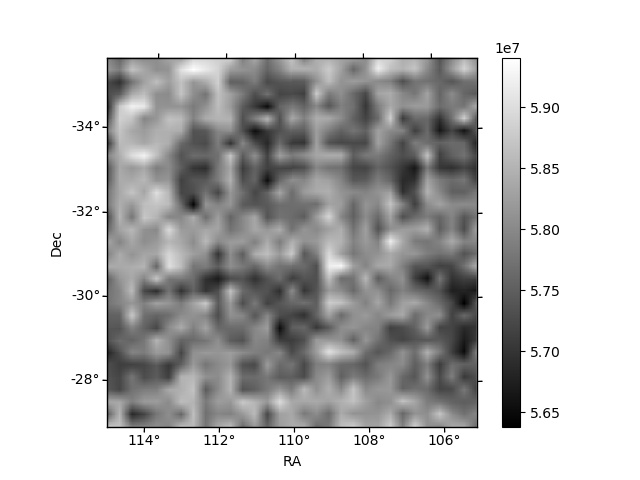
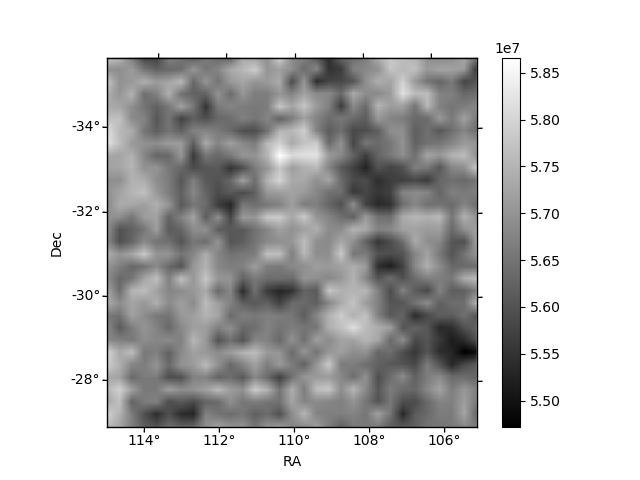
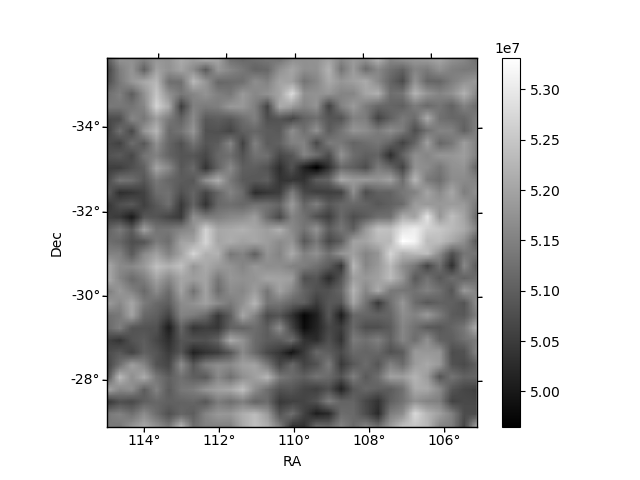
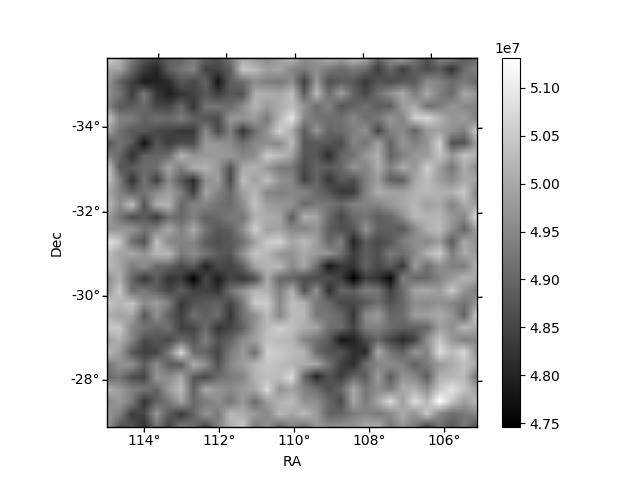
Histogram calculated using DETX and DETY for each event in the final _common_clean file
| Quadrant A | 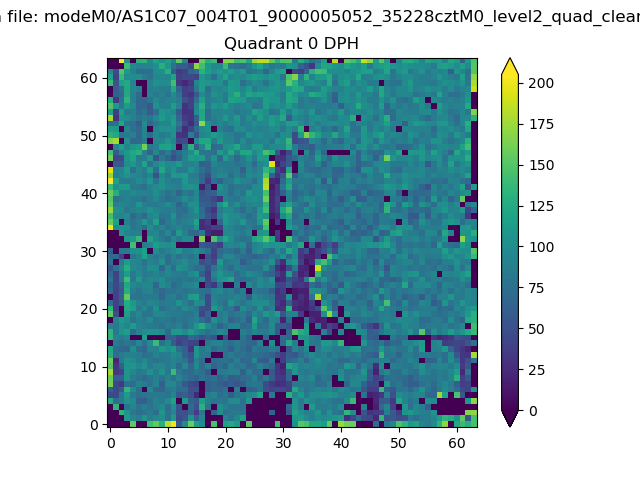 |
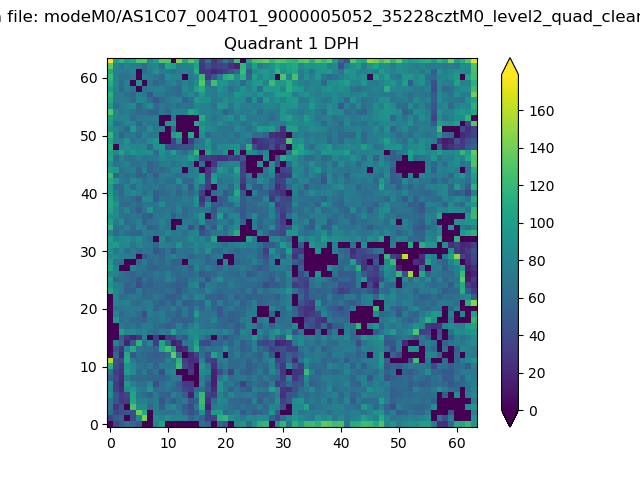 |
Quadrant B |
|---|---|---|---|
| Quadrant D | 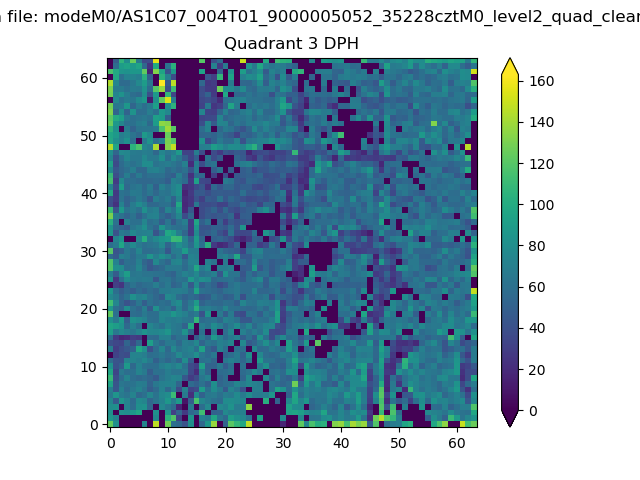 |
 |
Quadrant C |
| Plot type | Count rate plots | Images |
|---|---|---|
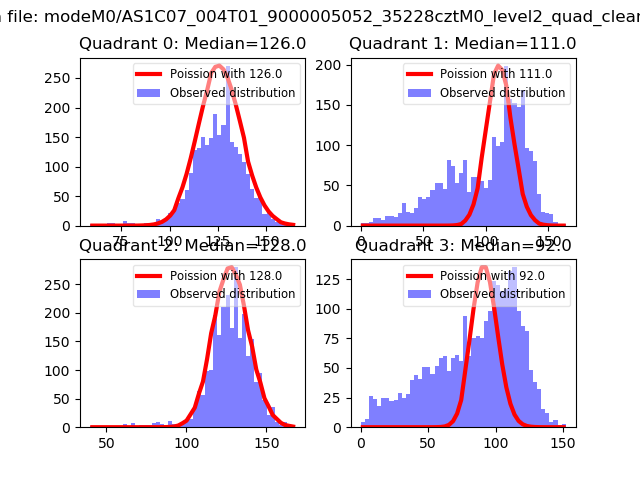
| Comparison with Poisson distribution Blue bars denote a histogram of data divided into 1 sec bins. Red curve is a Poisson curve with rate = median count rate of data. |
 |
 |
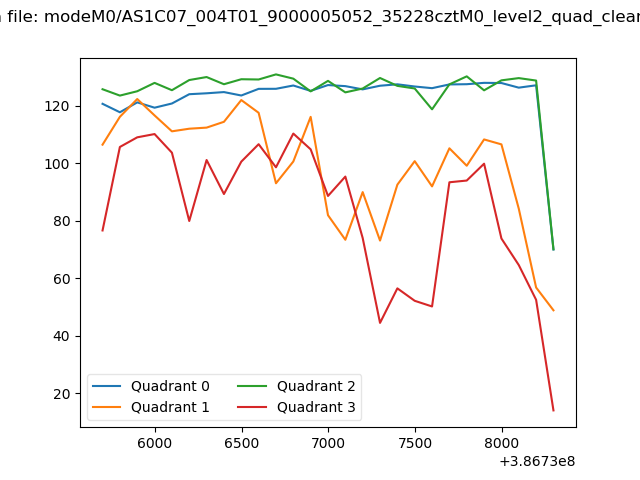
| Quadrant-wise count rates Data is divided into 100 sec bins |
 |
|
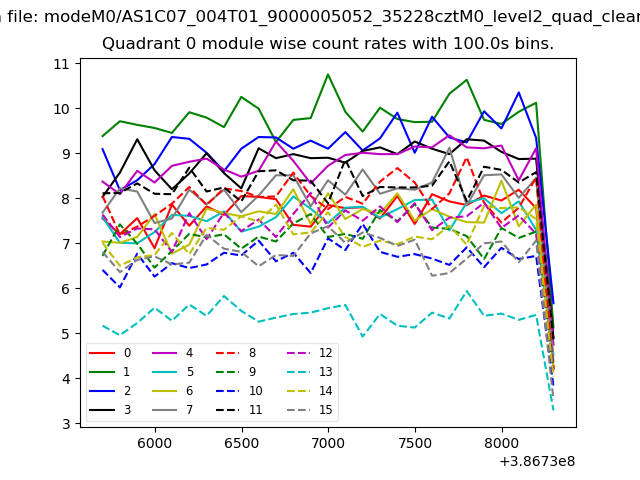
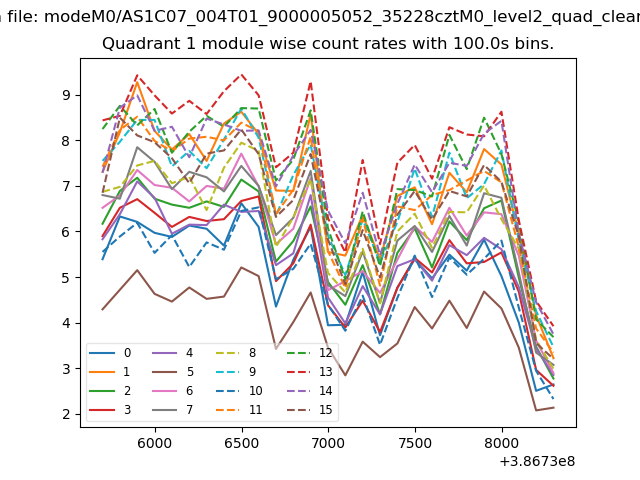
| Module-wise count rates for Quadrant A Data is divided into 100 sec bins |
 |
 |
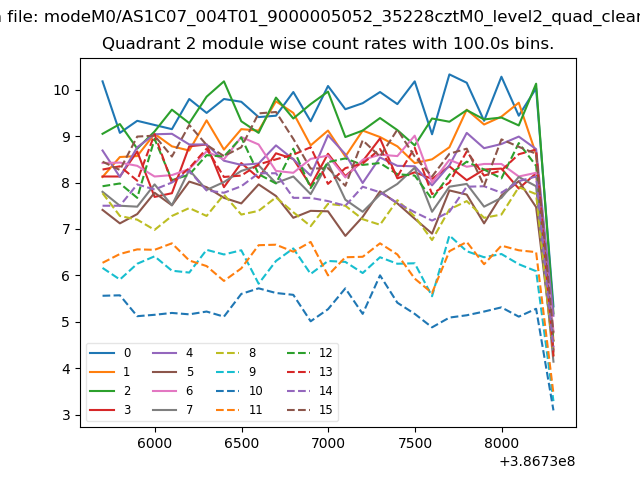
| Module-wise count rates for Quadrant B Data is divided into 100 sec bins |
 |
 |
| Module-wise count rates for Quadrant C Data is divided into 100 sec bins |
 |
 |
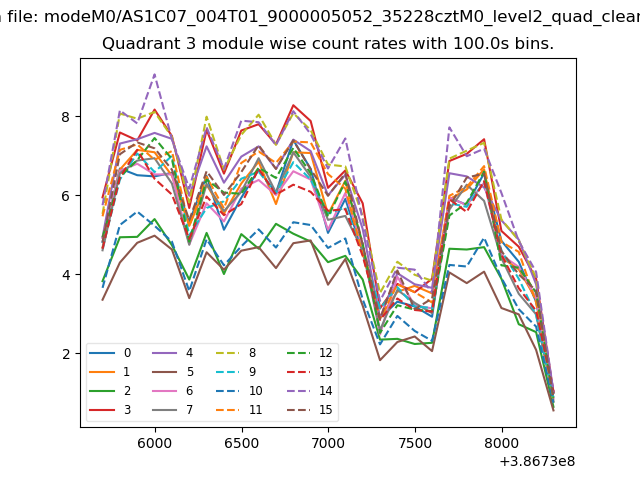
| Module-wise count rates for Quadrant D Data is divided into 100 sec bins |
 |
 |
| Parameter | Plot |
|---|---|
| CZT HV Monitor | 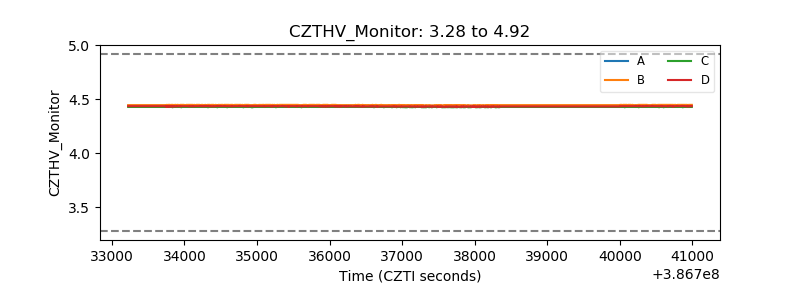 |
| D_VDD | 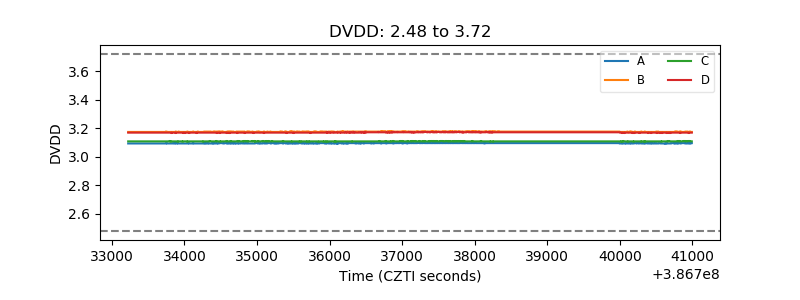 |
| Temperature 1 | 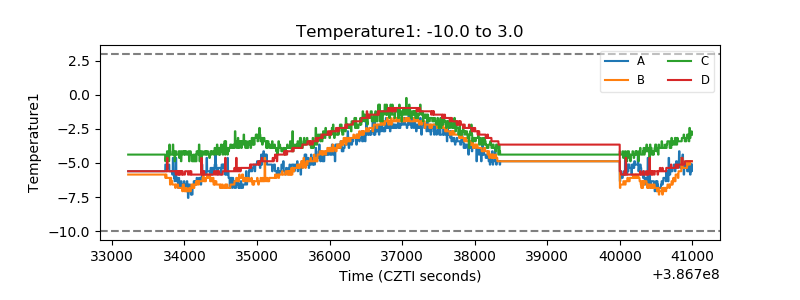 |
| Veto HV Monitor | 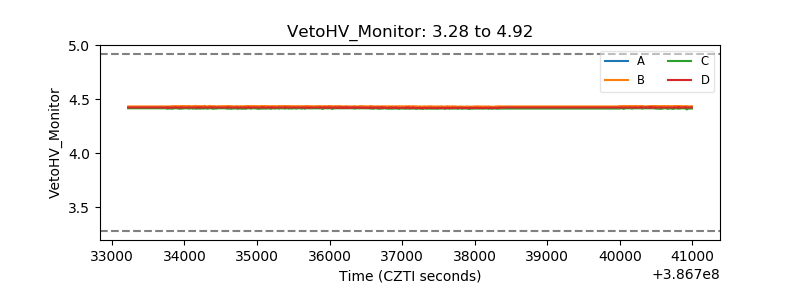 |
| Veto LLD | 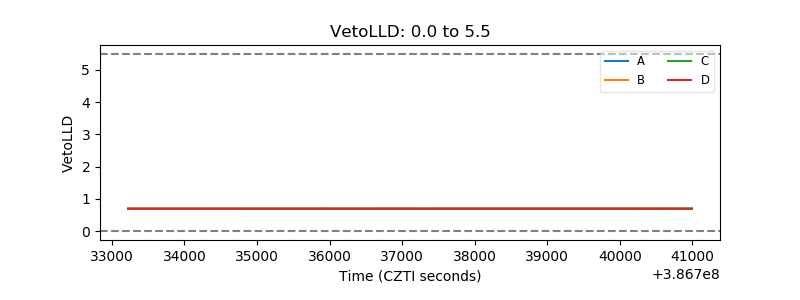 |
| Alpha Counter | 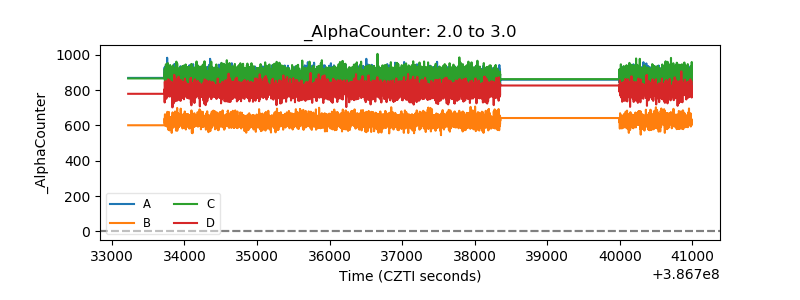 |
| _CPM_Rate | 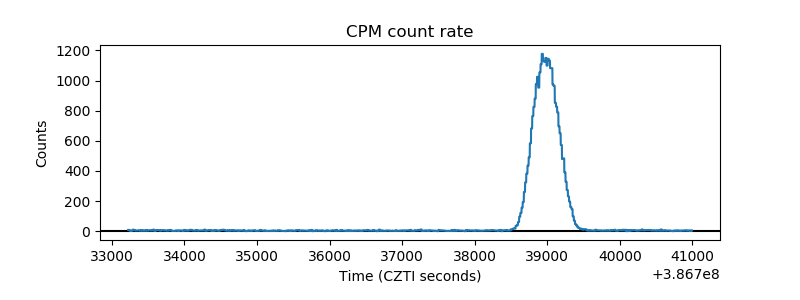 |
| CZT Counter | 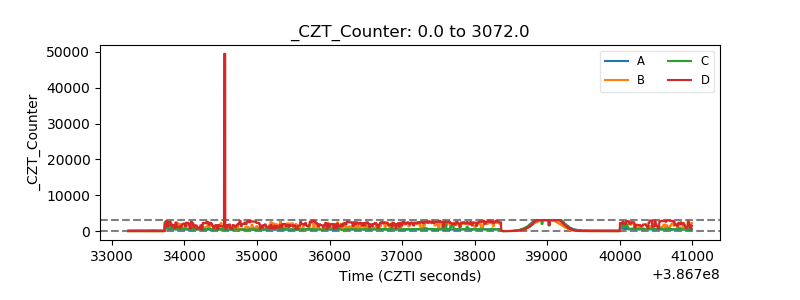 |
| +2.5 Volts monitor | 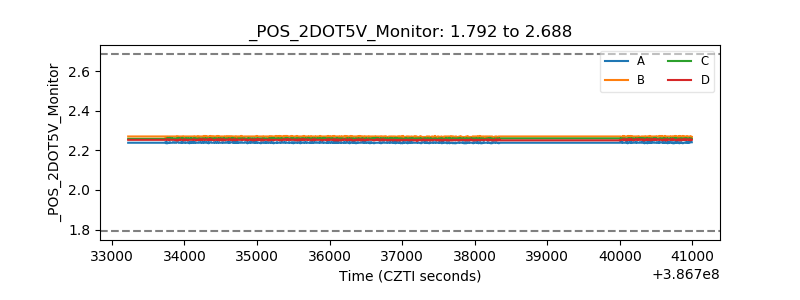 |
| +5 Volts monitor | 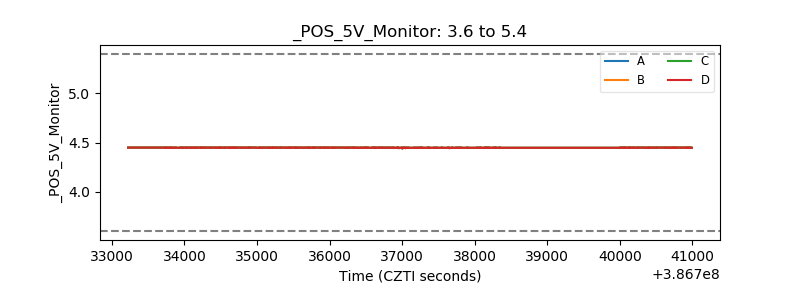 |
| _ROLL_ROT | 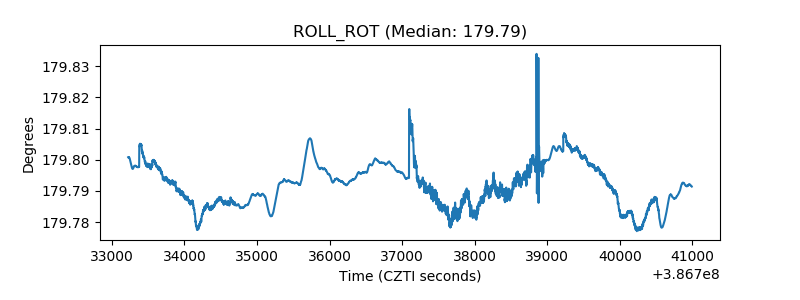 |
| _Roll_DEC | 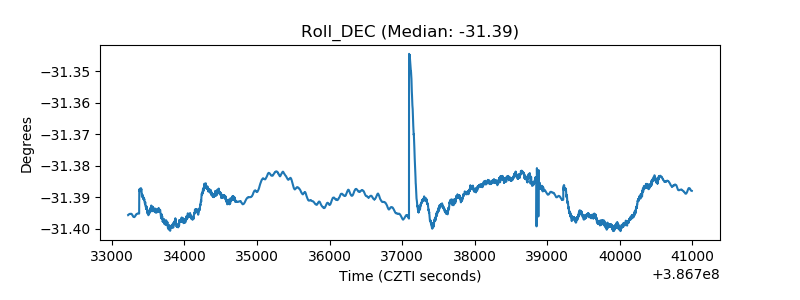 |
| _Roll_RA | 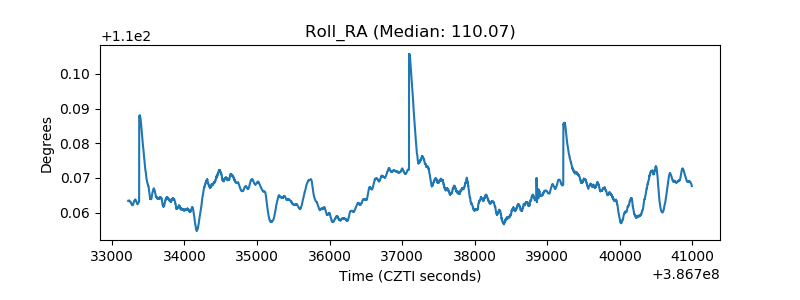 |
| Veto Counter | 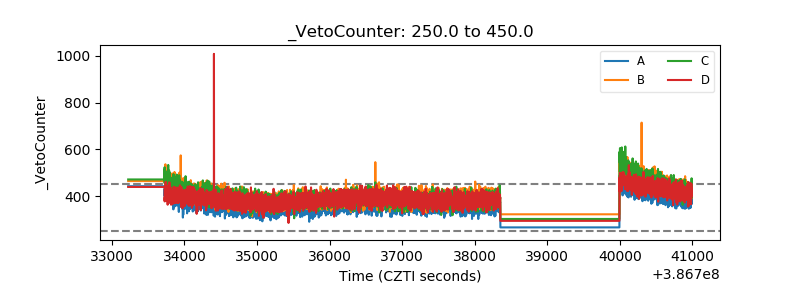 |