| Param | Original file | Final file |
|---|---|---|
| Filename | modeM0/AS1C07_004T01_9000005052_35227cztM0_level2.evt | modeM0/AS1C07_004T01_9000005052_35227cztM0_level2_quad_clean.evt |
| Size (bytes) | 1,439,907,840 | 106,848,000 |
| Size | 1.3 GB | 101.9 MB |
| Events in quadrant A | 5,042,430 | 680,484 |
| Events in quadrant B | 14,462,339 | 572,029 |
| Events in quadrant C | 5,562,476 | 685,128 |
| Events in quadrant D | 17,827,907 | 560,197 |
| Mode M0 | |||
|---|---|---|---|
| Quadrant | BADHDUFLAG | Total packets | Discarded packets |
| A | 0 | 21802 | 4 |
| B | 0 | 50341 | 3 |
| C | 0 | 22723 | 3 |
| D | 0 | 60398 | 3 |
| Mode SS | |||
|---|---|---|---|
| Quadrant | BADHDUFLAG | Total packets | Discarded packets |
| A | 0 | 216 | 0 |
| B | 0 | 216 | 0 |
| C | 0 | 216 | 0 |
| D | 0 | 216 | 0 |
| Mode M9 | |||
|---|---|---|---|
| Quadrant | BADHDUFLAG | Total packets | Discarded packets |
| A | 0 | 39 | 0 |
| B | 0 | 39 | 0 |
| C | 0 | 39 | 0 |
| D | 0 | 40 | 0 |
| Quadrant | Total seconds | Saturated seconds | Saturation percentage |
|---|---|---|---|
| A | 10629 | 23 | 0.216389% |
| B | 10629 | 3451 | 32.467777% |
| C | 10629 | 73 | 0.686800% |
| D | 10629 | 2883 | 27.123906% |
Noise dominated data is calculated using 1-second bins in cleaned event files. If a bin has >2000 counts, and if more than 50% of those come from <1% of pixels, then it is considered to be noise-dominated and hence unusable.
| Quadrant | # 1 sec bins | Bins with >0 counts | Bins with >2000 counts | High rate bins dominated by noise | Noise dominated (total time) | Noise dominated (detector-on time) | Marked lightcurve |
|---|---|---|---|---|---|---|---|
| A | 13553 | 10631 | 5 | 5 | 0.04% | 0.05% | 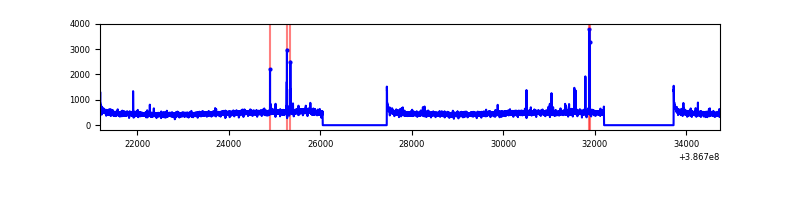 |
| B | 13553 | 10631 | 2286 | 2286 | 16.87% | 21.50% | 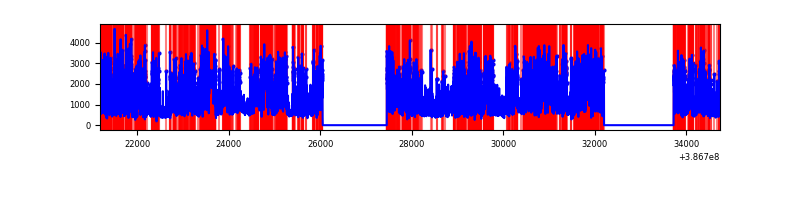 |
| C | 13553 | 10631 | 59 | 59 | 0.44% | 0.55% | 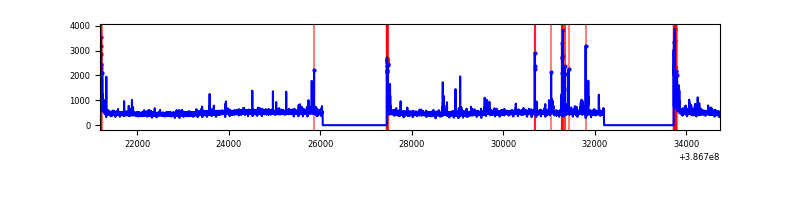 |
| D | 13553 | 10629 | 2854 | 2854 | 21.06% | 26.85% | 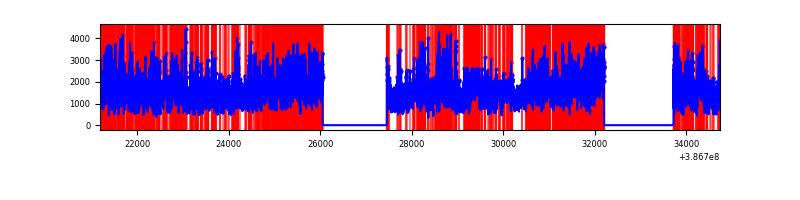 |
Top three noisy pixels from each quadrant. If the there are fewer than three noisy pixels in the level2.evt file, extra rows are filled as -1
| Pixel properties | Quadrant properties | ||||||
|---|---|---|---|---|---|---|---|
| Quadrant | DetID | PixID | Counts | Sigma | Mean | Median | Sigma |
| A | 10 | 83 | 165418 | 664.4 | 1231 | 1208 | 247.2 |
| A | 9 | 143 | 58209 | 230.63 | 1231 | 1208 | 247.2 |
| A | 13 | 6 | 28436 | 110.17 | 1231 | 1208 | 247.2 |
| B | 5 | 236 | 8839332 | 42769.93 | 1073 | 1043 | 206.6 |
| B | 5 | 172 | 1240841 | 5999.59 | 1073 | 1043 | 206.6 |
| B | 5 | 200 | 55254 | 262.34 | 1073 | 1043 | 206.6 |
| C | 15 | 214 | 442204 | 1597.4 | 1191 | 1199 | 276.1 |
| C | 0 | 10 | 251938 | 908.22 | 1191 | 1199 | 276.1 |
| C | 1 | 23 | 129686 | 465.4 | 1191 | 1199 | 276.1 |
| D | 8 | 195 | 8980986 | 33416.75 | 1107 | 1076 | 268.7 |
| D | 7 | 80 | 2258945 | 8402.16 | 1107 | 1076 | 268.7 |
| D | 2 | 250 | 975293 | 3625.33 | 1107 | 1076 | 268.7 |
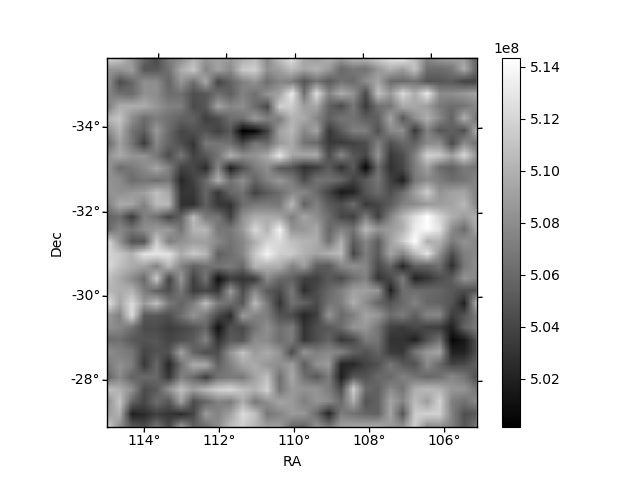
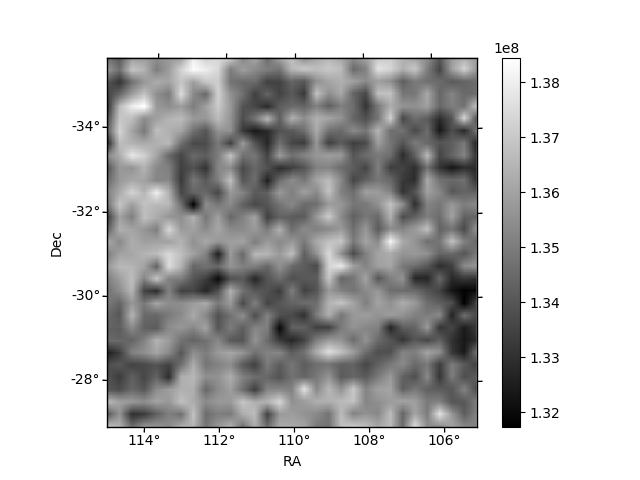
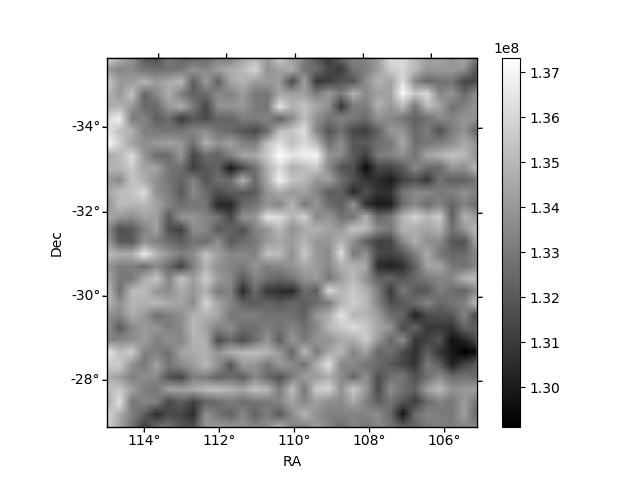
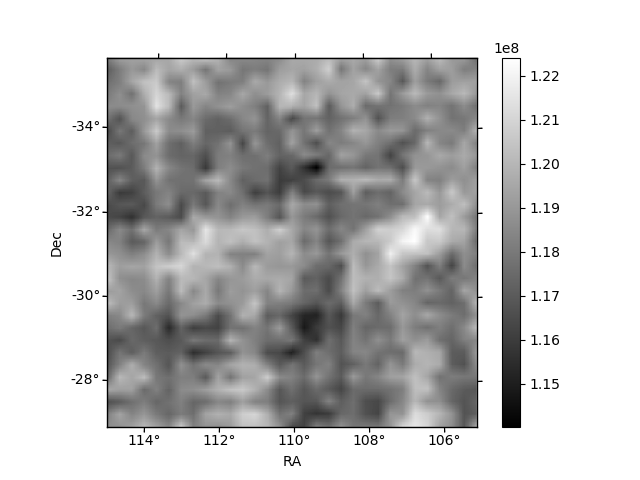
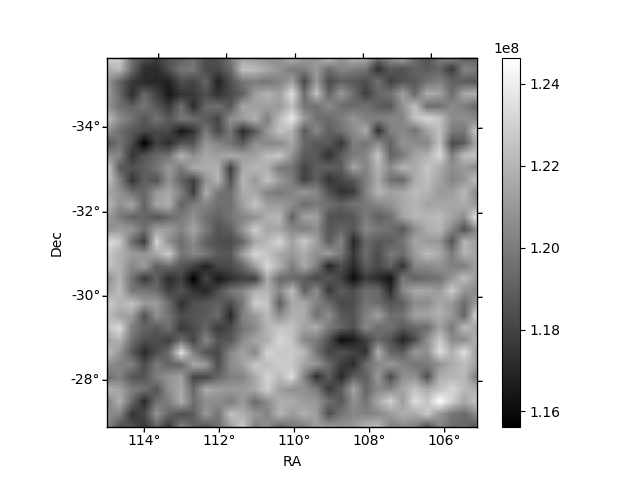
Histogram calculated using DETX and DETY for each event in the final _common_clean file
| Quadrant A | 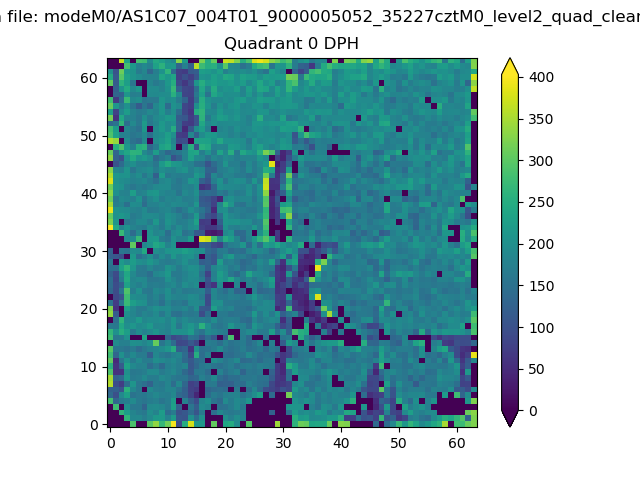 |
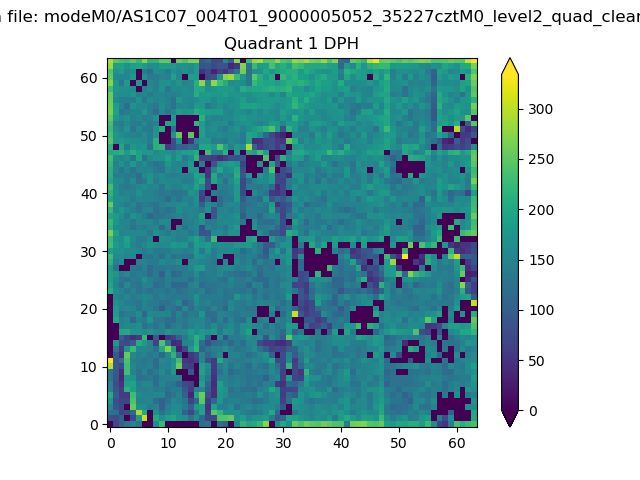 |
Quadrant B |
|---|---|---|---|
| Quadrant D | 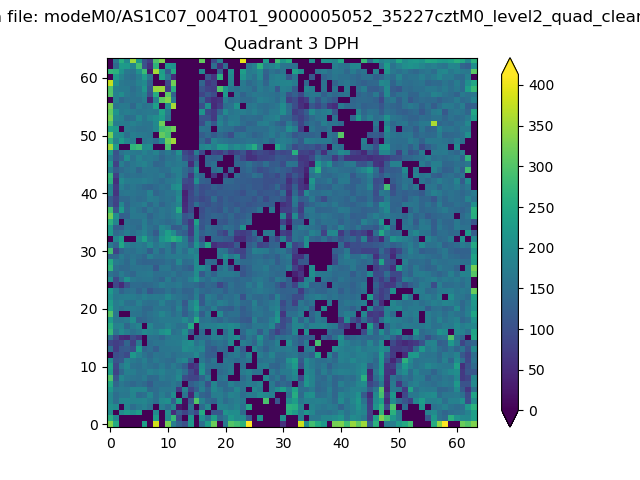 |
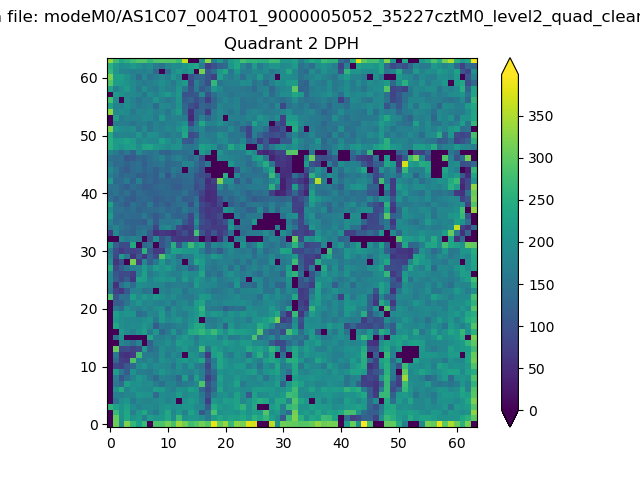 |
Quadrant C |
| Plot type | Count rate plots | Images |
|---|---|---|
| Comparison with Poisson distribution Blue bars denote a histogram of data divided into 1 sec bins. Red curve is a Poisson curve with rate = median count rate of data. |
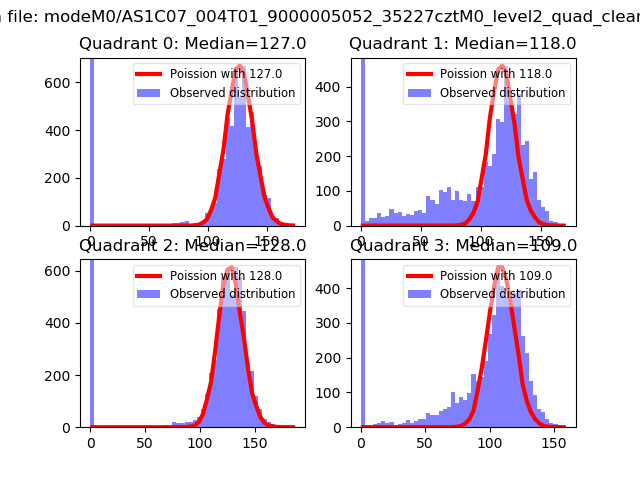 |
 |
| Quadrant-wise count rates Data is divided into 100 sec bins |
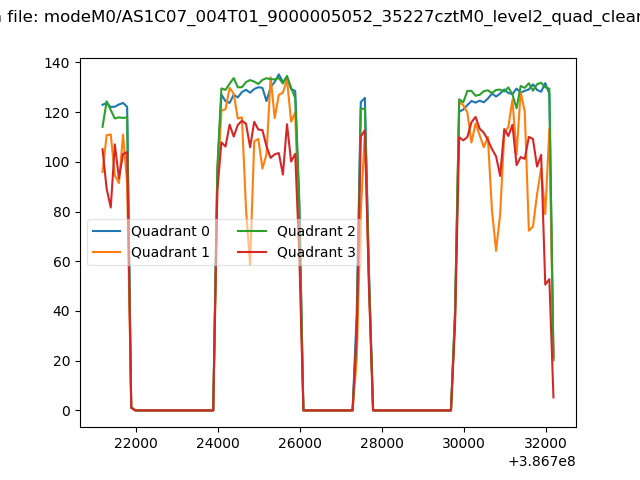 |
|
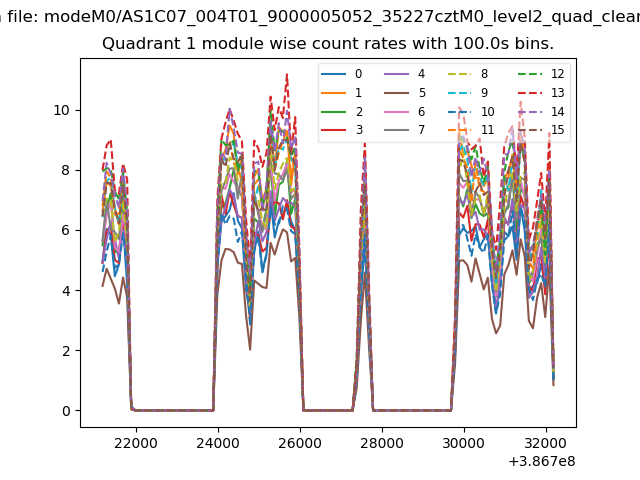
| Module-wise count rates for Quadrant A Data is divided into 100 sec bins |
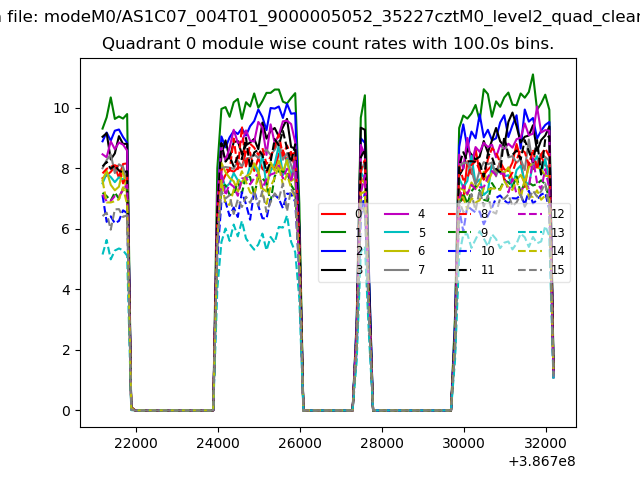 |
 |
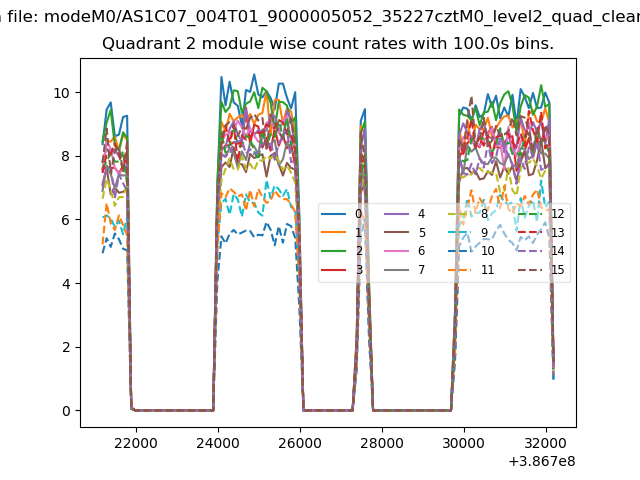
| Module-wise count rates for Quadrant B Data is divided into 100 sec bins |
 |
 |
| Module-wise count rates for Quadrant C Data is divided into 100 sec bins |
 |
 |
| Module-wise count rates for Quadrant D Data is divided into 100 sec bins |
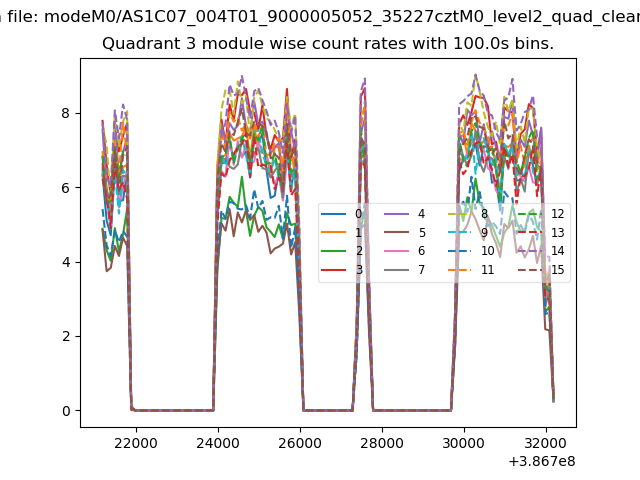 |
 |
| Parameter | Plot |
|---|---|
| CZT HV Monitor | 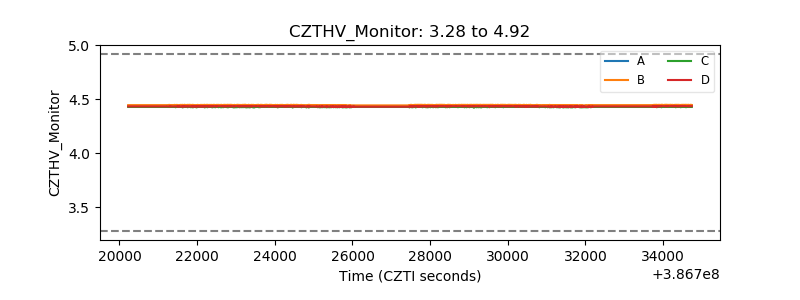 |
| D_VDD | 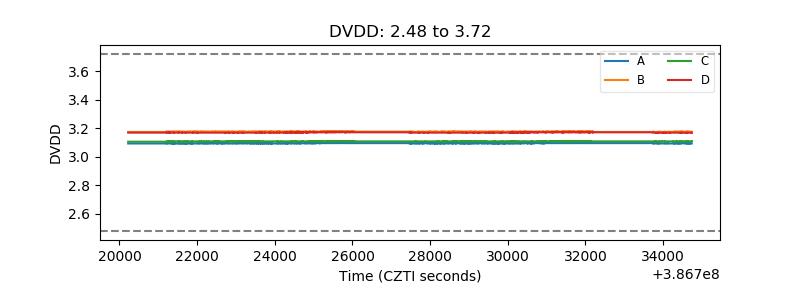 |
| Temperature 1 | 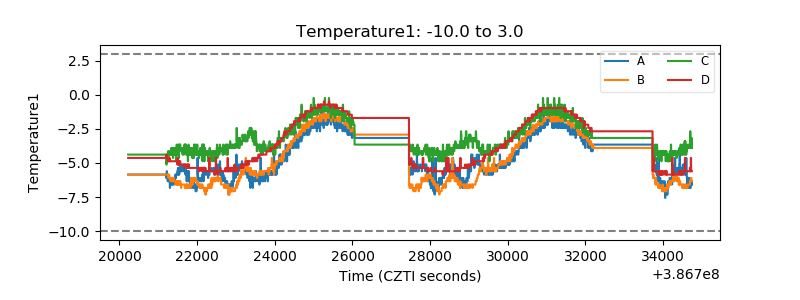 |
| Veto HV Monitor | 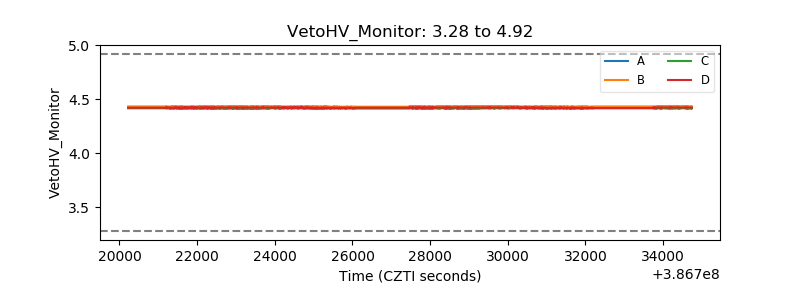 |
| Veto LLD | 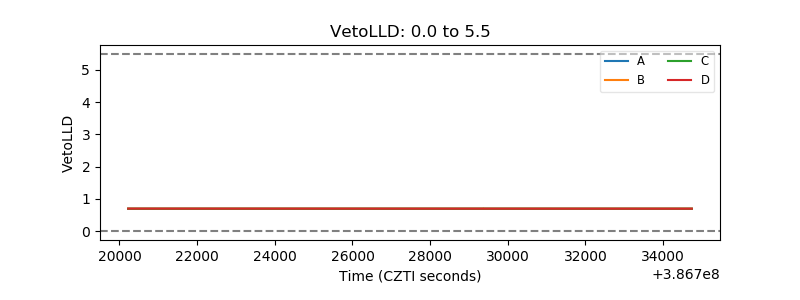 |
| Alpha Counter | 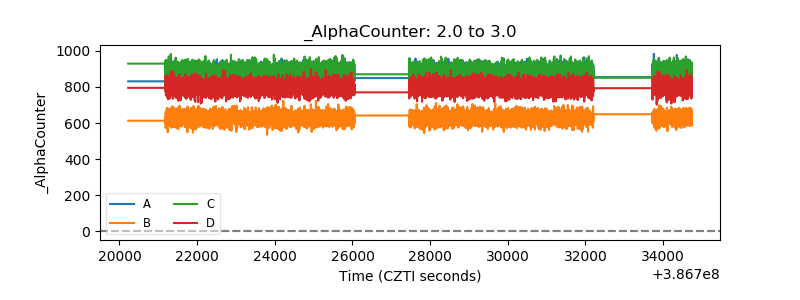 |
| _CPM_Rate | 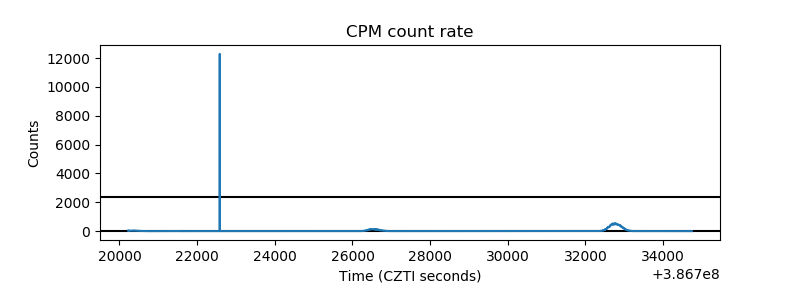 |
| CZT Counter | 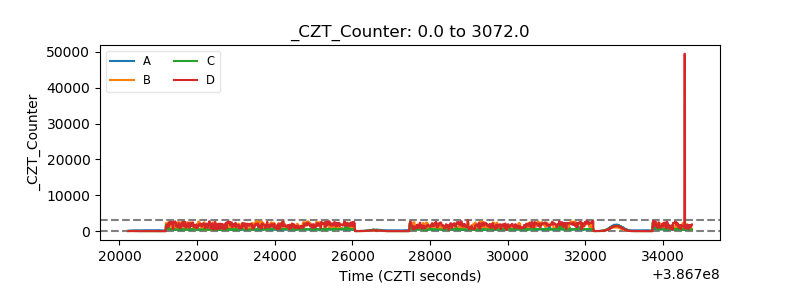 |
| +2.5 Volts monitor | 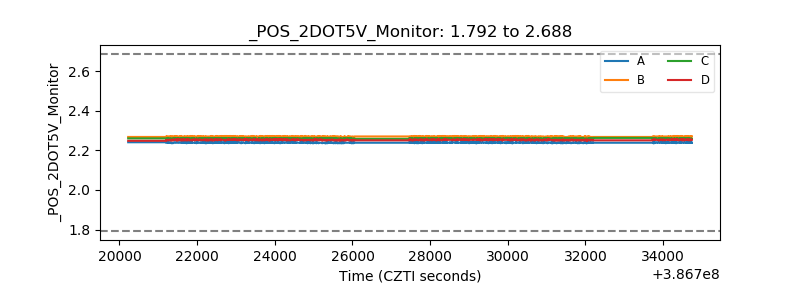 |
| +5 Volts monitor | 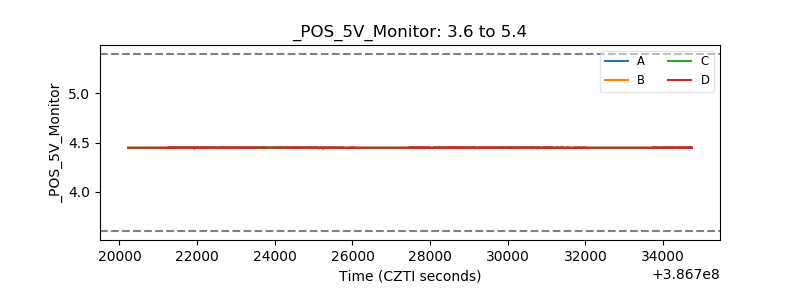 |
| _ROLL_ROT | 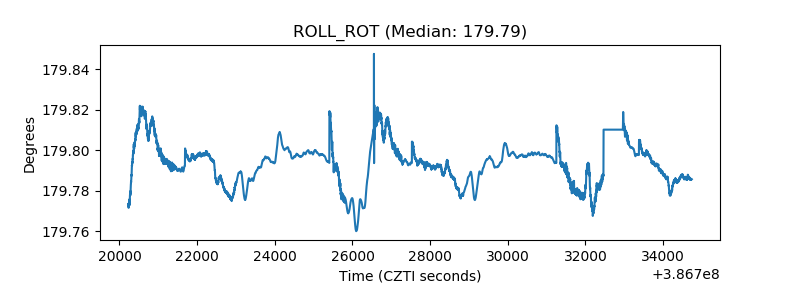 |
| _Roll_DEC | 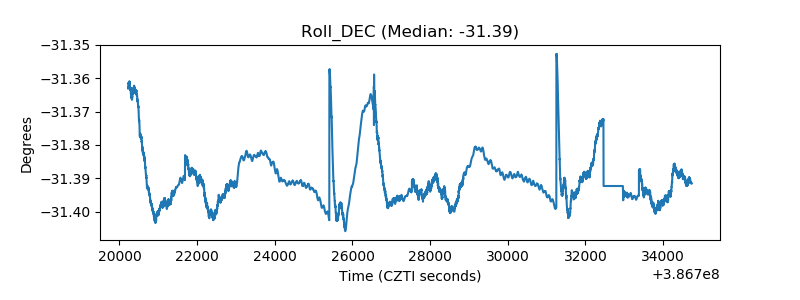 |
| _Roll_RA |  |
| Veto Counter | 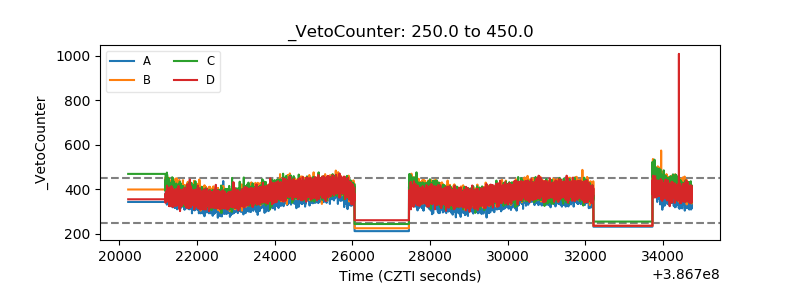 |