| Param | Original file | Final file |
|---|---|---|
| Filename | modeM0/AS1C07_004T01_9000005052_35223cztM0_level2.evt | modeM0/AS1C07_004T01_9000005052_35223cztM0_level2_quad_clean.evt |
| Size (bytes) | 877,368,960 | 65,908,800 |
| Size | 836.7 MB | 62.9 MB |
| Events in quadrant A | 2,721,751 | 455,593 |
| Events in quadrant B | 9,352,219 | 311,482 |
| Events in quadrant C | 3,093,280 | 452,909 |
| Events in quadrant D | 11,018,316 | 373,261 |
| Mode M0 | |||
|---|---|---|---|
| Quadrant | BADHDUFLAG | Total packets | Discarded packets |
| A | 0 | 11821 | 3 |
| B | 0 | 31694 | 2 |
| C | 0 | 12782 | 2 |
| D | 0 | 36675 | 2 |
| Mode SS | |||
|---|---|---|---|
| Quadrant | BADHDUFLAG | Total packets | Discarded packets |
| A | 0 | 116 | 0 |
| B | 0 | 116 | 0 |
| C | 0 | 116 | 0 |
| D | 0 | 116 | 0 |
| Mode M9 | |||
|---|---|---|---|
| Quadrant | BADHDUFLAG | Total packets | Discarded packets |
| A | 0 | 15 | 0 |
| B | 0 | 15 | 0 |
| C | 0 | 15 | 0 |
| D | 0 | 16 | 0 |
| Quadrant | Total seconds | Saturated seconds | Saturation percentage |
|---|---|---|---|
| A | 5732 | 9 | 0.157013% |
| B | 5732 | 2889 | 50.401256% |
| C | 5732 | 71 | 1.238660% |
| D | 5732 | 2481 | 43.283322% |
Noise dominated data is calculated using 1-second bins in cleaned event files. If a bin has >2000 counts, and if more than 50% of those come from <1% of pixels, then it is considered to be noise-dominated and hence unusable.
| Quadrant | # 1 sec bins | Bins with >0 counts | Bins with >2000 counts | High rate bins dominated by noise | Noise dominated (total time) | Noise dominated (detector-on time) | Marked lightcurve |
|---|---|---|---|---|---|---|---|
| A | 7106 | 5733 | 1 | 1 | 0.01% | 0.02% | 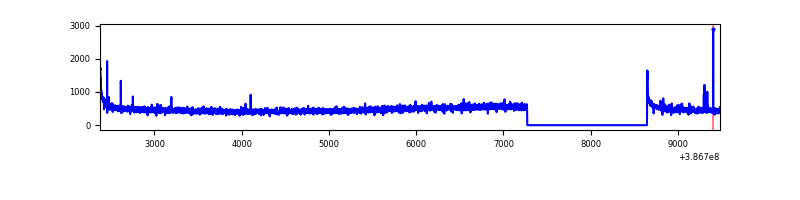 |
| B | 7105 | 5731 | 2130 | 2130 | 29.98% | 37.17% | 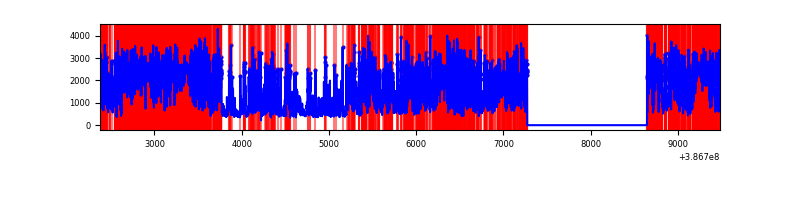 |
| C | 7106 | 5733 | 54 | 54 | 0.76% | 0.94% | 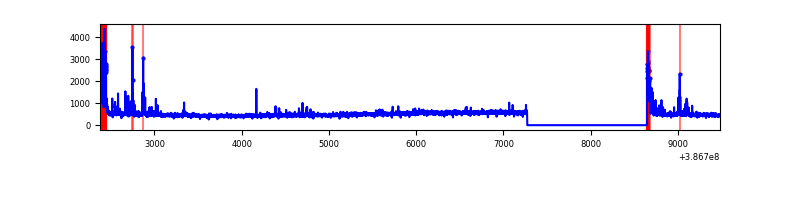 |
| D | 7106 | 5733 | 2799 | 2799 | 39.39% | 48.82% | 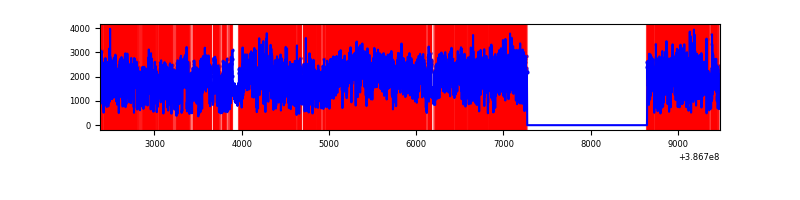 |
Top three noisy pixels from each quadrant. If the there are fewer than three noisy pixels in the level2.evt file, extra rows are filled as -1
| Pixel properties | Quadrant properties | ||||||
|---|---|---|---|---|---|---|---|
| Quadrant | DetID | PixID | Counts | Sigma | Mean | Median | Sigma |
| A | 10 | 83 | 105559 | 781.12 | 663 | 650 | 134.3 |
| A | 13 | 6 | 19625 | 141.28 | 663 | 650 | 134.3 |
| A | 9 | 143 | 18941 | 136.19 | 663 | 650 | 134.3 |
| B | 5 | 236 | 5662022 | 57045.24 | 513 | 500 | 99.2 |
| B | 5 | 172 | 1603662 | 16153.39 | 513 | 500 | 99.2 |
| B | 0 | 156 | 22468 | 221.35 | 513 | 500 | 99.2 |
| C | 15 | 214 | 239081 | 1590.66 | 640 | 645 | 149.9 |
| C | 0 | 10 | 200985 | 1336.51 | 640 | 645 | 149.9 |
| C | 1 | 23 | 97209 | 644.2 | 640 | 645 | 149.9 |
| D | 8 | 195 | 6708295 | 47630.55 | 575 | 560 | 140.8 |
| D | 1 | 47 | 1451448 | 10302.52 | 575 | 560 | 140.8 |
| D | 13 | 249 | 129149 | 913.09 | 575 | 560 | 140.8 |
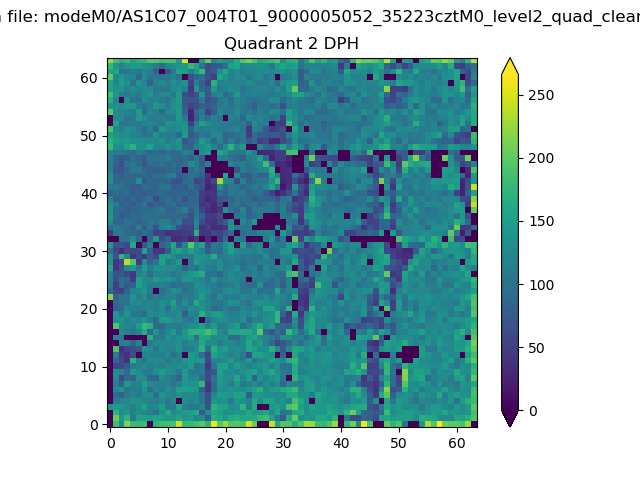
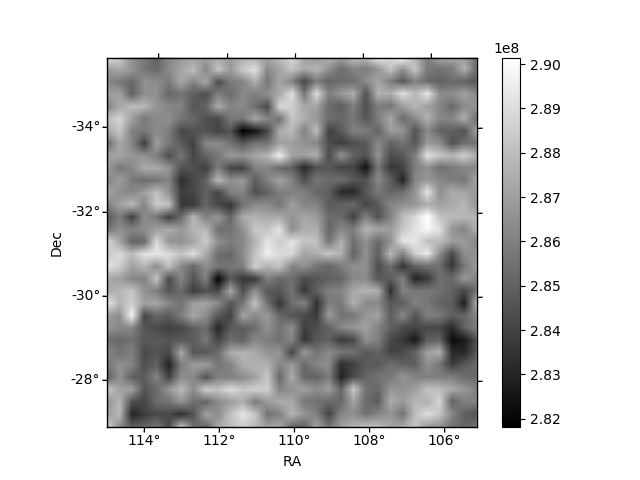
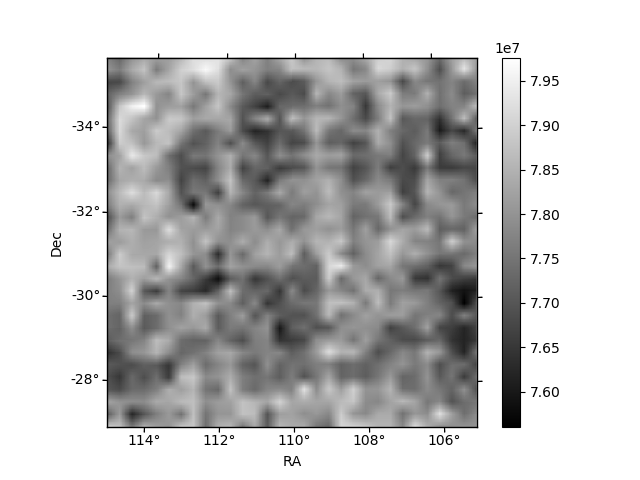
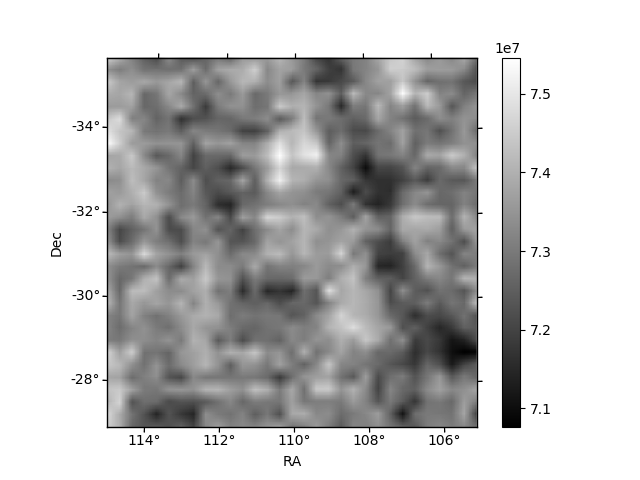
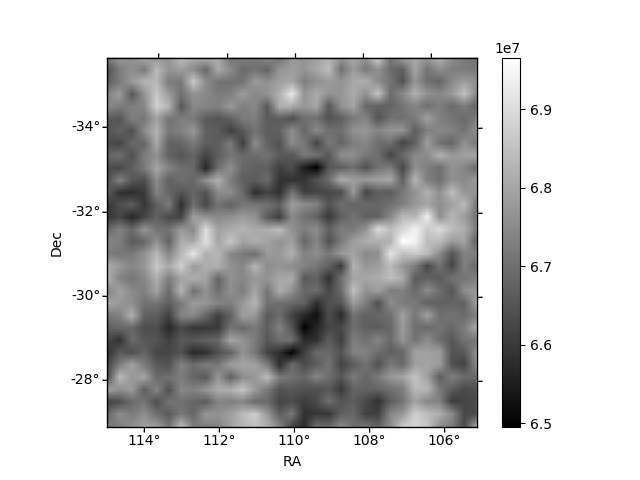
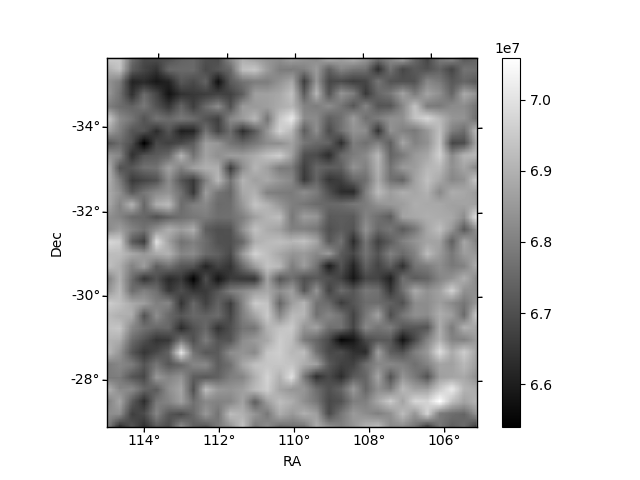
Histogram calculated using DETX and DETY for each event in the final _common_clean file
| Quadrant A | 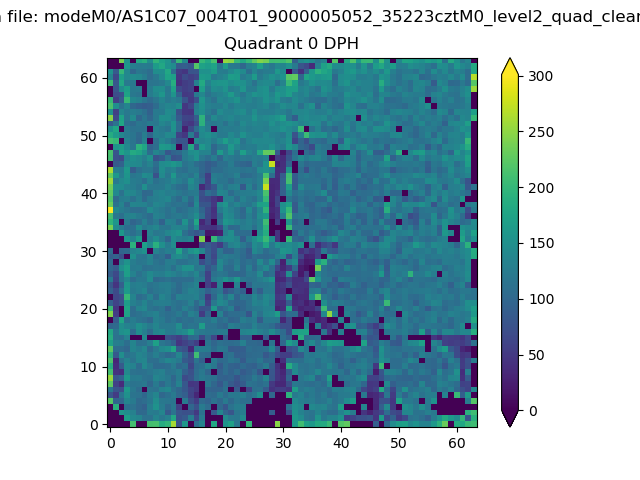 |
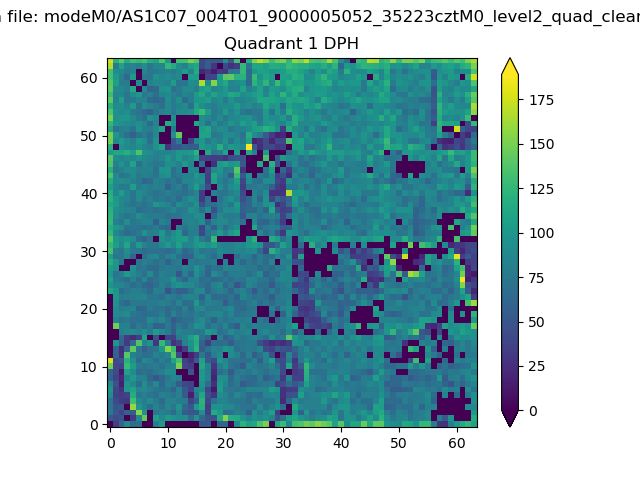 |
Quadrant B |
|---|---|---|---|
| Quadrant D | 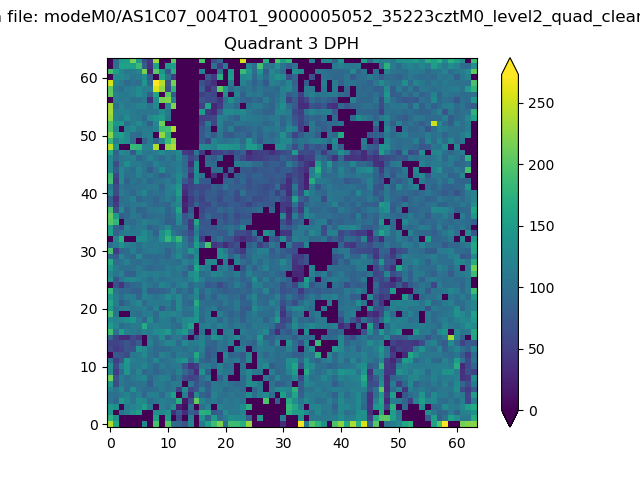 |
 |
Quadrant C |
| Plot type | Count rate plots | Images |
|---|---|---|
| Comparison with Poisson distribution Blue bars denote a histogram of data divided into 1 sec bins. Red curve is a Poisson curve with rate = median count rate of data. |
 |
 |
| Quadrant-wise count rates Data is divided into 100 sec bins |
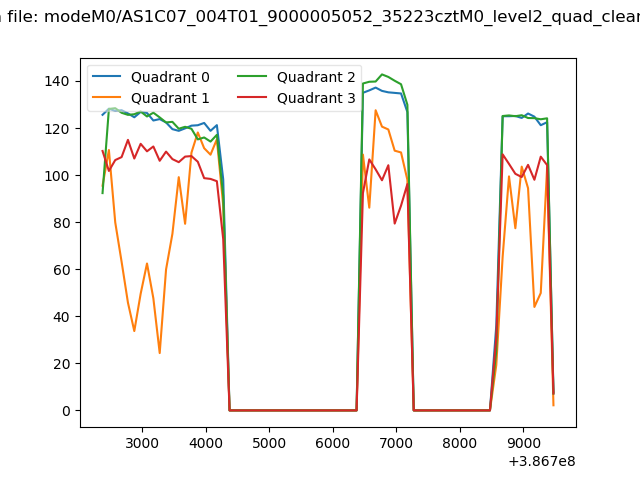 |
|
| Module-wise count rates for Quadrant A Data is divided into 100 sec bins |
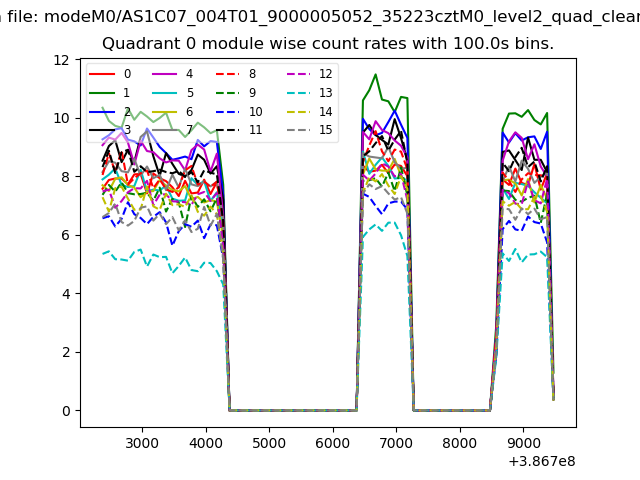 |
 |
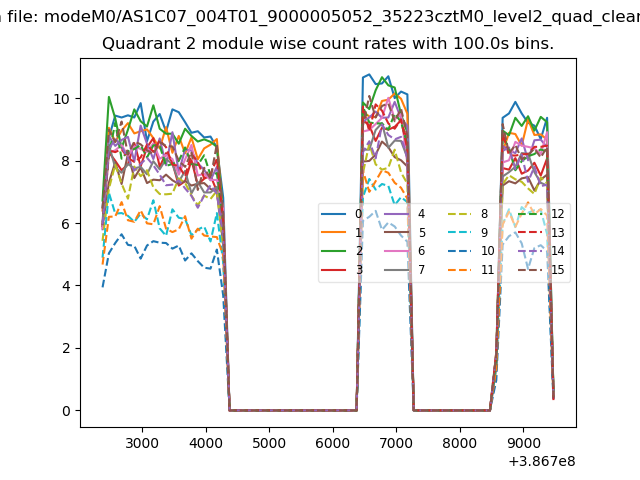
| Module-wise count rates for Quadrant B Data is divided into 100 sec bins |
 |
 |
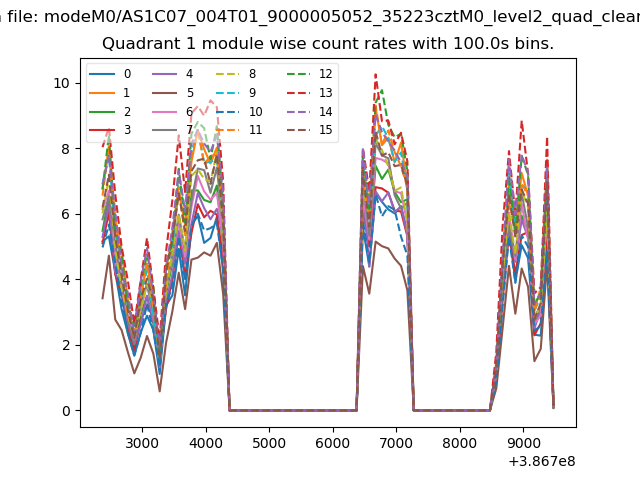
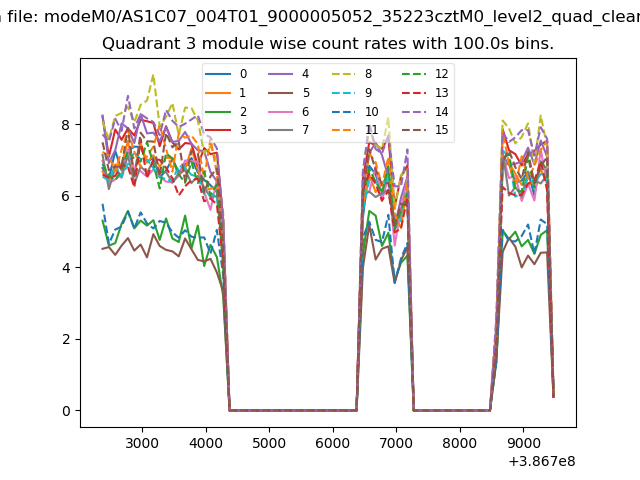
| Module-wise count rates for Quadrant C Data is divided into 100 sec bins |
 |
 |
| Module-wise count rates for Quadrant D Data is divided into 100 sec bins |
 |
 |
| Parameter | Plot |
|---|---|
| CZT HV Monitor |  |
| D_VDD | 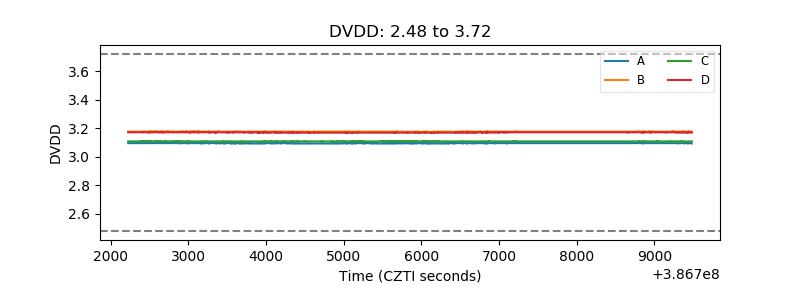 |
| Temperature 1 | 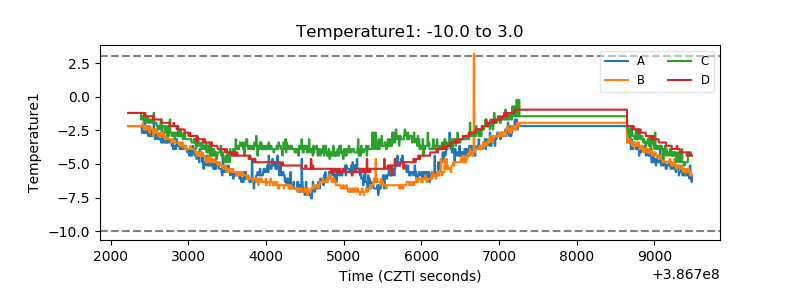 |
| Veto HV Monitor | 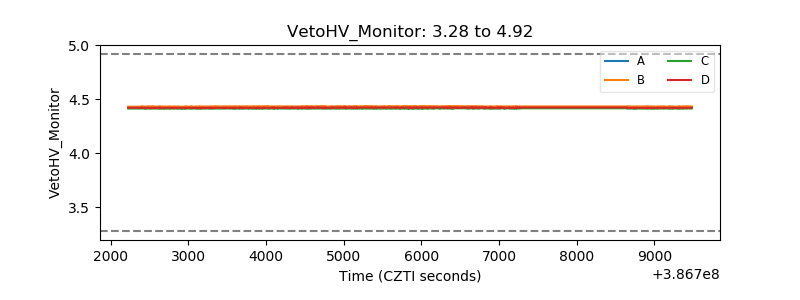 |
| Veto LLD | 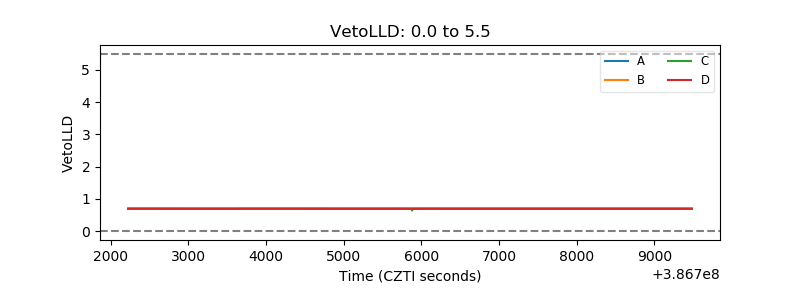 |
| Alpha Counter | 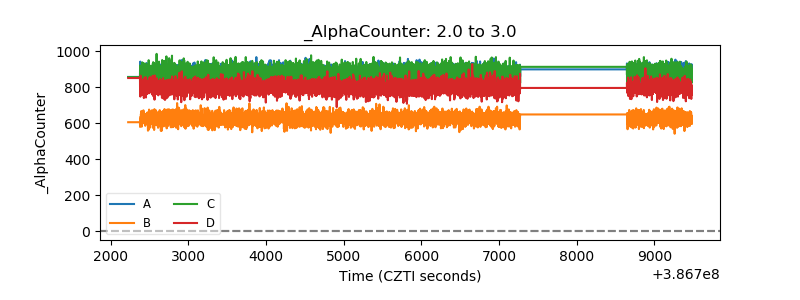 |
| _CPM_Rate | 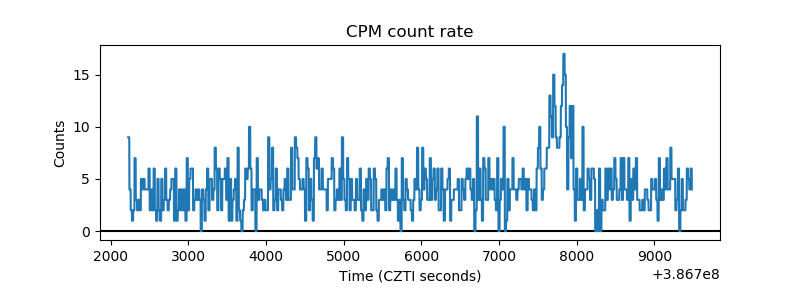 |
| CZT Counter | 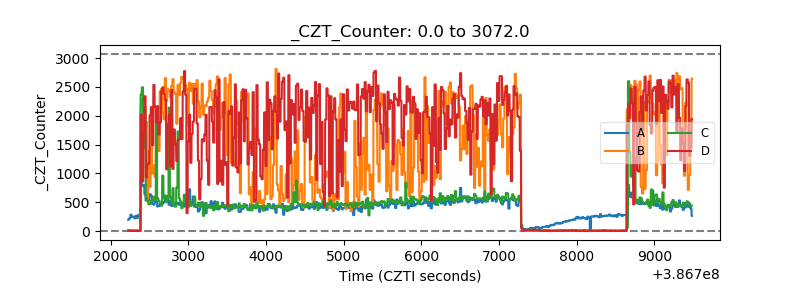 |
| +2.5 Volts monitor | 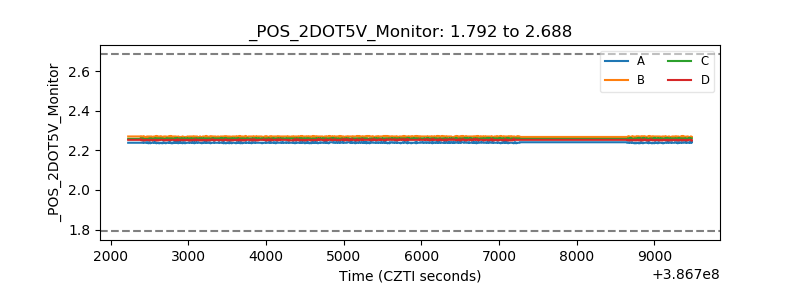 |
| +5 Volts monitor | 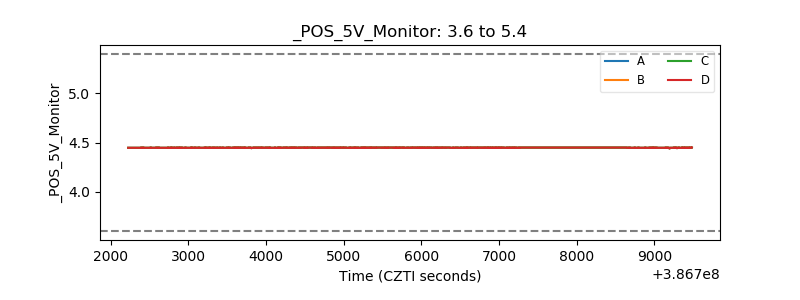 |
| _ROLL_ROT | 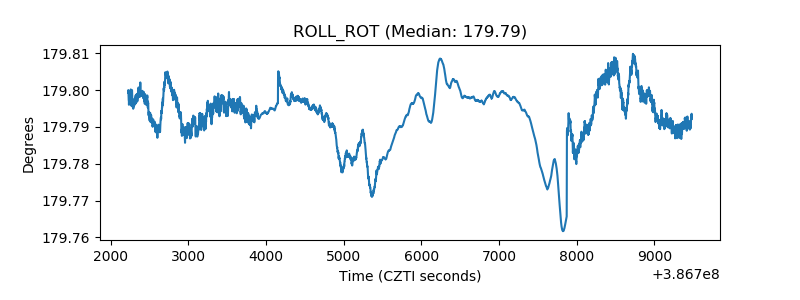 |
| _Roll_DEC | 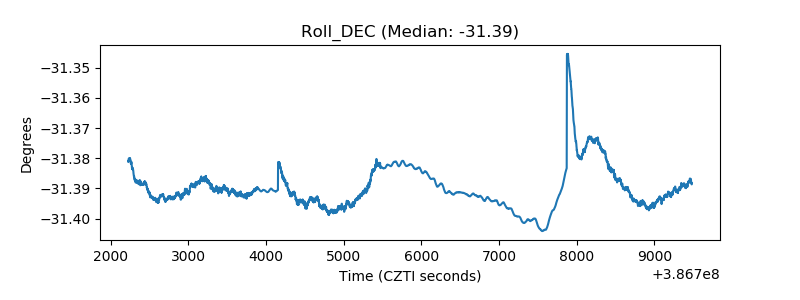 |
| _Roll_RA |  |
| Veto Counter | 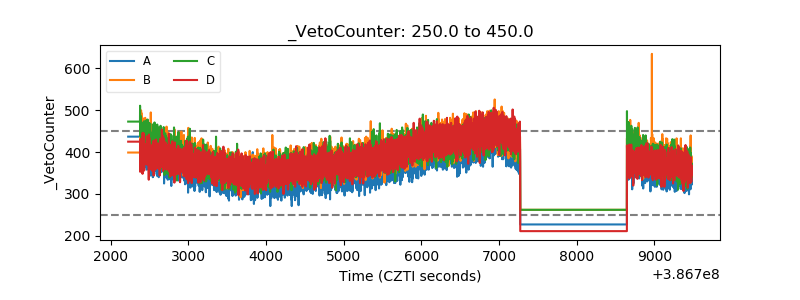 |